*A full list of authors and affiliations appears in the online version of this paper.
Particles directly produced at electron–positron colliders, such
as the J/
ψ meson, decay with relatively high probability into
a baryon–antibaryon pair
1. For spin-1/2 baryons, the pair can
have the same or opposite helicites. A non-vanishing phase
ΔΦ between the transition amplitudes to these helicity states
results in a transverse polarization of the baryons
2–4. From the
joint angular distribution of the decay products of the
bary-ons, this phase as well as the parameters characterizing the
baryon and the antibaryon decays can be determined. Here,
we report the measurement of
ΔΦ = 42.4 ± 0.6 ± 0.5° using
Λ → pπ
−and
Λ
→
p
π
+,
n
π
0decays at BESIII. We find a value for
the
Λ → pπ
−decay parameter of
α−
= 0.750 ± 0.009 ± 0.004,
17
± 3% higher than the current world average, which has
been used as input for all
Λ polarization measurements since
1978
5,6. For
Λ
→
p
π
+we find
α+
= −0.758 ± 0.010 ± 0.007,
giving A
CP= (α
−+ α
+)/(
α−
− α
+)
= −0.006 ± 0.012 ± 0.007, a
precise direct test of charge–parity symmetry (CP) violation
in
Λ decays.
At the Beijing Electron–Positron Collider II (BEPC II),
elec-trons and posielec-trons annihilate, creating a resonance. Here, we study
entangled pairs of baryons and antibaryons produced in the
pro-cess
e e
+ −→ ∕ →
J
ψ ΛΛ
, as illustrated in Fig.
1
. The J/
ψ resonance,
a spin-1 meson with mass 3096.900(6) MeV c
–2and decay width
92.9(28) keV (ref.
6), is produced at rest in a single photon
anni-hilation process, which subsequently decays into a
ΛΛ pair. The
transition between the initial electron–positron pair and the final
baryon–antibaryon pair includes helicity conserving and
helicity-flip amplitudes
7–11. Because the electron mass is negligible in
com-parison to the J/
ψ mass, the initial electron and positron helicities
have to be opposite. This implies that the angular distribution and
polarization of the produced
Λ and Λ particles can be described
uniquely by only two quantities: the
J
∕ →
ψ ΛΛ
angular distribution
parameter
α
ψand the helicity phase ΔΦ. The value of the parameter
α
ψis well known
12–14, but the parameter ΔΦ has never been
mea-sured before. If the phase difference ΔΦ is non-vanishing, Λ and Λ
will be polarized in the direction perpendicular to the production
plane, and the magnitude of the polarization depends on the angle
θ
Λbetween the
Λ momentum and the electron beam direction in the
J/ψ rest frame (Fig.
1
).
The polarization of weakly decaying particles, such as the
Λ
hyper ons, can be inferred from the angular distribution of the
daugh-ter particles. In the case of decay
Λ → pπ
−and with the
Λ hyperon
polarization given by the vector P
Λ, the angular distribution of the
daughter protons is
41π(1
+
α
−P n
Λ⋅
̂)
, where
̂
n is the unit vector along
the proton momentum in the
Λ rest frame. The asymmetry
para-meter
α
−of the decay is bounded by −1 ≤ α
−≤ 1 and characterizes
the degree of mixing of parity-conserving and parity-violating
amplitudes in the process
15. The corresponding asymmetry
param-eters
α
+for
Λ
→
p , α
π
+ 0for Λ → nπ
0and
α
0for
Λ
→ n
π
0are defined
in the same way
6. The joint angular distribution of
J
∕ →
ψ ΛΛ
(
Λ → f
and
Λ → f , f = pπ
−or n
π
0) depends on the
Λ and Λ polarization and
the spin correlation of the
ΛΛ pair via the parameters α
ψand ΔΦ.
The spin correlation implies a correlation between the directions of
the detected (anti-)nucleons. Together with the long lifetime of
Λ
and
Λ, this provides an example of a quantum entangled system as
defined in refs.
16,17. The joint angular distribution of the decay chain
ψ
Λ
π Λ
π
∕ → →
−→
+J
(
p
)(
p
) can be expressed as
4 W α Φ α α α θ α α θ α θ α α α α Φ θ θ α Φ θ θ α α ξ Δ = + + − + + + − Δ + + − Δ + ψ ψ Λ Λ ψ Λ ψ ψ Λ Λ ψ Λ Λ − + − + − + − +(1)
n n n n n n n n n n n n ( ; , , , ) 1 cos [sin ( ) (cos ) ]1 cos( )sin cos ( )
1 sin( ) sin cos ( )
x x y y z z x z z x y y 2 2 1, 2, 1, 2, 2 1, 2, 2 1, 2, 1, 2, 2 1, 2,
where
̂n
1(
̂n
2) is the unit vector in the direction of the nucleon
(antinucleon) in the rest frame of
Λ (Λ). The components of these
vectors are expressed using a coordinate system
( , , ) with the
x z
̂
ŷ
̂
orientation shown in Fig.
1
. The ̂z axis of both
Λ and Λ rest frames
is oriented along the
Λ momentum p
Λin the J/
ψ rest system. The ŷ
axis is perpendicular to the production plane and oriented along
the vector k
−× p
Λ, where k
−is the electron beam momentum in the
J/ψ rest system. The variable ξ denotes the set of kinematic variables
θ ̂ ̂
Λn n
( , , )
1 2, which uniquely specifies an event configuration. The
terms multiplied by
α
−α
+in equation (
1
) represent the contribution
from
ΛΛ spin correlations, while the terms multiplied by α
−and
α
+separately represent the contribution from the polarization, P
y:
θ
α
Φ
θ
θ
α
θ
=
−
Δ
+
Λ ψ Λ Λ ψ ΛP (cos )
1
sin(
)cos sin
1
cos
(2)
y
2
2
The presence of all three contributions in equation (
1
) enables an
unambiguous determination of the parameters
α
ψand ΔΦ and the
decay asymmetries
α
−,
α
+. If
Λ is reconstructed via its π
n
0decay,
the parameters
α
ψ,
ΔΦ and the decay asymmetries α
−and
α
0can
be determined independently, because the corresponding angular
distribution is obtained by replacing
α
+by
α
0and interpreting n
2as
the antineutron direction in equation (
1
). The case where
Λ decays
into n
π
0is not included in the present analysis because it suffers
Polarization and entanglement in baryon–
antibaryon pair production in electron–positron
annihilation
from low efficiency due to a selection criterion designed to suppress
the combinatorial background.
The BESIII experiment
18is located at the Beijing Electron–
Positron Collider (BEPCII), where the centre-of-mass energy can
be varied between 2 GeV and 4.6 GeV. The experiment is well
known for the recent discoveries of exotic four-quark hadrons
19,20.
The cross-section of the BESIII detector in the plane
perpendicu-lar to the colliding beams is shown in Fig.
2
. The inner part of the
detector is a cylindrical tracking system that allows the
determina-tion of the momenta of charged particles from the track curvature
in the magnetic field of a superconducting solenoid. An
electromag-netic calorimeter outside the tracker measures energies deposited
by particles. The signals from one
J
∕ → →
ψ
(
Λ
p
π Λ
−)(
→
p
π
+)
event are shown in Fig.
2
. A data sample of 1.31
× 10
9J/
ψ events is
used in the analysis. The
Λ hyperons are reconstructed using their
pπ
−decays and the
Λ hyperons using their π
p or
+n
π
0decays. The
event reconstruction and selection procedures are described in the
Methods. The resulting data samples are essentially
background-free, as shown in Supplementary Figs. 1 and 2. A sample of Monte
Carlo (MC) simulated events including all known J/
ψ decays is
used to determine the background contribution. The sizes of the
final data samples are 420,593 and 47,009 events, with an estimated
background of 399
± 20 and 66.0 ± 8.2 events for the π π
p p and
− +π π
−p n
0final states, respectively. For each event the full set of the
kinematic variables
ξ is reconstructed.
The free parameters describing the angular distributions for the
two data sets—
α
ψ, ΔΦ, α
−,
α
+and
α
0—are determined from a
simul-taneous unbinned maximum likelihood fit. In the fit, the likelihood
function is constructed from the probability density function for an
event characterized by the vector
ξ
(i):
P
( ; ,
ξ
( )iα
ψΔ
Φ α α
, , )
−=
CW
( ; ,
ξ
iα
ψΔ
Φ α α ϵ
, , ) ( )
−ξ
i(3)
2 ( ) 2 ( )
with
α
2= α
+and
α α
2=
0for the
p p and
π π
− +p n
π π
− 0data sets,
respectively. The joint angular distribution W
( ; ,
ξ
α
ψΔ
Φ α α
, , )
− 2is given by equation (
1
), and
ϵ ξ
( ) is the detection efficiency. The
normalization factor C
−1=
∫
W
( ; ,
ξ
α
ψΔ
Φ α α ϵ
, , ) ( )d
−ξ ξ
2
has to
be evaluated for each choice of parameters (
α
ψ,
ΔΦ, α
−,
α
2). The
maximum log likelihood fit including the normalization procedure
is described in the Methods. The resulting global fit describes the
multidimensional angular distributions very well, as illustrated in
Supplementary Figs. 3 and 4. For a crosscheck, the fit was applied to
the two data sets separately, and the obtained values of the
parame-ters agree within statistical uncertainties as shown in Supplementary
Table 1. The details of the fit as well the evaluation of the systematic
uncertainties are discussed in the Methods, and the contributions
to the systematic uncertainty are listed in Supplementary Table 2.
A clear polarization signal, strongly dependent on the
Λ
direc-tion, cos
θ
Λ, is observed for
Λ and Λ. In Fig.
3
, the moment
∑
μ
θ =
Λ−
=m
N
n
n
(cos )
(
)
(4)
i N y i y i 1 1, ( ) 2,( ) krelated to the polarization, is calculated for m = 50 bins in cos θ
Λ.
N is the total number of events in the data sample and N
kis the
number of events in the kth cos
θ
Λbin. The expected angular
depen-dence of the moment is
μ
θ
α α
α
θ
α
θ
= −
+
+
Λ ψ Λ ψ Λ −P
(cos )
2
1
cos
3
y( )
(5)
2 2for the acceptance corrected data. The helicity phase is determined
to be ΔΦ = (42.4 ± 0.6 ± 0.5)°, where the first uncertainty is statistical
and the second systematic. This corresponds to the
Λ and Λ
trans-verse polarization dependence on cos
θ
Λas shown in Supplementary
Fig. 5 with the maximum polarization of 24.8% (ref.
3). This large
value of ΔΦ enables a simultaneous determination of the decay
asymmetry parameters for
Λ → pπ
−,
Λ
→
p and
π
+Λ
→ n
π
0, as
shown in Table
1
. The value of
α
−= 0.750 ± 0.009 ± 0.004 differs
by more than 5 s.d. from the world average of
α
−PDG= .
0 642 0 013
± .
established in 1978 (PDG, Particle Data Group)
5. We note that the
two most precise results
21,22included in the average were obtained by
measuring the asymmetry in the secondary scattering of the
polar-ized protons from
Λ decays on a Carbon target. The α
−value was
then determined using a compilation of the polarized proton
scat-tering data on Carbon
23, which is no longer in use (data sets
24–26are
used instead). In addition, the average value
α
−PDGdoes not include
a systematical uncertainty of 5% mentioned in ref.
21, which points
to the need for a critical reevaluation of the
α
−PDGvalue. Considering
the caveats concerning the current world average
α
−PDG, our new
result implies that all published measurements on
Λ Λ
∕ polarization
derived using
α
−PDGare 17
± 3% too large. The value obtained for
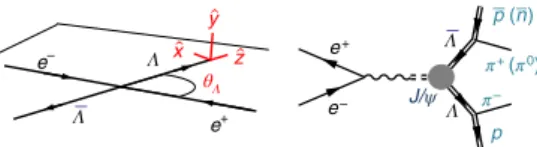
e– y x z e– J/ψ p p (n) e+ e+ θΛ π– π+ (π0) Λ Λ Λ ΛFig. 1 | Illustration of the e e+ −→ ∕ →Jψ ΛΛ process. Left: in the collision of
the e+ and e− beams with opposite momenta the J/ψ particle is created and decays into a ΛΛ pair. The Λ particle is emitted in the ̂z direction at an angle θΛ with respect to the e− beam direction, and the Λ is emitted
in the opposite direction. The hyperons are polarized in the direction perpendicular to the production plane (ŷ). The hyperons are reconstructed, and the polarization is determined by measuring their decay products: (anti-)nucleons and pions. Right: a Feynman diagram of ΛΛ pair production in e+e− annihilation with subsequent weak decays of Λ and Λ.
p 50 cm p π– – π+
Fig. 2 | an example J∕ψ → Λ → π Λ( p −)( →pπ+) event in the BESIII detector. Cross-section of the detector in the plane perpendicular to the colliding electron–positron beams and a schematic representation of the information collected for the event. The mean decay length of the neutral Λ Λ( ) is 5 cm. The curved tracks of the charged particles from the subsequent Λ Λ( ) decays are registered in the drift chamber, indicated by the brown region of the display. The momenta of (anti-)baryons are greater than 750 MeV c−1 and pions are less than 300 MeV c−1.
NaTurE PhySICS | VOL 15 | JULY 2019 | 631–634 | www.nature.com/naturephysics
the ratio
α α
0∕
+is 3
σ smaller than unity, indicating an isospin
three-half contribution to the final state
27–29. The reported values of
α
−
and
α
+, along with the covariance (reported in the Methods), enable a
calculation of the CP odd observable A
CP= (α
−+ α
+)/(
α
−− α
+) =
−0.006 ± 0.012 ± 0.007, where the uncertainties refer to statistical
and systematic, respectively. This is the most sensitive test of CP
violation for
Λ baryons with a substantially improved precision
over previous measurements
30(Table
1
) using a direct method.
The Standard Model calculations predict A
CP≈ 10
−4(ref.
31), while
larger values are expected in various extensions of the Standard
Model aiming to explain the observed baryon–antibaryon
asym-metry in the universe
32. This new method to test for CP violation
in baryon decays is expected to reach sensitivities comparable to
theoretical predictions when larger data sets of foreseen
experi-ments become available.
Online content
Any methods, additional references, Nature Research reporting
summaries, source data, statements of code and data availability and
associated accession codes are available at
https://doi.org/10.1038/
s41567-019-0494-8
.
Received: 30 May 2018; Accepted: 11 March 2019;
Published online: 6 May 2019
references
1. Kopke, L. & Wermes, N. J/ψ decays. Phys. Rep. 174, 67–227 (1989).
2. Cabibbo, N. & Gatto, R. Electron positron colliding beam experiments. Phys.
Rev. 124, 1577–1595 (1961).
3. Brodsky, S. J., Carlson, C. E., Hiller, J. R. & Hwang, D. S. Single spin polarization effects and the determination of time-like proton form-factors.
Phys. Rev. D 69, 054022 (2004).
4. Fäldt, G. & Kupsc, A. Hadronic structure functions in the e e+ −→Λ Λ
reaction. Phys. Lett. B 772, 16–20 (2017).
5. Bricman, C. et al. Review of particle properties. Phys. Lett. B 75, 1–250 (1978). 6. Tanabashi, M. et al. Review of particle physics. Phys. Rev. D 98, 030001 (2018). 7. Dubnickova, A. Z., Dubnicka, S. & Rekalo, M. P. Investigation of the nucleon
electromagnetic structure by polarization effects in e e+ −→NN processes.
Nuovo Cim. A 109, 241–256 (1996).
8. Gakh, G. I. & Tomasi-Gustafsson, E. General analysis of polarization phenomena in e++ → +e− N N for axial parametrization of two-photon
exchange. Nucl. Phys. A 771, 169–183 (2006).
9. Czyz, H., Grzelinska, A. & Kuhn, J. H. Spin asymmetries and correlations in lambda-pair production through the radiative return method. Phys. Rev. D 75, 074026 (2007).
10. Fäldt, G. Entanglement in joint ΛΛ decay. Eur. Phys. J. A 51, 74 (2015).
11. Fäldt, G. Polarization observables in the e e+ −→Λ Λ reaction. Eur. Phys. J. A 52, 141 (2016).
12. Bai, J. Z. et al. Decays of the J/ψ to ΛΛ ΛΛ γ, and ΛΛ ΛΛ γ, final states.
Phys. Lett. B 424, 213–218 (1998). Erratum 438, 447 (1998).
13. Ablikim, M. et al. Measurement of J/ψ decays into ΛΛ π π+ −. Chin. Phys. C 36,
1031–1039 (2012).
14. Ablikim, M. et al. Study of J/ψ and ψ(3686) decay to ΛΛ and ΛΛ final states. Phys. Rev. D 95, 052003 (2017).
15. Lee, T. D. & Yang, C.-N. General partial wave analysis of the decay of a hyperon of spin 1/2. Phys. Rev. 108, 1645–1647 (1957).
16. Tornqvist, N. A. Suggestion for Einstein–Podolsky–Rosen experiments using reactions like e e+ −→ΛΛ π π→ −p p. Found. Phys. 11, +
171–177 (1981).
17. Hiesmayr, B. C. Limits of quantum information in weak interaction processes of hyperons. Sci. Rep. 5, 11591 (2015).
18. Ablikim, M. et al. Design and construction of the BESIII detector.
Nucl. Instrum. Methods A614, 345–399 (2010).
19. Ablikim, M. et al. Observation of a charged charmonium like structure in
π π ψ
→ ∕
+ − + −
e e J at s 4 26 GeV. Phys. Rev. Lett. 110, 252001 (2013).= . 20. Shepherd, M. R., Dudek, J. J. & Mitchell, R. E. Searching for the rules that
govern hadron construction. Nature 534, 487–493 (2016).
21. Overseth, O. E. & Roth, R. F. Time reversal invariance in Λ0 decay. Phys. Rev.
Lett. 19, 391–393 (1967).
22. Cleland, W. E. et al. A measurement of the beta-parameter in the charged nonleptonic decay of the Λ0 hyperon. Nucl. Phys. B40,
221–254 (1972).
23. Peterson, V. Z. Analyzing Power of Carbon for High-Energy Polarized Protons Report No. LRL-UCRL-10622 https://escholarship.org/uc/item/7777n2h0
(1963).
24. Besset, D. et al. Proton Carbon analyzing power between 300 MeV and 560 MeV. Nucl. Instrum. Methods 166, 379–389 (1979).
25. Aprile-Giboni, E. et al. Proton carbon effective analyzing power between 95 MeV and 570 MeV. Nucl. Instrum. Methods 215, 147–157 (1983). 26. Mcnaughton, M. W. et al. The p-C analyzing power between 100 MeV and
750 MeV. Nucl. Instrum. Methods A241, 435–440 (1985).
27. Overseth, O. E. & Pakvasa, S. Final-state interactions in nonleptonic hyperon decay. Phys. Rev. 184, 1663–1667 (1969).
28. Olsen, S. et al. Asymmetry parameter for Λ0 → nπ0. Phys. Rev. Lett. 24,
843–847 (1970).
29. Cheng, H.-Y. Status of the ΔI = 1/2 rule in kaon decay. Int. J. Mod. Phys. A4, 495 (1989).
30. Barnes, P. D. et al. Observables in high statistics measurements of the reaction p p→Λ Λ. Phys. Rev. C 54, 1877–1886 (1996).
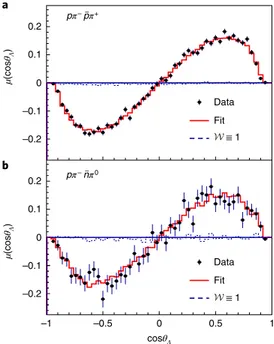
–0.2 –0.1 0 0.1 0.2 a pπ– pπ+ –1 –0.5 0 0.5 1 0 0.1 0.2 Data Fit Data Fit ≡ 1 µ(cos θΛ ) cosθΛ µ(cos θΛ ) –0.2 –0.1 pπ– nπ0 b ≡ 1
Fig. 3 | The polarization signal for ( )Λ Λ in e e+ −→ ∕ →Jψ ΛΛ. a,b, For each
event, the weight (niy−n )
y i
1,( ) 2,( ) is calculated and the average weight μ(cosθΛ)
is obtained using equation (4) for m = 50 bins in cosθΛ. The moments
μ(cosθΛ) are plotted as a function of cosθΛ for π πp p (− + a) and π πp n− 0 (b)
data sets. Filled circles indicate BESIII data and solid red lines show the result of the global fit based on equation (3). The dashed line represents the expected distribution without polarization W( ; 0, 0, 0, 0) 1 in ξ ≡ equation (3). The errors are 1 s.d. statistical and calculated by error propagation of equation (4).
Table 1 | Summary of the results
Parameters This work Previous results
αψ 0.461 ± 0.006 ± 0.007 0.469 ± 0.027 (ref. 14) ΔΦ 42.4 ± 0.6 ± 0.5° – α− 0.750 ± 0.009 ± 0.004 0.642 ± 0.013 (ref. 6) α+ −0.758 ± 0.010 ± 0.007 −0.71 ± 0.08 (ref. 6) α0 −0.692 ± 0.016 ± 0.006 – ACP −0.006 ± 0.012 ± 0.007 0.006 ± 0.021 (ref. 6) α α∕0 + 0.913 ± 0.028 ± 0.012 –
Parameters: ψ ΛΛJ∕ → angular distribution parameter αψ, helicity phase ΔΦ, asymmetry parameters for the Λ → pπ− (α
−), Λ→p (απ+ +) and Λ→ nπ0 α( )0 decays, CP asymmetry ACP and
ratio α α∕0 +. The first uncertainty is 1 s.d. statistical, and the second is systematic, calculated as described in the Methods.
31. Donoghue, J. F., He, X.-G. & Pakvasa, S. Hyperon decays and CP nonconservation. Phys. Rev. D 34, 833–842 (1986).
32. Bigi, I. I., Kang, X.-W. & Li, H.-B. CP asymmetries in strange baryon decays.
Chin. Phys. C 42, 013101 (2018).
acknowledgements
The BESIII collaboration thanks the staff of BEPCII and the IHEP computing centre for their support. This work is supported in part by the National Key Basic Research Program of China under contract no. 2015CB856700; the National Natural Science Foundation of China (NSFC) under contract nos. 11335008, 11375205, 11425524, 11625523, 11635010, 11735014, 11835012 and 11875054; the Chinese Academy of Sciences (CAS) Large-Scale Scientific Facility Program; the CAS Center for Excellence in Particle Physics (CCEPP); Joint Large-Scale Scientific Facility Funds of the NSFC and CAS under contract nos. U1532257, U1532258, U1732102, U1732263 and U1832207; CAS Key Research Program of Frontier Sciences under contract nos. QYZDJ-SSW-SLH003 and QYZDJ-SSW-SLH040; 100 Talents Program of CAS; the CAS President’s International Fellowship Initiative; INPAC and Shanghai Key Laboratory for Particle Physics and Cosmology; German Research Foundation DFG under the contracts Collaborative Research Center CRC 1044 and FOR 2359; Istituto Nazionale di Fisica Nucleare, Italy; Koninklijke Nederlandse Akademie van Wetenschappen (KNAW) under contract no. 530-4CDP03; Ministry of Development of Turkey under contract no. DPT2006K-120470; National Science and Technology fund; The Swedish Research Council; the Knut and Alice Wallenberg Foundation; US Department of Energy under contract nos. DE-FG02-05ER41374, DE-SC-0010118, DE-SC-0010504 and DE-SC-0012069; University of Groningen (RuG); Helmholtzzentrum fuer
Schwerionenforschung GmbH (GSI), Darmstadt. All consortium work was carried out at affiliations 1–67.
author contributions
All authors have contributed to this publication, being variously involved in the design and construction of the detectors, writing software, calibrating sub-systems, operating the detectors, acquiring data and analysing the processed data.
Competing interests
The authors declare no competing interests.
additional information
Supplementary information is available for this paper at https://doi.org/10.1038/ s41567-019-0494-8.
Reprints and permissions information is available at www.nature.com/reprints. Correspondence and requests for materials should be addressed to A.Kupsc. Journal peer review information: Nature Physics thanks Anna Zuzana Dubnickova, Ulrik Egede and Ilya Selyuzhenkov for their contribution to the peer review of this work. Publisher’s note: Springer Nature remains neutral with regard to jurisdictional claims in published maps and institutional affiliations.
© The Author(s), under exclusive licence to Springer Nature Limited 2019
NaTurE PhySICS | VOL 15 | JULY 2019 | 631–634 | www.nature.com/naturephysics
Methods
Monte Carlo simulation. The optimization of event selection criteria and the estimation of backgrounds are based on Monte Carlo (MC) simulations. The Geant4-based simulation software includes the geometry and the material description of the BESIII spectrometer, the detector response and the digitization models, as well as the database of the running conditions and detector performance. Production of the J/ψ resonance is simulated by the MC event
generator kkmc33; the known decays are generated by Besevtgen34,35 with branching
ratios set to the world average values6, and missing decays are generated by the
Lundcharm36 model with optimized parameters37. Signal and background events
are generated using helicity amplitudes. For the signal process J∕ →ψ ΛΛ, the angular distribution of equation (1) is used. For the backgrounds, J∕ →ψ Σ Σ0 0, Σ Σ+ − and ΛΣ + . .0 c c decays, the helicity amplitudes are taken from ref. 38 and the
angular distribution parameters are fixed to −0.24 (ref. 39) for J∕ →ψ Σ Σ0 0 and
ψ Σ Σ
∕ → + −
J and to 0.38 (ref. 40) for J∕ →ψ ΛΣ0+ . .c c
General selection criteria. Charged tracks detected in the main drift chamber (MDC) must satisfy |cos θ| < 0.93, where θ is the polar angle with respect to the
positron beam direction. No additional particle identification requirements are applied to select the tracks. Showers in the electromagnetic calorimeter (EMC) not associated with any charged track are identified as photon candidates if they fulfil the following requirements: the deposited energy is required to be larger than 25 MeV and 50 MeV for clusters reconstructed in the barrel (|cos θ| < 0.8)
and end cap (0.86 < |cos θ| < 0.92), respectively. To suppress electronic noise and showers unrelated to the event, the EMC time difference from the event start time is required to be within [0, 700] ns. To remove showers originating from charged particles, the angle between the shower position and charged tracks extrapolated to the EMC must be greater than 10°.
Selection of J∕ →ψ ΛΛ Λ, →pπ−, Λ→p . Events with at least four charged π+
tracks are selected. Fits of the Λ and Λ vertices are performed using all pairs of
positive and negative charged tracks. There should be at least one ΛΛ pair in an
event. If more than one set of ΛΛ pairs is found (the fraction of such events is
1.18%), the one with the smallest value of (Mpπ−−MΛ)2+(Mpπ+−MΛ)2, where MΛ is the nominal Λ mass, is retained for further analysis. A four-constraint
kinematic fit imposing overall energy–momentum conservation (4C-fit) is performed with the Λ → pπ− and Λ→p hypothesis, and events with χπ+ 2< 60
are retained. The invariant masses of pπ− and p are required to be within π+
∣Mpπ−−MΛ∣< 5 MeV c−2 and ∣Mpπ+− ∣MΛ< 5 MeV c−2. The pπ− and p invariant π+
mass spectra and the selection windows are shown in Supplementary Fig. 1. Selection of J∕ →ψ ΛΛ Λ, →pπ Λ−, →nπ0. Events with at least two charged
tracks and at least three showers are selected. Two showers, consistent with being photons, are used to reconstruct the π0 candidates, and the invariant mass of the
photon pair is required to be in the interval [0.12, 0.15] GeV c−2. To improve the
momentum resolution, a mass-constrained fit to the π0 nominal mass is applied
to the photon pairs, and the resulting energy and momentum of the π0 are used
for further analysis. Candidates for Λ are formed by combining two oppositely
charged tracks into the final states pπ−. The two daughter tracks are constrained
to originate from a common decay vertex by requiring the χ2 of the vertex fit to
be less than 100. The maximum energy for the photons from π0 decays in these
events is 300 MeV. Therefore, showers produced by n can be uniquely identified by selecting the cluster with an energy deposit larger than 350 MeV. In addition, the second moment of the cluster is required to be larger than 20 cm2. The moment
is defined as ∑i i iE r2∕ ∑i iE, where E
i is the deposited energy in the ith crystal,
and ri is the radial distance of the crystal i from the cluster centre. To select the
ψ π π
∕ → Λ −Λ
J (p ) (n 0) candidate events, a one-constraint (1C) kinematic fit is performed, where the momentum of the anti-neutron is unmeasured. The selected events are required to have a χ12C n− of the 1C kinematic fit less than 10, and if there
is more than one combination, the one with the smallest χ12C n− value is chosen. To
further suppress background contributions, we require ∣Mpπ−−MΛ∣< 5 MeV c−2, where MΛ is the nominal Λ mass. Supplementary Fig. 2 shows the invariant mass
(Mn 0π) of the nπ0 pair and the mass
π
Λ MRecoiling
0 recoiling against the Λπ0, where
= + − →+→
π π π
Mn (En E ) (2 P Pn )2
0 0 0 , →= − →+→Pn (P PΛ π0) is evaluated in the rest frame
of J/ψ, and = ∣→ ∣ +En Pn 2 Mn2 (with M
n the nominal neutron mass). The signal
regions are defined as ∣Mn 0π− ∣MΛ< 23 MeV c−2 and ∣MΛRecoilingπ0 − ∣Mn < 7 MeV c−2 as
shown in Supplementary Fig. 2. The above selection strategy is not suitable for the channel J∕ → Λ Λ→ψ Λ, nπ Λ0, →pπ+. The reason for this is the requirement of
the energy deposit of 350 MeV used to identify the neutron cluster. We estimate that the overall efficiency would be lower by at least a factor of four with respect to the J∕ → Λ Λ→ψ Λ, pπ Λ−, →nπ0 channel.
Background analysis. The potential backgrounds are studied using the inclusive MC sample for J/ψ decays. After applying the same selection criteria as for the
signal, the main backgrounds for the Λ→p final state are from π+ J∕ →ψ γΛΛ, Σ
Λ + . .0 c c, Σ0 0Σ, Δ++pπ−+ . .c c , Δ Δ++ −− and p p decays. Decays of π π− +
ψ Σ
∕ → Λ + . .
J 0 c c and Σ0 0Σ are generated using the helicity amplitudes and include
subsequent Λ and Λ decays. The remaining decay modes are generated according
to the phase space model, and the contribution is shown in Supplementary Fig. 1. For the Λ→ nπ0 final state, the dominant background processes are from
the decay modes J∕ψ → Λγ Λ, Λ + . .Σ0 c c, Σ Λ0( ) ( )γ Σ γΛ0 , Σ+(pπ Σ0) (−nπ−)
and Λ(pπ Λ π−) (p +). Exclusive MC samples for these background channels
are generated and used to estimate the background contamination shown in Supplementary Fig. 2.
The global fit. Based on the joint angular distribution shown in equation (1), a simultaneous fit is performed to the two data sets according to the decay modes:
ψ Λ π Λ π ψ Λ π Λ π ∕ → Λ Λ→ → ∕ → Λ Λ→ → − + − J p p J p n I : , and II : , and 0
There are three common parameters (αψ, ΔΦ and α−) and two separate parameters
(α+ and α0) for the Λ decays to πp and + nπ0, respectively. For data set I, the joint
likelihood function is defined as38
L P C W
∏
∏
ξ α Φ α ξ α Φ ϵ ξ = Δ α = Δ α α ψ ψ = − + = − + ( ; , , , ) ( ) ( ; , , , ) ( ) (6) i N i N i N i i I 1 I ( ) I 1 I ( ) I ( ) I I Iwhere P( ; ,ξ α Δ α αI( )i ψ Φ, , )− + is the probability density function defined in
equation (3) and evaluated for the kinematic variables ξi
I
( ) of event i, and
W( ; ,ξ α ΔΦ α αI( )i ψ , , )− + is defined in equation (1). The detection efficiency terms, ϵ ξ( )i
I
( ), can be set arbitrarily to one because they do not influence the minimization
of the function −lnLI with respect to the parameters α
ψ, ΔΦ, α− and α+. The
normalization factor C( )I 1− =NMC1 ∑Nj=MC1 W(ξ( )jI; ,αψΔΦ, , )α α− + is estimated with
the accepted NMC events, which are generated with the phase space model, undergo
detector simulation and are selected with the same event criteria as for data. To ensure an accurate value for the normalization factor, NMC is 7,850,525 for ppπ π+ −
and 907,253 for pnπ π+ 0. The definition of the likelihood function for data set II,
LII, is the same except for its calculation with different parameters and data set. To determine the parameters, we use the package MINUIT from the CERN library41 to
minimize the function defined as
L L L L
= − − + .+ .
S ln dataI ln dataII ln bgI ln bgII (7) where Lln dataI(II) and Lln bgI(II). are the likelihood functions for the two data sets and the
background events taken from simulation, respectively. The results of the separate fits for the two data sets are given in Supplementary Table 1. We compare the fit with the data using moments T1, …, T5 directly related to the terms in equation (1).
The moments are calculated for 100 bins in cos θΛ and are explicitly given by
∑
∑
∑
∑
∑
θ θ θ θ θ θ θ θ θ = + = − + = − = − = − Λ Λ Λ Λ Λ Λ Λ Λ Λ = = = = = T n n n n T n n n n T n T n T n n n n (sin cos ) sin cos ( ) sin cos sin cos ( sin ) (8) i N x i x i z i z i i N x i z i z i x i i N y i i N y i i N z i z i y i y i 1 1 2 1,( ) 2,( ) 2 1,( ) 2,( ) 2 1 1, ( ) 2,( ) 1,( ) 2,( ) 3 1 1, ( ) 4 1 2, ( ) 5 1 1,( ) 2,( ) 2 1,( ) 2,( ) k k k k kwhere Nk is the number of events in the kth cosθΛ bin. Supplementary Figs. 3
and 4 show the moments and the Λ angular distribution for data compared to
those calculated using the probability density function P( ; ,ξ αψΔΦ α α, , )− 2 with
the parameters set to the values from the global fit. The unsymmetric distributions of T3 and T4 indicate that significant transverse polarization of Λ and Λ hyperons
is observed. The simultaneous fit results for αψ, α−, α+, ΔΦ and α0 parameters are
given in Supplementary Table 1. Based on these parameters, the observables α α0∕+
and ACP= (α− + α+)/(α−− α+) are calculated, and their statistical uncertainties are
evaluated taking into account the correlation coefficients ρ(α+, α0) = 0.42 and
ρ(α+, α−) = 0.82, respectively. As a cross-check, separate fits to data sets I and II are
performed, and the results are consistent with the simultaneous fit within statistical uncertainties, as shown in Supplementary Table 1.
Systematic uncertainty. The systematic uncertainties can be divided into two categories. The first category is from the event selection, including the uncertainties on MDC tracking efficiency, the kinematic fit, π0 and n efficiencies,
Λ and Λ reconstruction, background estimation and the Λ, Λ and MΛπRecoiling
0 mass
window requirements. The second category includes uncertainties associated with the fit procedure based on equations (1) and (3).
(1) The uncertainty due to the efficiency of charged particle tracking has been investigated with control samples of J∕ →ψ ΛΛ→p p (ref. π π− + 42), taking
into consideration the correlation between the magnitude of charged particle momentum and its polar angle acceptances. Corrections are made based on the two-dimensional distribution of track momentum versus polar angle. The difference between the fit results with and without the tracking correction is taken as a systematic uncertainty.
(2) The uncertainty due to the π0 reconstruction is estimated from the difference
between data and MC simulation using a J/ψ → π+π−π0 control sample. The
uncertainty due to the n shower requirement is estimated with a J∕ →ψ p n π−
control sample, and the correction factors between data and MC simulations are determined. The differences in the fit results with and without correc-tions to the efficiencies of the π0 and n reconstructions are taken as systematic
uncertainties.
(3) The systematic uncertainties for the determination of the physics parameters in the fits due to the Λ and Λ vertex reconstructions are found to be negligible.
(4) The systematic uncertainties due to kinematic fits are determined by making corrections to the track parameters distributions in the MC simulations to better match the data. The corrections are done with the five-dimensional distributions over the θΛ, ̂n1, ̂n2 variables, where ̂n1 and ̂n2 are expressed
using spherical coordinates. The fit to data with the corrected MC sam-ple yields αψ= 0.462 ± 0.006, α−= 0.749 ± 0.009, α+ = −0.752 ± 0.009 and
α = − .0 0 688 0 017± . . The differences between the fit with corrections and the nominal fit are considered as the systematic uncertainties. For αψ, the
differ-ence between the fit results with and without this correction is negligible. (5) A possible bias and uncertainty due to the fit procedure is estimated using
MC simulation, where the parameters in the joint angular distribution equa-tion (1) are set to the central values of Table 1 and the number of generated events is the same as for the data. This procedure tests also if the number of MC events used for normalization of the probability density function in equa-tion (6) is sufficient.
(6) The systematic uncertainty caused by the background estimation is studied by fitting the data with and without considering background subtraction.
The differences in the parameters are taken as the systematic uncertainties. The contamination rate of background events in this analysis is less than 0.1% according to the full MC simulations, and the uncertainty due to the background estimation is negligible.
The total systematic uncertainty for the parameters is obtained by summing the individual systematic uncertainties in quadrature (summarized in Supplementary Table 2).
Data availability
The data that support the plots within this paper and other findings of this study are available from the corresponding author upon reasonable request.
references
33. Jadach, S., Ward, B. F. L. & Was, Z. The precision Monte Carlo event generator KK for two fermion final states in e+e− collisions. Comput. Phys.
Commun. 130, 260–325 (2000).
34. Lange, D. J. The EvtGen particle decay simulation package. Nucl. Instrum.
Methods A462, 152–155 (2001).
35. Ping, R.-G. Event generators at BESIII. Chin. Phys. C 32, 599 (2008). 36. Chen, J. C., Huang, G. S., Qi, X. R., Zhang, D. H. & Zhu, Y. S. Event
generator for J/ψ and ψ(2S) decay. Phys. Rev. D 62, 034003 (2000).
37. Yang, R.-L., Ping, R.-G. & Chen, H. Tuning and validation of the Lundcharm model with J/ψ decays. Chin. Phys. Lett. 31, 061301 (2014).
38. Zhong, B., Ping, R.-G. & Xiao, Z.-J. Study of Λ decay parameter in Λ decay. Chin. Phys. C 32, 692 (2008).
39. Ablikim, M. et al. Study of J/ψ decays to ΛΛ and ΛΛ. Phys. Lett. B 632,
181–186 (2006).
40. Ablikim, M. et al. First observation of the isospin violating decay
ψ ΛΣ
∕ → + . .
J 0 c c Phys. Rev. D 86, 032008 (2012).
41. James, F. & Roos, M. Minuit: a system for function minimization and analysis of the parameter errors and correlations. Comput. Phys. Commun. 10, 343–367 (1975).
42. Ablikim, M. et al. Amplitude analysis of the D+→Kπ π+
S0 0 Dalitz plot. Phys.
Rev. D 89, 052001 (2014).