• Sonuç bulunamadı

Analitik Geometriye Yönelik Tutum ve Öz Yeterlik Ölçeği | TOAD

N/A
N/A
Protected

Academic year: 2021

Share "Analitik Geometriye Yönelik Tutum ve Öz Yeterlik Ölçeği | TOAD"

Copied!
8
0
0

Yükleniyor.... (view fulltext now)

Tam metin

(1)

Procedia - Social and Behavioral Sciences 55 ( 2012 ) 20 – 27

1877-0428 © 2012 Published by Elsevier Ltd. Selection and/or peer-review under responsibility of The Association of Science, Education and Technology doi: 10.1016/j.sbspro.2012.09.472

INTERNATIONAL CONFERENCE ON NEW HORIZONS IN EDUCATION

INTE2012

Development of self efficacy and attitude toward analytic

geometry scale (SAAG-S)

Münevver İLGÜN

a*

, Ayşe Zeynep AZAK

b

, Mithat TAKUNYACI

c

aDepartment of Elementary Mathematics Education,Faculty of Education,Sakarya University, Sakarya/TÜRKİYE bDepartment of Elementary Mathematics Education,Faculty of Education,Sakarya University, Sakarya/TÜRKİYE cDepartment of Elementary Mathematics Education,Faculty of Education,Sakarya University, Sakarya/TÜRKİYE

Abstract

The aim of this research is to develop the Analytic Geometry Perception and Attitudes Scale and to examine its validity and reliability analyses. The sample of study consists of 236 university students from Sakarya University. In this study construct and concurrent validities, internal consistency, test-retest reliabilities and item analysis of the scale were examined. As a result of factor analysis for construct validity three factors have emerged which named “attitude toward analytic geometry”, “self efficacy of analytic geometry” and “requirement for achievement”, consist of 26 items and account for the 44.4 % of the total variance. The internal consistency reliability coefficients were .79 for attitude toward analytic geometry, .81 for self efficacy of analytic geometry and .77 for requirement for achievement. Findings also demonstrated that item-total correlations ranged from .35 to .75. Test-retest reliability coefficient was found .85 for scale. According to these findings the Analytic Geometry Perception and Attitudes Scale can be named as a valid and reliable instrument that could be used in the field of education.

Keywords: Analytic geometry, algı, analytic thinking 1. Introduction

There have been few studies which address Analytic Geometry lesson in different perspectives. For example, Erus (2007) investigated whether the instruction based on critical thinking is effective on student achievement in Analytic Geometry lesson. The researcher used a scale consisting of 35 items about the chapter called as “Analytic Examining of Lines”. The scale was developed by the searcher. According to the results of this study, it was found that there was a significant difference between the cognitive domain of the experimental and control group in terms of comprehension and application level in analytic

* Corresponding author. Tel.: +90 506 879 25 66; fax: +90 264 614 10 34.

E-mail address: milgun@sakarya.edu.tr

© 2012 Published by Elsevier Ltd. Selection and/or peer-review under responsibility of The Association of Science, Education and Technology

© 2012 Published by Elsevier Ltd. Selection and/or peer-review under responsibility of The Association of Science, Education and Technology Open access under CC BY-NC-ND license.

(2)

geometry lesson. However, it is not related to all concepts of Analytic geometry. It does not give general picture of students’ attitudes toward Analytic geometry or self efficacy of them.

Yemen (2009) investigated the effects of technology based instruction on the achievement of the 8th grade students and on the attitude of 8th grade students toward Analytic Geometry lesson. The researcher used “Analytic Geometry Achievement Test” and “Attitudes Toward Analytic Geometry Scale”. The former one was developed by the researcher. It was related to the concept of inequality. The latter one was developed by Baykul (2000). These instruments do not sufficient to give an opinion about students’ self efficacy, attitudes or perceptions. Therefore, an alternative instrument measuring these variables with improved validity is necessary.

Ozerdem (2007) conducted a study to determine the misconceptions regarding analytic geometry. The researcher developed the scale at the light of the aims of the Analytic Geometry I and Analytic Geometry II. There are 14 positive items and 16 negative items in this scale.. After developing the scale, the researcher gave this scale in the beginning of the term and at the end of the term to investigate whether there is a significant difference between the attitudes of pre-service secondary mathematics teachers. The researcher conducted t test analysis and found the p-value as p= .00. That is, according to the results of this study, there is a significant difference between the pre-service secondary mathematics teachers’ attitudes obtained in the beginning of the instruction and at the end of the instruction. The comprehensive scale about perceptions, self efficacy and attitudes toward analytic geometry is needed since this scale includes only the objectives of the Analytic Geometry I.

In conclusion, achievement of the individuals may depend on the perceptions, self efficacy and attitudes toward the lessons they took. Analytic geometry is one of these lessons. Also, the individuals’ knowledge obtained in the previous course may affect their attitudes (Ozerdem, 2007). Thus, the purpose of this study is to develop a scale about analytic geometry which reflects university students’ perceptions, self-efficacy and attitudes toward analytic geometry.

2. Method

Descriptive survey method was conducted. Büyüköztürk (2007) stated that the researches which use this method are conducted to get idea of the people about specific topic, attitude of the individuals. Also, it was conducted to represent the events, institutes or objects. In addition, it is used when it is required to reach most people in a short time. The purpose of this study is to develop the scale which can be used to measure perception, self efficacy and attitudes of the university students who take Analytic Geometry.

2.1. Population and Sample

236 university students who are enrolling elementary mathematics education department and mathematics department were chosen as sample of this study. Random sampling method was used. Qualitative data were given in Table 1.

Table 1. Distribution of the Sample

Gender Level

Female Male 2 3 4

Education Faculty (Ele. Math.Educ.) 36 80 3 65 48 Art-Science Faculty (Math.Depart.) 28 92 56 52 12 Total 64 172 59 117 60

(3)

2.2. Process

Data was collected from the university students. Demographic information were collected by the researchers by means of information form in spring term of the 2011-2012 academic year.

Before preparation phase of this scale, comprehensive literature research was done. After this, it was tried to establish theoretical structure of this scale. The written forms which were given the university students enrolling in elementary mathematics education and mathematics department were analyzed to get the ideas of them about Analytic Geometry. Then, the opinions of the students about perception and attitudes toward this lesson were converted to the items which can be suitable to this scale. In order to make this scale be comprehensive, it was noticed that there are sufficient items. Thus, 46 items were included in the first form of this scale.

These 46 items were controlled in terms of understandability, suitability by 3 Mathematics educators, 1 Turkish educator who are experts. Five-likert scale was used (“1” strongly disagree, “2” disagree, “3” neutral, “4” agree and “5” as strongly agree). Reliability and validity analysis were conducted.

Exploratory factor analysis and confirmatory factor analysis were conducted to determine structure validity of the scale. Exploratory factor analysis (EFA) is conducted to determine whether the scale is divided into different factors. The items which are loaded in the same factor are given the name. Also, factor analysis is conducted to determine whether the scale has one factor loading (Balcı, 1995). If the factor loading has the high value, the variable can belong to this factor. It can be sufficient if the percentage of the variance is higher than 30% (Büyüköztürk, 2007). Confirmatory factor analysis (CFA) is conducted to determine to what degree the factors which were formed based on theoretical frame are suitable to the real values.

Several conformity indexes used to determine the efficiency of the model which were tested in CFA (Büyüköztürk, 2007). Chi-Square Goodness, Comparative Fit Index(CFI), Normed Fit Index (NFI), Relative Fit Index (RFI), Incremental Fit Index (IFI), Root Mean Square Residuals (RMR), Root Mean Square Error of Approximation (RMSEA) conformity indexes were used. The criteria GFI, CFI, NFI, RFI and IFI >.90, RMSEA and RMR < .05 were used (Hu & Bentler, 1999). SPSS 13 and LISREL 8.7 programs were used for reliability and validity.

3. Findings and Interpretation

3.1. Structure Validity

In order to understand whether the items in the scale are suitable for factor analysis, Kaiser Mayer Olkin = .80 and Barlett’s Tests of Sphericity (Ki Square= 4033,3 p<.001) were conducted. According to these tests, the items are appropriate for factor analysis.

Principal component analysis was conducted for factor analysis of the scale. Several criteria were noticed to diminish the items which do not measure the same structure. Firstly, the factor loadings should be .45 or higher than this value. Secondly, items should have one factor with high factor loading. Thirdly, if they have two factors with high factor loading, the difference should be at least .10. Lastly, the value of the variance which are determined by these items should be high (Büyüköztürk, 2007).

The number of maximum factor was analyzed for 46 items. It was determined that the items were loaded in 13 factor. However, the results of the principal component method analysis and oblique rotated factor analysis were restricted to obtain 3-factor structure. The reason for using such rotation, there is a relationship among these three factors (Tabachnick & Fidell, 1996). At the end of these processes, 20 items which have under the value of .45 as a factor loading were deleted. Also, 3-factor structure which

(4)

explains 44,4% of the total variance was originated .According to the results of these analysis, the factor loadings of these 26 items were given in Table 2.

Table 2. The Factor Loading of Self Efficacy and Attitude Toward Analytic Geometry Scale (Rotated Principal Component Analysis)

Item Number Common

Factor Variance Factor Loadings 1 2 3 Item 12 .552 .691 Item 13 .561 .685 Item 19 .475 .674 Item 17 .542 .658 Item 20 .436 .638 Item 16 .498 .629 Item 22 .384 .597 Item 15 .501 .580 Item 4 .326 .575 Item 21 .356 .534 Item 46 .342 .532 Item 7 .296 .485 Item 11 .264 .474 Item 14 .255 .468 Item 36 .526 .694 Item 37 .443 .616 Item 45 .427 .604 Item 34 .419 .595 Item 28 .462 .528 Item 26 .285 .469 Item 43 .652 .736 Item 42 .611 .720 Item 41 .637 .696 Item 44 .564 .695 Item 32 .228 .532 Item 40 .455 .530

Level of explanation of Eigen Value Variance

% 24.71 % 8.58 % 11.13

Self Efficacy and Attitude Toward Analytic Geometry Scale has three factors. The first factor "attitude toward analytic geometry”, the second factor “self efficacy of analytic geometry” and the third factor

(5)

“requirement for achievement” explain 24.71%, 8.58%, and 11.13% of the total variance, respectively. According to the results of the principal component analysis, the three factors which have value 1 as an eigenvalue explain 44.4% of the total variance (Table 1).According to test development studies in behavioral science, it is accepted that the ratio of variance is higher than 30% (Büyüköztürk, 2007).

It was found that the correlation value is changing from -.34 to .21 among the subdimensions of Analytic Geometry Scale. (Table 3).

Table 3. Mean and Standard Deviations of Sub-factors of Self Efficacy and Attitude Toward Analytic Geometry Scale and Correlation among Factors

Factor Number X Ss Correlation F1 F2 F3 F1 39.67 9.546 - -.344** -.234** F2 18.58 4.290 -.344** - .453** F3 24.08 3.816 -.234** .453** - Total 82.13 9.021 .708** .304** .278** ** p< .01

It was found that Ki-square value is (x2=567.00, sd=290, p=0.00).Also, the value of fit indexes are RMSEA=.064, NFI=.91, CFI=.93 IFI=.96, RFI=.94, GFI=.87, AGFI=.93 and SRMR=.068.These values showed that the model is consistent. Factor loadings about model were given Figure 1.

(6)

3.2.Investigating for Reliability of the Scale 3.2.1.Item Analysis

It was noticed to 27%-lower and upper group comparison and item total correlation value for discrimination of items of Scale of Self Efficacy and Attitude toward Analytic Geometry. Item-total correlation value explains the relation between the scores obtained in items and the total scores (Büyüköztürk, 2007).In other words, it shows that the items in the scale represent the similar things. Thus, positive and high item-total correlation value is expected (Fraenkel & Wallen, 2000).

Revised item-total correlation value was ranged from .35 to .75. Also, t value ( sd=128) about the difference between the values of 27%-lower and upper group is ranged from -46.361 (p<.001) to -13.715 (p<.001).The findings were given Table 4.

Table 4. Corrected Item-Total Correlation Value of Scale Self Efficacy and Attitude Toward Analytic Geometry Scale and Unrelated T-Test Results between Lower 27% Group and Upper 27% Group Values.

FACTOR NAME Item Number Corrected Item Total Correlation t

(upper%27-lower%27)

1. Factor attitude toward analytic

geometry Item4 .541 -32.203 Item7 .626 -28.212 Item11 .724 -13.715 Item12 .442 -25.034 Item13 .419 -34.849 Item14 .350 -45.074 Item15 .429 -26.789 Item16 .425 -18.601 Item17 .467 -35.322 Item19 .428 -15.934 Item20 .584 -21.623 Item21 .513 -29.231 Item22 .625 -33.573 Item46 .472 -24.829 2. Factor self efficacy of analytic

geometry Item26 .532 -46.361 Item28 .487 -37.111 Item34 .625 -31.523 Item36 .492 -36.759 Item37 .620 -28.314 Item45 .516 -20.281 3. Factor requirement for achievement

Item32 .644 -41.961 Item40 .750 -33.731 Item41 .539 -27.953 Item42 .475 -19.751 Item43 .451 -22.453 Item44 .678 -27.163

(7)

3.2.2.Findings about Reliability

The Cronbach alpha value is .80. It was found that internal consistency value for factor “attitude toward analytic geometry” is .79, for factor “self efficacy of analytic geometry” .81 and for factor “requirement for achievement” .77 (Table 5).

Table 5. Cronbach Alpha Coefficients of Self Efficacy and Attitude Toward Analytic Geometry Scale

Factors r

Factor 1 .79

Factor 2 .81

Factor 3 .77

Total .80

According to the results of split half analysis, the Spearman Brown coefficient is .78 (Table 6).

Table 6.Split Half Reliability Analysis Results of Self Efficacy and Attitude Toward Analytic Geometry Scale

Split Half Correlation .74

Equal Split Half Spearman Brown

Reliability Coefficient .86

First Half Cronbach Alfa .86

Second Half Cronbach Alfa .71

Guttman Split-Half Reliability Coefficient .79

After the first administration of the scale, it was administered to 75 university students to determine test-retest reliability coefficient value. Then, it was found that the correlation value between these two administrations is .85.

3.3. Answering and Scoring of Self Efficacy and Attitude Toward Analytic Geometry Scale

In the Analytic Geometry Scale which was developed to measure perception and attitude of the students to Analytic Geometry, 5-likert scale was used. That is, "1" is referred as "strongly disagree", "2" is referred as "disagree", "3" is referred as "neutral", "4" is referred as "agree" and "5" is referred as "strongly agree". There are 26 items in this scale. The lowest score can be 26 point; on the other hand, 130 point can be as a highest score. The lowest score can be 14 and the highest score can be 70 for the subfactor “attitude toward analytic geometry”, the lowest score 6 and the highest score 30 can be for the factors “self efficacy of analytic geometry.” and “requirement of achievement.”

While evaluating the scale scores of the students, the scores obtained from sub-factors are divided by the possible score and then this ratio is converted to the percentage. After that, these percentages are ranged from the highest to lowest to determine which area is more dominant.

4. Discussion

The purpose of this study is to develop the scale which can be used to measure perception, self efficacy and attitudes of the university students who take Analytic Geometry by establishing reliability and validity of the this scale . The sample of this study is sufficient enough. According to the result of this study, it was proved that Self Efficacy and Attitude Toward Analytic Geometry Scale had sufficient reliability and

(8)

validity value. Conformity and exploratory factor analysis were conducted to determine factor structure of the scale. It was found that this scale has three factor loadings. “attitude toward analytic geometry.”,“ self efficacy of analytic geometry.”, and “requirement of achievement” were given as name of these factors. These items have high factor loading in their factor but low factor value in the other factors. That shows the independence of these factors which is very important.

It was seen that item-total correlation value is ranged from .35 to .75. T-test results which were conducted among 27%-lower and upper group showed that there is significant difference among all items and subscale.

It was found that internal consistency value for factor “attitude toward analytic geometry” is .79, for factor “self efficacy of analytic geometry” .81 and for factor “requirement of achievement” .77.This proves that internal consistency value of the scale is high. Depending on the results of test-retest reliability analysis, the correlation value is .85 between two administrations. That is, the scale measures the same structure.

All findings showed that this scale is valid to determine the self efficacy and attitudes of the students toward Analytic Geometry. If this scale is used for other studies, it will contribute the power of its assessment. However, there is a limitation. To be more precise, this study is restricted to Sakarya University. Thus, it will be necessary to establish reliability and validity for other students in different school, university, etc.

References

Balcı, A. (1995). Sosyal bilimlerde arastırma: Yöntem, teknik ve ilkeler. Ankara: 72 TDFO Bilgisayar Yayıncılık.

Baykul,Y. (2000). İlköğretimde Matematik Öğretimi, 6-8.sınıflar için.Ankara: Pegem Yayıncılık, 292. Büyüköztürk, Ş. (2007). Sosyal bilimler için veri analizi el kitabı (8. Baskı). Ankara: Pegem Yayıncılık. Erüs, E. E. (2007). Effects of instruction depending on critical thinking skills on student achievement level

and retention in analytic geometry lessons. (Master's thesis).

Fraenkel, J. R., & Wallen, N. E. (2000). How to design and evaluate research in education. New York: McGraw-Hill.

Hu, L. T., & Bentler, P. M. (1999). Cutoff criteria for fit indexes in covariance structural analysis:

Conventional criteria versus new alternatives. Structural Equation Modeling, 6, 1-55.

Özerdem, E. (2007). The misconceptions on the subject of analytical geometry and to find out a solution

in licence degree . (Master's thesis).

Tabachnick, B. G., & Fidell, L. S. (2007). Using multivariate statistics. Boston: Allyn and Bacon.

Yemen, S. (2009). The effect of technology assisted instruction on 8th grade students’ achievement and

Şekil

Table 1. Distribution of the Sample
Table 2. The Factor Loading of Self Efficacy and Attitude Toward Analytic Geometry Scale (Rotated Principal Component                   Analysis)
Table 3. Mean and Standard Deviations of Sub-factors of Self Efficacy and Attitude Toward Analytic Geometry Scale and  Correlation among Factors
Table 4. Corrected Item-Total Correlation Value of Scale Self Efficacy and Attitude Toward Analytic Geometry Scale and  Unrelated T-Test Results between Lower 27% Group and Upper 27% Group Values
+2

Referanslar

Benzer Belgeler

The turning range of the indicator to be selected must include the vertical region of the titration curve, not the horizontal region.. Thus, the color change

Yukarda belirtilen hiperkeratotik foliküler papüller ve komedon benzeri lezyonlar gibi diğer foliküler anormalliklerin de Dowling-Degos hastalığına eşlik edebilmesi

The purpose of this research is to determine the perception of the academic self efficacy of Turkish Education graduate students.. This study applied

Normal veya yüksek tuzlu diyet alan gruplarda “in vivo” L-NNA uygulamasının deneklerin günlük ortalama su alımları üzerine etkileri.... Diyette yüksek tuz uygulamasının

Aşağıdaki cümleleri örnekteki gibi zıt anlamlı kelimelerle tamamlayalım.. Aşağıdaki

96 yaşındaki sanatçının ilgi­ lendiği konularda yüzlerce eseri

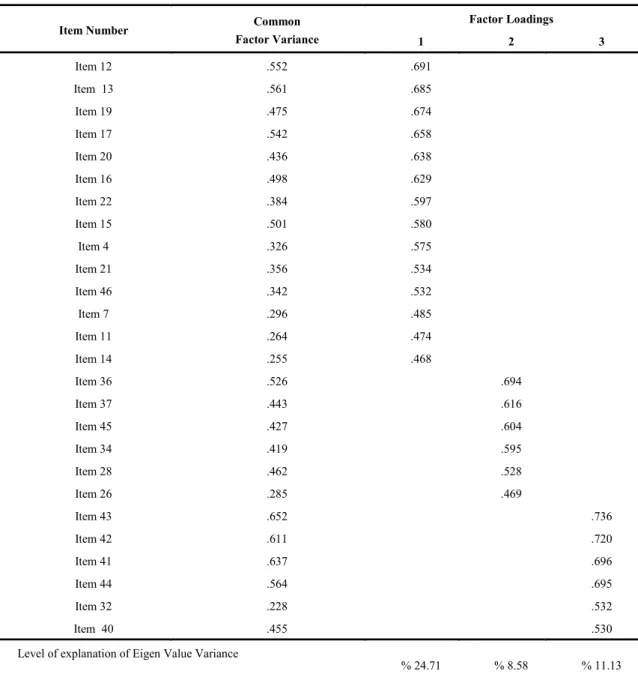
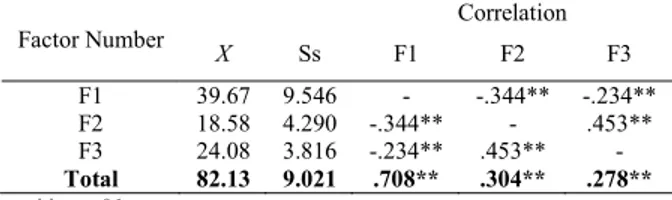
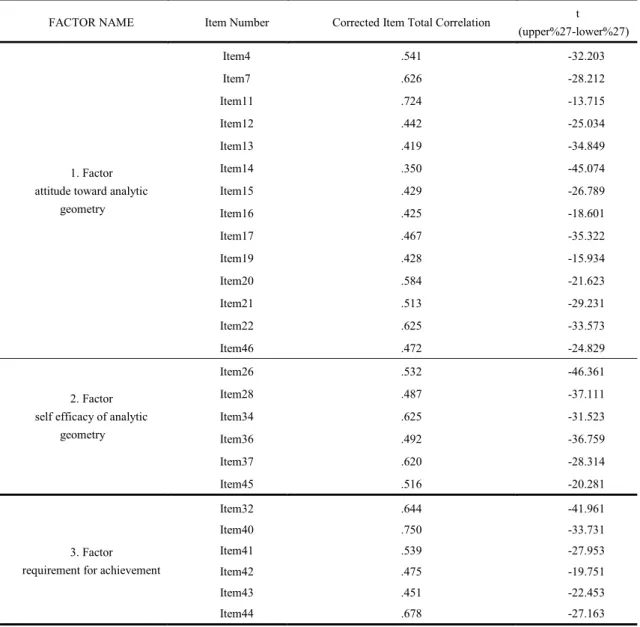
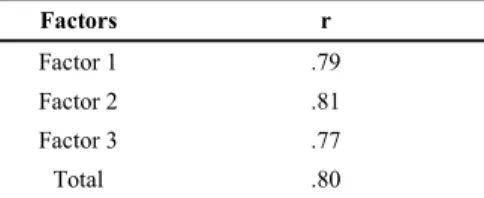
The Content Validity Index was used to test the content validity, the Exploratory and Confirmatory Factor Analysis was used for determining the construct validity, and Cronbach’s

Çalışmada, İŞGEM’lerde oluşan istihdamın 2.522 kişi olarak tespit edilmesi, dolayısıyla bu istihdam rakamının 270 işletme tarafından oluşturulduğu göz