REVIVAL IN THE 4
THQUARTER
Zümrüt İmamoğlu* ve Barış Soybilgen
†Executive Summary
In October, the industrial production index (IPI) decreased by 2.6 percent from September. Export volume index increased by 3.5 percent, whereas import volume index decreased by 1.4 percent. According to first indicators, there might be a limited increase in private investment expenditure, and the revival in consumption that began in the third quarter may continue into the fourth quarter. Even though IPI declined in October, positive expectations about November seem to be reflected in the real sector confidence index. Overall, economic indicators imply a revival in the fourth quarter compared to the third quarter. Betam’s quarter on quarter (QoQ) growth forecast for the fourth quarter of 2012 is 1.2 percent. The corresponding year on year (YoY) growth rate is 3.0 percent and the annual GDP growth rate estimate for 2012 is 2.7 percent.
The current account deficit (CAD) continued to decline in October and the 12-month current account deficit ended up at $41 billion. Even though the base effect diminishes in November and December, we expect that the decline in CAD
* Dr. Zümrüt İmamoğlu, Betam, Research Associate. zumrut.imamoglu@bahcesehir.edu.tr
† Barış Soybilgen, Betam, Research Assistant,
baris.soybilgen@bahcesehir.edu.tr
Table 1.Betam’s quarterly and annual growth rate forecasts
Source: Betam
*sa: seasonally and calendar day adjusted **ca: calendar day adjusted
will continue but at a slower pace. We think that the end of year CAD to be around $50 billion. Our forecast for the CAD to GDP ratio, which was 7.2
percent at the end of the 3rd quarter, is 6.3 percent
for the end of the year.
Growth is stronger in the 4th quarter
Even though Betam expected that the growth in the
3rd quarter would slow down compared to the
previous quarter growth, the 3rd quarter growth rate
was much lower than our expectations. According to first indicators for the fourth quarter, growth will
2012 4th Quarter
Forecast Real GDP growth, %
(quarter on quarter, sa*) 1.2
Real GDP growth, %
(year on year, ca**) 3.0
Current account deficit
(% of GDP, annual) 6.3
2012 Annual Growth
Real GDP growth, % 2.7
Economic Outlook and Forecasts:
December 2012
be higher this quarter. However, it is doubtful that the revival will push up the annual growth rate above 3 percent. November and December data is highly important to shed new light on this topic but, the 3.2 percent annual growth rate projected by Medium Term Program is simply out of reach in 2012.
The slump in the IPI in October is mainly caused by calendar day effects. IPI has been volatile since May, swinging up and down every month. Therefore, we expect the IPI to increase again in November. Two indicators that imply a strong revival in the fourth quarter are imports of consumer goods and investment goods. The ongoing increase in the real sector confidence index and the strong rally in the Istanbul Stock Exchange are also positive signs for both the last quarter of 2012 and the first quarter of 2013. Finally, the recovery in the automobile production is a positive sign for consumption.
On the other hand, Capacity Utilization Rate is nearly constant since June. Consumer confidence index continues to decline and the limited increase in exports (compared to imports) excluding gold curb the contribution of net exports.
Economic indicators show that the growth will be
higher in the 4th quarter than the 3rd quarter.
Betam’s first quarter on quarter (QoQ) growth forecast for the fourth quarter of 2012 is 1.2 percent. The corresponding year on year (YoY) growth rate is 3.0 percent and the estimated annual GDP growth rate for 2012 is 2.7 percent.
The future of the economic growth
One of the most interesting aspects of the national accounts data is the high contribution of the government expenditures. YoY and QoQ contributions of the government expenditure to the GDP were 0.8 and 0.7 percentage points, respectively which are higher than what we have seen over the last two years. In spite of fiscal constraints, the government is trying to help GDP growth. We believe that this policy will continue in the fourth quarter. In fact, budget figures show an increase in expenditures.
Meanwhile, Central Bank of Turkey (CBRT) continues to loosen monetary policy. Policy rate was cut by 0.25 points in December. Unlike fiscal policy, the monetary policy impacts the real economy with a time lag. Even though the low
growth rate in the 3rd quarter increases the pressure
on CBRT to further loosen the monetary policy, CBRT will probably wait and see the effects of its policy mix for a while and restrain from loosening too much.
Private consumption uncertain
Consumer confidence index continued to decline as in the last three months. It decreased by 2.1 percent in October from the previous month. Special consumer tax (SCT) hikes became effective at the end of September, so SCT income increased 31.9 percent in October. Non-durable goods production increased by 2.4 percent, whereas durable goods production decreased by 4.4 percent. Consumer goods imports also increased in October. With
such a mix of signals, it’s hard to make a conclusion about the direction in private consumption expenditures. November figures will be important.
Investment starts to take off
Real sector confidence index continued to increase in the last three months. It increased by 0.7 percent in November from the previous month. Investment goods imports have been increasing for the last four months. Moreover, automobile production and investment goods production increased by 3.6 percent and 2.6 percent in October, respectively. Intermediate goods imports also seem to have increased in October. Overall, we expect the private investment expenditures to contribute positively to the GDP growth in the fourth quarter.
Net exports continue to decline
Figure 2 shows monthly changes of seasonally adjusted import and export volume indices. In October, export volume index increased by 3.5 percent whereas import volume index decreased by 1.4 percent. When we adjust the trade data for gold trade (i.e., excluding gold imports and exports), we see that the real exports decreased by 0.6 percent and the real imports increased by 0.4 percent, respectively. Overall, the contribution of net exports to the GDP growth will continue to decline in the fourth quarter.
Current account deficit falls below 7 percent
The 12-month CAD was $55 billion in September. October CAD reduced to $2 billion and the 12-month CAD fell to $53 billion at the end of October. We expect that the 12-month CAD will be around $50 billion at the end of 2012 as base effect from the previous year disappears in November and December, and the economy continues to slow down. Therefore, we expect the 12-month current account deficit to the GDP ratio, which was 7.2 at the end of the third quarter, to fall down to 6.3 percent at the end of the fourth quarter.
Table 2. Monthly and quarterly changes of Betam’s selected indicators (real and sa)
Indicators August September October November
2012 2nd Quarter 2012 3rd Quarter Exports
8.7
-9.7
3.5
**
3.8
-0.7
Imports-2.0
0.9
-1.4
**
-0.4
-1.4
Intermediate goods import
-3.6
-2.6
3.7
** -0.1 0.7
Consumer goods import
-7.3
0.9
7.7
** -0.3 5.6
Investment goods import
0.7
2.2
8.7
** -7.4 10.5
Exports without gold***
4.4
-0.5
2.8
** -0.6 3.9
Imports without gold***
1.2
1.2
1.8
** 0.4 3.0
Industrial Production Index (IPI)
-3.1
4.8
-2.6
** 0.2 -0.5
Nondurable consumer goods
-2.5
2.3
2.4
** 1.5 3.1
Durable consumer goods
-1.3
9.9
-4.4
** 2.8 1.2
Intermediate goods
-1.6
1.9
-0.2
** 0.3 0.5
Investment goods
-7.4
6.2
2.6
** -2.7 4.0
Capacity Utilization Rate (CUR)
-0.2
-0.1
0.3
-0.4 -1.8 0.0
Nondurable consumer goods
-0.6
0.1
0.1
0.0 -0.5 0.1
Durable consumer goods
-0.6
0.6
-0.8
-1.4 -1.8 -1.8
Intermediate goods
-0.6
-0.4
0.4
-0.5 -1.0 -0.4
Investment goods
0.6
-1.2
0.3
-0.3 -2.4 -0.7
Manufacturing Orders Index
0.5
-0.5
**
** -4.5 **
Domestic Orders
-2.0
-0.7
**
** -3.7 **
Foreign Orderrs
5.0
-1.3
**
** -5.6 **
Soft Data
Consumer confidence index
(Turkstat)
-1.4
-2.5
-2.1
** -0.7 -4.2
Reel sector confidence index
-1.0
0.8
4.6
0.7 -3.2 5.2
Financial Data
IMKB 100 (Stock Exchange)
3.6
1.4
0.5
5.5 9.1 5.5
Other
Special consumer tax* (SCT)
2.0
-0.8
31.9
** 1.5
32.1
Automobile production
7.9
0.1
3.6
** -3.1 6.3
Source: TurkStat. TCMB. Treasury. IMKB. Betam. All series are real (or inflation adjusted) wherever necessary and seasonally adjusted.
*This tax is collected on sales of goods such as gas, fuel oils, alcohol, tobacco products and automobiles. **Data not yet released.
Figure 1: Capacity utilization rate and industrial production index (sa. left axis for CUR and right axis for IPI)
Source: TurkStat. Betam.
Figure 2: Volume indices of exports and imports (sa)
Source: TurkStat. Betam.
Figure 3: Ratio of current account deficit to GDP (yearly)
Source: TCMB. TurkStat. Betam.
Figure 4: Weighted Average Interest Rates For Turkish Lira Banks' Loans (%)
Source: TCMB. 95 100 105 110 115 120 125 130 135 60 65 70 75 80 85 Ja n -0 7 Ma y-0 7 Se p -0 7 Ja n -0 8 Ma y-0 8 Se p -0 8 Ja n -0 9 Ma y-0 9 Se p -0 9 Ja n -1 0 Ma y-1 0 Se p -1 0 Ja n -1 1 Ma y-11 Se p -1 1 Ja n -1 2 Ma y-12 CUR IPI 120 140 160 180 200 220 240 Ja n -07 M ay-07 Se p -0 7 Ja n -08 M ay-08 Se p -0 8 Ja n -09 M ay-09 Se p -0 9 Ja n -10 M ay-10 Se p -1 0 Ja n -11 M ay-11 Se p -1 1 Ja n -12 M ay-12 Se p -1 2 Export Import 0 2 4 6 8 10 12 20 08( 1) 20 08( 2) 20 08( 3) 20 08( 4) 20 09( 1) 20 09( 2) 20 09( 3) 20 09( 4) 20 10( 1) 20 10( 2) 20 10( 3) 20 10( 4) 20 11( 1) 20 11( 2) 20 11( 3) 20 11( 4) 20 12( 1) 20 12( 2) 20 12( 3) 20 12 (4 )* 0 5 10 15 20 25 30 Fe b ‐08 Ma y ‐08 Au g ‐08 No v ‐08 Fe b ‐09 Ma y ‐09 Au g ‐09 No v ‐09 Fe b ‐10 Ma y ‐10 Au g ‐10 No v ‐10 Fe b ‐11 Ma y ‐11 Au g ‐11 No v ‐11 Fe b ‐12 Ma y ‐12 Au g ‐12 No v ‐12 Cash Vehicle Housing Commercial
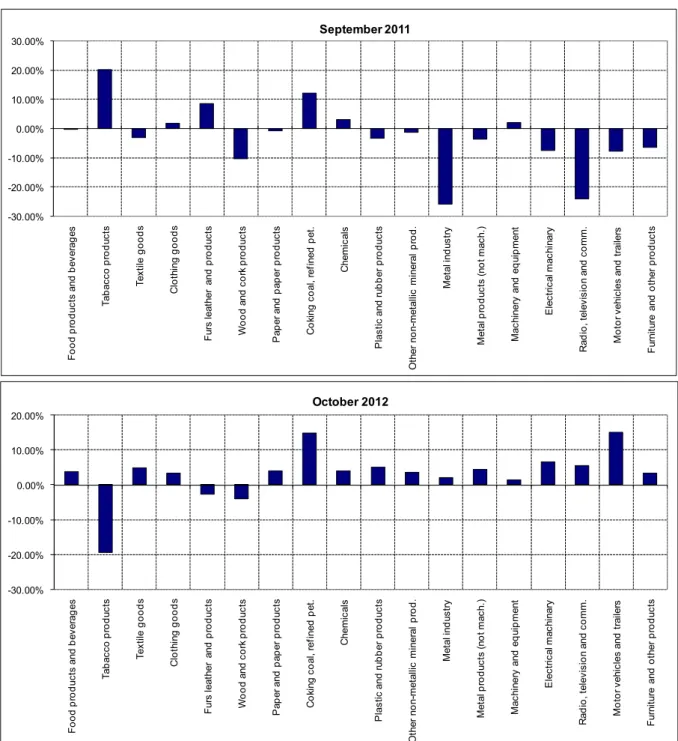
Figure 5: Monthly changes of manufacturing industry exports (sa)
Source: TurkStat. Betam.
-30.00% -20.00% -10.00% 0.00% 10.00% 20.00% F ood pr o d uc ts a nd b ev er ag es Ta ba cc o pr odu ct s Te xt ile g oods C lot hi ng goo ds F ur s l ea th er a nd pr odu ct s W o od a nd c o rk pr o d uc ts P ap er a nd pa pe r pr odu ct s C o ki ng c o al , r ef ined p et . C hem ic al s P las tic and ru b b er p ro d uc ts O ther no n-m et al lic m iner al p ro d . Me ta l in d us tr y M et al pr odu ct s (n ot m ac h. ) M ac hi ner y and eq ui p m en t E lec tr ic al m ac hi nar y R ad io , t el evi si o n a nd co m m . M o to r v ehi cl es an d t ra ile rs F ur ni tu re a nd ot he r pr odu ct s October 2012 -30.00% -20.00% -10.00% 0.00% 10.00% 20.00% 30.00% F o o d pr odu ct s an d be ve ra ge s Ta ba cc o pr od uc ts Te xt ile good s C lot hi ng g oods F ur s l eat her and p ro d uc ts W ood an d c o rk pr odu ct s P ap er a nd p ap er pr od uc ts C o ki ng c o al , r ef ined p et . C hem ic al s P las tic an d ru b b er p ro d uc ts O ther no n-m et al lic m iner al p ro d . Me ta l in d us tr y M et al pr od uc ts (n o t m ac h. ) M ac hi ner y an d eq ui p m ent E lec tr ic al m ac hi nar y R adi o , t el ev is ion a nd c o m m . M o to r v ehi cl es and t rai le rs F ur ni tu re and o ther p ro d uc ts September 2011