Is the Turkish Economy Accelerating Again?
Zümrüt İmamoğlu* and Barış Soybilgen
†Executive Summary
The most profound economic development in October was the 4.4 percent monthly increase in Industrial Production Index (IPI). Year on year (YoY) IPI growth was also high at 7.3 percent and the question whether Turkish economy has started to accelerate again emerged. Although it is too early to answer yes or no to this question and one should first see the economic indicators for November and December, we doubt that this is the case. However, our first quarter on quarter (QoQ) forecast for the fourth quarter is 0.8 percent, a bit above that of our third quarter forecast of 0.6 percent. The corresponding year on year growth estimate is 4.5 percent. Finally, our annual forecast for 2011 is 7.6 percent.
Increases in both the trade deficit and the current account deficit slowed down in the third quarter compared to last quarters. We expect the deceleration trend to continue into the fourth quarter. However, the decrease in tourism income due to seasonal changes might cause small monthly spikes in the current account deficit.
* Dr. Zümrüt İmamoğlu, Betam, Research Associate. [email protected]
† Barış Soybilgen, Betam, Research Assistant,
Betam’s current account deficit to GDP ratio forecast for the end of fourth quarter is 10.6 percent.
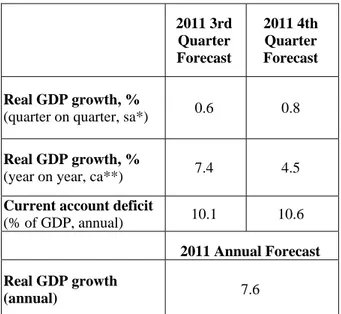
Table 1. Betam’s quarterly and annual growth rate forecasts
Source: Betam *sa: seasonally and calendar day adjusted **ca: calendar day adjusted
Is Turkish economy accelerating?
Since the beginning of 2011 a slowdown in the economy is observed. QoQ growth for the fourth quarter of 2010 was 3.6 percent, it reduced to 1.7 percent in the first quarter of 2011. It further reduced down to 1.3 percent in the second quarter
2011 3rd Quarter Forecast 2011 4th Quarter Forecast Real GDP growth, %
(quarter on quarter, sa*) 0.6 0.8
Real GDP growth, %
(year on year, ca**) 7.4 4.5
Current account deficit
(% of GDP, annual) 10.1 10.6
2011 Annual Forecast Real GDP growth
(annual) 7.6
Economic Outlook and Forecasts:
December 2011
of 2011. And we expect QoQ growth of the third quarter would be 0.6 percent.1
The jump in IPI in October may indicate that GDP growth is again accelerating, indeed, the IPI has reached a historically high level. However, we believe that exports are the main driving force for the increase in industrial production rather than domestic demand. When industrial production is inspected at the sectoral level, it can be seen that export oriented sector production increased the most (land vehicle and other transportation vehicle production, machinery and equipment production, mining, food products and beverages production). The critical question is, will the IPI remain at this level or not? The decrease in intermediate and investment goods production show that this may not be the case. Moreover, it is highly probable that Europe will contract in the fourth quarter so we don’t expect a high increase in exports in the fourth quarter. The decrease in the pace of credit loan growth also suggests a slowdown in domestic demand. Hence, we do not expect the growth rate to pick up by a lot in the last quarter.
Revival in Consumption
Consumption indicators in the fourth quarter show that the increase in consumption expenditure may be higher than the last quarter. In October, consumption good imports decreased by 0.7 percent. However, both durable and nondurable goods production increased by 2.5 and 2.4 percent, respectively. Automobile production also increased by 5.2 percent. Although increases in
1
This paper was written before the announcement of third quarter’s GDP data.
production are partly caused by the surge in exports, we still expect consumption expenditures to increase in the last quarter.
New peak in IPI
As shown in Figure 1, seasonally adjusted IPI reached its highest level In October (131 points) since 2005 (new IPI series begin from 2005). Investment goods production increased by 6.1 percent and is one of the most important driving forces of IPI. Capacity utilization rate has also increased by 0.3 and 0.4 percent in October and November, respectively. Moreover, reel sector confidence index raised by 2.9 percent. While domestic production increased, imports of intermediate goods decreased by 4.8 percent. Imports of investment goods have also decreased by 8.4 percent. Overall, we expect investment expenditures to be higher in the fourth quarter than the previous quarter.
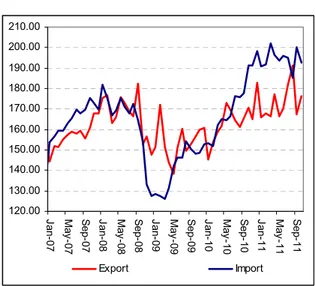
Exports continue to grow
Figure 2 shows monthly changes of seasonally adjusted import and export volume indices. In October, exports increased by 5.5 percent and imports decreased by 3.7 percent. However, in September, exports had declined by 12.4 percent, so it could take a while for exports to return back to the pre-September level. The ongoing fall of imports is a positive development for current account deficit. Moreover, once the increases in Special Consumer Tax rates (SCT) and the deterioration in consumer confidence are accounted for, we can expect imports to continue to decline in the coming months.
Current account deficit is above 10 percent
The current account deficit in October can be 1 to 2 billion dollars lower than in September due to decrease in tourism income. And in the fourth quarter, current account deficit will further fall because of the base effect. Figure 4 shows the growth rate of current account deficit to GDP ratio in percentage points. In the last three quarters, current account deficit has increased by 1.4 percentage points in each quarter and in the third quarter it has increased by 0.9 percentage points. In the fourth quarter we expect the current account deficit will increase by 0.5 percent point which implies a further slow down. The ongoing
decrease in imports can further reduce this forecast. However, we expect the 2011 current account deficit to GDP ratio to realize above 10 percent, our GDP estimate implies that it will be 10.6 percent. Even if the argument that the sustainable current account deficit for Turkey has increased since 2000s, it is clear that this level is not above 10 percent. Therefore, current account deficit still stands as a significant risk for the Turkish economy.
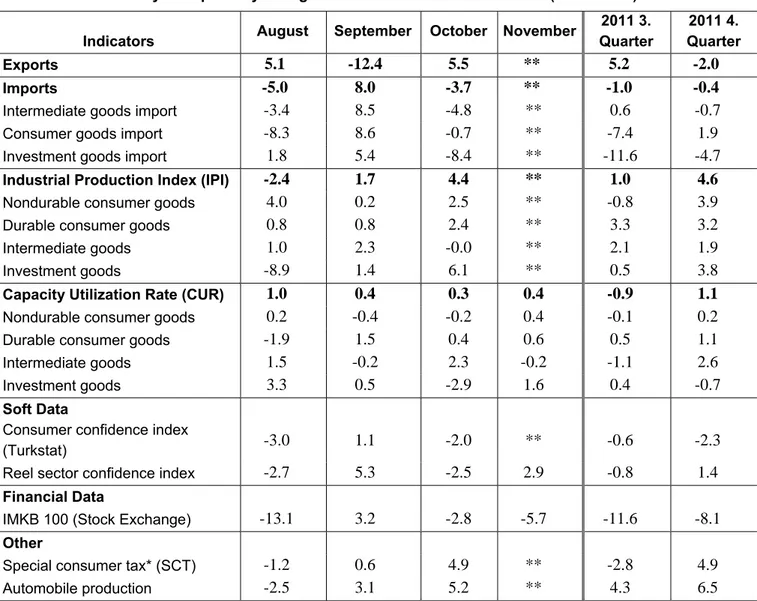
Table 2. Monthly and quarterly changes of Betam’s selected indicators (real and sa)
Indicators August September October November
2011 3. Quarter 2011 4. Quarter Exports 5.1 -12.4 5.5 ** 5.2 -2.0 Imports -5.0 8.0 -3.7 ** -1.0 -0.4
Intermediate goods import -3.4 8.5 -4.8 ** 0.6 -0.7
Consumer goods import -8.3 8.6 -0.7 ** -7.4 1.9
Investment goods import 1.8 5.4 -8.4 ** -11.6 -4.7
Industrial Production Index (IPI) -2.4 1.7 4.4 ** 1.0 4.6
Nondurable consumer goods 4.0 0.2 2.5 ** -0.8 3.9
Durable consumer goods 0.8 0.8 2.4 ** 3.3 3.2
Intermediate goods 1.0 2.3 -0.0 ** 2.1 1.9
Investment goods -8.9 1.4 6.1 ** 0.5 3.8
Capacity Utilization Rate (CUR) 1.0 0.4 0.3 0.4 -0.9 1.1
Nondurable consumer goods 0.2 -0.4 -0.2 0.4 -0.1 0.2
Durable consumer goods -1.9 1.5 0.4 0.6 0.5 1.1
Intermediate goods 1.5 -0.2 2.3 -0.2 -1.1 2.6
Investment goods 3.3 0.5 -2.9 1.6 0.4 -0.7
Soft Data
Consumer confidence index
(Turkstat) -3.0 1.1 -2.0 ** -0.6 -2.3
Reel sector confidence index -2.7 5.3 -2.5 2.9 -0.8 1.4
Financial Data
IMKB 100 (Stock Exchange) -13.1 3.2 -2.8 -5.7 -11.6 -8.1
Other
Special consumer tax* (SCT) -1.2 0.6 4.9 ** -2.8 4.9
Automobile production -2.5 3.1 5.2 ** 4.3 6.5
Source: TurkStat. TCMB. Treasury. IMKB. Betam. All series are real (or inflation adjusted) wherever necessary and seasonally adjusted.
*This tax is collected on sales of goods such as gas. fuel oils. alcohol. tobacco products and automobiles. **Data not yet released
Figure 1: Capacity utilization rate and industrial production index (sa. left axis for CUR and right axis for IPI)
60 65 70 75 80 85 Ja n-07 A pr-0 7 Ju l-0 7 Oct -0 7 Ja n-08 A pr-0 8 Ju l-0 8 Oct -0 8 Ja n-09 A pr-0 9 Ju l-0 9 Oct -0 9 Ja n-10 A pr-1 0 Ju l-1 0 Oct -1 0 Ja n-11 A pr-1 1 Ju l-1 1 Oct -1 1 95 100 105 110 115 120 125 130 135 CUR IPI
Source : TurkStat. Betam
Figure 2: Volume indices of exports and imports (sa) 120.00 130.00 140.00 150.00 160.00 170.00 180.00 190.00 200.00 210.00 Jan-07 May -07 S ep-07 Jan-08 May -08 S ep-08 Jan-09 May -09 S ep-09 Jan-10 May -10 S ep-10 Jan-11 May -11 S ep-11 Export Import
Source : TurkStat. Betam
Figure 3: Ratio of current account deficit to Figure 4: Ratio of current account deficit to
GDP (yearly) GDP’ growth rate (QoQ, percentage point)
Source: TCMB. TurkStat. Betam * Betam’s forecasts -1.5 -1 -0.5 0 0.5 1 1.5 2 2008( 1) 2008( 3) 2009( 1) 2009( 3) 2010( 1) 2010( 3) 2011( 1) 2011( 3) 0 2 4 6 8 10 12 2008 (1 ) 2008 (3 ) 2009 (1 ) 2009 (3 ) 2010 (1 ) 2010 (3 ) 2011 (1 ) 2011 (3 )
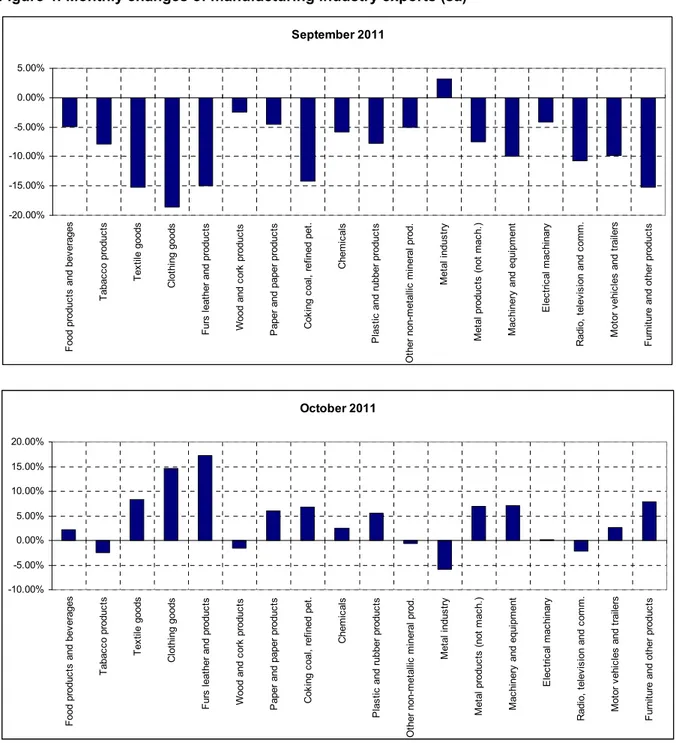
Figure 4: Monthly changes of manufacturing industry exports (sa)
Source: TurkStat. Betam
October 2011 -10.00% -5.00% 0.00% 5.00% 10.00% 15.00% 20.00% F ood pr oduc ts and bev erages T abac co produc ts T ex til e goods C lot hi ng goods F urs leat her and pr oduc ts Wood and co rk produc ts P aper and paper pr oduc ts C ok ing c oal , ref ine d pet . C hem ic al s P las tic and r ubber pro duc ts O ther non-m et allic m in er al p ro d. M et al indus tr y M et al produc ts (not m ac h. ) M ac hi nery and e qui pm ent E lec tr ic al m ac hi nary R adi o, t el ev is ion and c om m . M ot or v ehi cl es and t rai le rs F urni tur e and ot her pr oduc ts September 2011 -20.00% -15.00% -10.00% -5.00% 0.00% 5.00% F ood produc ts and bev erages T abac co produc ts T ex til e goods C lot hi ng goods F urs leat her and produc ts Wood and c or k produc ts P aper and paper produc ts C ok ing c oal , r ef ined pet . C hem ic al s P las tic
and rubber produc
ts O ther non-m et al lic m iner al prod. M et al indus tr y M et al pr oduc ts ( not m ac h. ) M ac hi nery an d equi pm ent E lec tr ic al m ac hi nary R adi o, t el ev is ion and c om m . M ot or v ehi cl es and t rai le rs F ur ni ture and ot her produc ts