https://dergipark.org.tr/tr/pub/bursauludagziraat http://www.uludag.edu.tr/ziraatdergi
Aralık/2020, 34(2), s. 365-383
ARAŞTIRMA MAKALESİ RESEARCH ARTICLE
Geliş Tarihi (Received): 29.04.2020 Kabul Tarihi (Accepted): 01.10.2020
Evaluation of Nineteen Potato Cultivars for Salt Tolerance and
Determination of Reliable Parameters in Tolerance
ACigdem AYDOGAN
1, Ece TURHAN
1*Abstract: This investigation was aimed to explore the varietal differences in salinity tolerance of potato (Solanum tuberosum L.) plants by linking the overall salinity tolerance with changes in different morphological and physiological characteristics. Nineteen currently used potato cultivars were grown under controlled conditions in greenhouse at 25-18 (±2) °C (day/night), 70% relative humidity under non-saline and 5dS m-1 NaCl conditions for 90 days. For this purpose, tubers were planted in 14L pots, containing soil: peat: vermiculite (3:1:1). Salt treatment was started 1 week after all the seedlings where emerged. Salt stress tolerance of potato plants were determined with visual damage scale, cell membrane injury analysis and malondialdehyde (MDA) content, the indicator of lipid peroxidation. Leaf relative water content (RWC), loss of turgidity (LT) and total soluble protein (TSP) content were also examined. In addition, the protein profiles of leaf tissues of plants were evaluated by SDS-PAGE. In conclusion; among 19 potato cultivars evaluated cvs. Bettina, Challenger, Granola, Lady Claire, Musica and Orchestra were the most susceptible, cvs. Desiree and Russet Burbank were the most tolerant to salt stress. The data indicated that the low cell membrane injury and MDA content made cvs. Desiree and Russet Burbank relatively salt-tolerant cultivars. Besides, it is concluded that, visual damage scale and SDS-PAGE protein profiles also could be used as biomarkers in salt stress tolerance of potato cultivars.
Keywords: Ion leakage, lipid peroxidation, protein, salt injury, salt screening, Solanum tuberosum L.
A
This study is part of the Ph.D. thesis project of Cigdem Aydogan which is financially supported by Eskisehir Osmangazi University Research Foundation as project no. 201423A216.
*
Sorumlu yazar/Corresponding Author: 1Ece TURHAN, Department of Agricultural Biotechnology, Faculty of
Agriculture, Eskisehir Osmangazi University, 26160, Eskisehir, Turkey, [email protected], OrcID
0000-0003-0991-3802
1
Cigdem AYDOGAN, Department of Agricultural Biotechnology, Faculty of Agriculture, Eskisehir Osmangazi
University, 26160, Eskisehir, Turkey, [email protected], OrcID 0000-0003-4884-5304
Atıf/Citation: Aydogan, C. and Turhan, E. 2020. Evaluation of Nineteen Potato Cultivars for Salt Tolerance and Determination of Reliable Parameters in Tolerance. Bursa Uludag Üniv. Ziraat Fak. Derg., 34(2), s. 365-383.
On Dokuz Patates Çeşidinin Tuza Toleranslarının Değerlendirilmesi ve
Toleransta Güvenilir Parametrelerin Belirlenmesi
Öz: Bu çalışmada, genel tuzluluk toleransını farklı morfolojik ve fizyolojik özelliklerdeki değişiklikler ile ilişkilendirerek patates (Solanum tuberosum L.) bitkilerinin tuzluluk toleransındaki çeşit farklılıklarının araştırılması hedeflenmiştir. Ticari olarak kullanılan on dokuz patates çeşidi kontrollü serada 25-18 (± 2) ° C (gündüz/gece) sıcaklık ,% 70 bağıl nem, tuz uygulanmayan ve 5 dS m-1NaCl koşulları altında 90 gün süre ile
yetiştirilmiştir. Bu amaçla, yumrular toprak: torf: vermikülit (3:1:1) içeren 14L’lik saksılara dikilmiştir. Tuz uygulamalarına, tüm fidelerin çıkışından 1 hafta sonra başlanmıştır. Patates bitkilerinin tuz stresine toleransı, görsel zararlanma skalası, hücre membran zararlanma oranı ve lipit peroksidasyonunun göstergesi olan malondialdehit (MDA) içeriği ile belirlenmiştir. Yaprak oransal su kapsamı (YOSK), turgor kaybı (TK) ve toplam çözünür protein (TÇP) içeriği de incelenmiştir. Ayrıca bitkilerin yaprak dokularının protein profilleri SDS-PAGE ile değerlendirilmiştir. Sonuç olarak, değerlendirilen 19 patates çeşidi içerisinden Bettina, Challenger, Granola, Lady Claire, Musica ve Orchestra çeşitlerinin tuz stresine en duyarlı, Desiree ve Russet Burbank çeşitlerinin ise tuz stresine en toleranslı çeşitler olduğu belirlenmiştir. Veriler, düşük hücre membran zararı ve MDA içeriğinin Desiree ve Russet Burbank çeşitlerini nispeten tuza toleranslı çeşitler yaptığını göstermiştir. Ayrıca, görsel zararlanma skalası ve SDS-PAGE protein profillerinin de patates çeşitlerinin tuz stresine toleransında biyobelirteç olarak kullanılabileceği sonucuna varılmıştır.
Anahtar Kelimeler: İyon sızıntısı, lipid peroksidasyonu, protein, Solanum tuberosum L., tuz taraması, tuz zararı.
Introduction
Stress is a sudden environmental change that disrupts an organism's homeostatic balance and outside of its optimal wishes (Bostock et al., 2014). Plants are subjected to many environmental (abiotic) stresses due to their sessile life. Salinity is one of the major abiotic stress factors that have serious effects on plant growth and development and affect agricultural production all over the world (Liang et al., 2018). Salt-affected areas are increasing rapidly, severely restricting agricultural production, especially in hot-arid and semi-arid regions (Belmecheri-Cherifi et al., 2019). Salinity is estimated to affect 7% of the world's agricultural areas, accounting for about one-third of irrigated agricultural land (Maršálová et al., 2016). On the other hand, the limited availability of good quality water resources has increased the use of saline water in irrigated agricultural systems in arid and semi-arid areas (Katerji et al., 2011).
A high concentration of intracellular NaCl leads to ionic and osmotic imbalance, which disrupts cellular ion homoeostasis and water potential, resulting in metabolic degradation, growth retardation, and significant yield reduction (Singh et al., 2018). All major processes are affected, including photosynthesis, protein synthesis,
energy production, and lipid metabolism during the onset and development of salt stress (Parida and Das, 2005). In screening for salt stress, physiological criteria can provide more objective information than agronomic parameters or visual evaluation, especially when screening the characteristics of complex characters (Yeo, 1994). The main problem in this issue is the lack of well-defined plant indicators, which can practically be used by plant breeders to develop salinity tolerance in a number of important agricultural crops. This is partly due to the fact that salt tolerance mechanisms are so complex that the variation occurs not only among species, but also in many cases, between cultivars within a species (Ashraf et al., 2010).
There are many reports referring to screening for salt tolerance of cultivars, genotypes and lines of crops, such as chickpea (Arefian and Shafaroudi, 2015), potato (Zhang et al., 2005; Daneshmand et al., 2010), rice (Chunthaburee et al., 2016) and wheat (Jamali et al., 2015; Çiçek et al., 2018). Recent studies have shown that ion leakage, malondialdehyde (MDA), and leaf relative water content (RWC) can be used as direct indicators of salinity tolerance (Arefian and Shafaroudi, 2015; Singh et al., 2018). It has been determined that salt-sensitive plants tend to have more ion leakage than salt-tolerant plants (Ghoulam et al., 2002). For this reason, cell membrane damage is one of the most important parameters used for early detection and determination of tolerance between cultivars. In some species, it has been indicated that membrane permeability has changed before growth is reduced or severe chlorosis is observed (Mansour and Salama, 2004). Malondialdehyde is the decomposition product of polyunsaturated fatty acids of plant membranes under stress. Therefore, the ratio of lipid peroxidation level can be used as an indicator to assess the tolerance of plants to oxidative stress as well as the sensitivity of plants to salt stress (Jain et al., 2001). High salt concentrations in the soil reduce the plant's ability to absorb water, resulting in slower plant growth. Under stress conditions, plants are required to keep the internal water potential below water potential of the soil and maintain the turgor and water intake necessary for growth (Taibi et al., 2016). This requires an increase in osmosis through the uptake of soil solutes or the synthesis of metabolic (compatible) solutes. An approach to a better understanding of the mechanisms by which plants can respond to salt stress is to study proteins that specifically accumulate after plants are exposed to salinity (Sofy et al., 2017). Many studies have demonstrated that the accumulation of proteins is one of the changes induced by salinity in plants and involved in stress resistance mechanisms (Saleh et al., 2009; Sofy et al., 2017).
Besides its high nutritiousness, potato is one of the promising agricultural products to reduce hunger and poverty in the world with its high yield potential (more than 75% harvest index) (Thiele et al., 2010). For these reasons, researches on sustainable potato production play an important role for food safety and social continuity in the future under constantly changing environmental conditions (Aksoy et al., 2015). The growth and development of the potato plant, which is a temperate climate plant, is restricted due to drought, high-low temperature and salt stress (Kikuchi et al., 2015). According to Dajic (2006), potatoes with a soil salinity threshold of 1.7 dS m-1 are among the plants that are moderately sensitive to salinity. Changing climatic conditions combined with pressure on global food production due to population growth have increased the need for stress-tolerant plant cultivars (Newton et al., 2011). To increase the food supply, there is a need to produce salt-tolerant plants that can grow successfully in salt-affected soils. Hence, the aim of the current study was to
screen 19 potato cultivars in terms of salt stress and to define the salt tolerance levels of the cultivars and to which extent parameters are involved in functional salt stress response in potato based on the presence of variation, and to propose their use for rapid population/genotype/cultivar screening and salt tolerance breeding.
Material and Method
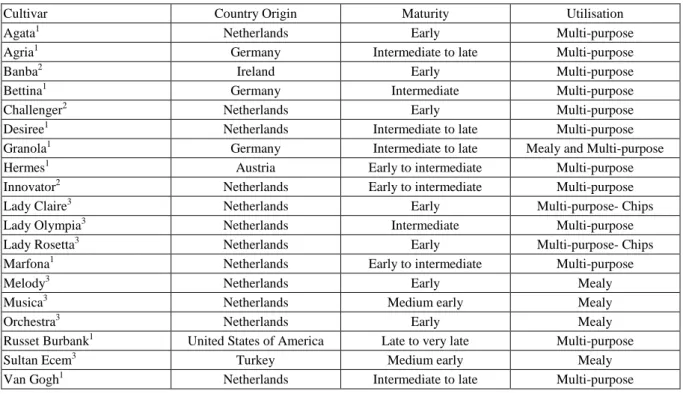
Plant materials and growth conditions: Nineteen potato cultivars were screened for salt tolerance during long-term (90 days) under non-saline and saline conditions. The information about the potato cultivars used in the experiment is given in Table 1.
Sterilization of potato tubers and pots used in the cultivation of plants in the experiment was done with sodium hypochlorite (NaOCl, 1%) solution. The sterilized tubers were pre-sprouted in a climate cabin (DAIHAN WGC-1000, South Korea) which was set to 25 °C temperature and 70% humidity. When the sprouts on the tubers reached ~0.5 cm (15 days later) they were taken to light environment and kept for 7 days at 18 °C and 70% humidity (Karakuş, 2008). Soil sterilization was done by autoclaving (ALP CLG 32L, South Korea) and plant growing medium was prepared with the sterilized soil.
The pre-sprouted potato tubers were planted into 14L pots containing a mixture of the soil, peat, vermiculite (3:1:1) (Celebi-Toprak et al., 2005) as two tubers in each pot. Some physical and chemical properties of the soil and growing medium used in the experiment are given in Table 2. The pots were placed in a controlled greenhouse [T max 25 (±2) °C; T min 18(±2) °C; RH70%]. Salinity application started one week after all the seedlings where emerged. Control plants were irrigated with tap water and salt stress conditions in the growing medium were provided with NaCl (5 dS m-1). Fertilization (Root Star, AJE GMBH, Izmir, Turkey) was carried out with irrigation water when the potato plants had 3-5 leaves, in the period when plants were 25-30 cm height and every 15 days after this period. Oversupply (leaching fraction about 20%) ensured that the EC of the drain water (that was monitored) was practically the same as the EC of the salinity treatment.
Table 1. Characteristics of potato cultivars used in the experiment.
Cultivar Country Origin Maturity Utilisation
Agata1 Netherlands Early Multi-purpose
Agria1 Germany Intermediate to late Multi-purpose
Banba2 Ireland Early Multi-purpose
Bettina1 Germany Intermediate Multi-purpose
Challenger2 Netherlands Early Multi-purpose
Desiree1 Netherlands Intermediate to late Multi-purpose
Granola1 Germany Intermediate to late Mealy and Multi-purpose
Hermes1 Austria Early to intermediate Multi-purpose
Innovator2 Netherlands Early to intermediate Multi-purpose
Lady Claire3 Netherlands Early Multi-purpose- Chips
Lady Olympia3 Netherlands Intermediate Multi-purpose
Lady Rosetta3 Netherlands Early Multi-purpose- Chips
Marfona1 Netherlands Early to intermediate Multi-purpose
Melody3 Netherlands Early Mealy
Musica3 Netherlands Medium early Mealy
Orchestra3 Netherlands Early Mealy
Russet Burbank1 United States of America Late to very late Multi-purpose
Sultan Ecem3 Turkey Medium early Mealy
Van Gogh1 Netherlands Intermediate to late Multi-purpose
1 https://www.europotato.org/countries 2 http://varieties.ahdb.org.uk/varieties 3 http://www.inan-meijer.com/tr/cesitlerimiz
Table 2. Some physical and chemical properties of the soil and growing medium used in the experiment
Properties Soil Growing medium
Saturation 46-48% 77%
Electrical Conductivity (EC) (Saturation) 1.71- 1.80 dS m-1 1.30
EC (Extract) 2,43-2.54 dS m-1 5.07
Physical Properties 13.47% clay, 40.58 %silt, 45.95% sand 7.67
Structure Class loamy (L) 8.45
pH - 7.67 Lime - 8.45 Organic Matter - 3.76 P(kg da-1) - 3.95 K(kg da-1) - 181 Field Capacity 26% 36% Wilting Point 20% 27%
Sampling and measurements: Salt stress tolerance of potato cultivars was determined based on visual damage scale, cell membrane damage rate, MDA content, leaf RWC and loss of turgidity (LT), TSP amount and changes in protein profiles. Plants were scored for visible symptoms of salt injury at 15 days intervals 1 month after salt application started. The leaves, preferably from the third fully developed leaves from the top, were collected randomly from 3 plants of each cultivar 30-days, 60-days and 90-days after salt application started for
leaf cell membrane injury, MDA, leaf RWC and LT analyses. In addition, at the end of the experiment, one group leaf samples were frozen in liquid nitrogen and stored at -80°C until further protein analyses.
Cultivar tolerance according to salt stress visual damage scale: In order to determine salt-tolerant and sensitive cultivars, four pots were observed for each application from all cultivars and their averages were evaluated separately. For this purpose, the 0-5 scale for the potato plant developed by Celebi-Toprak et al. (2005) was used. According to this scale; 0 = No wilt in the plant, no damage to the leaf and stem, 1 = No wilt in the plant, minimal damage to the leaf and stem, 2 = No wilt in the plant, some damage to the leaf and stem, 3 = Wilt in the plant, damage in the leaf and stem, 4 = Lost of turgidity in plants, some damage to the leaf and stem, 5 = Completely lost of turgidity in plants, dead.
Cell membrane injury: Cell membrane damage was calculated as described previously by Arora et al. (1998) with minor modifications. Briefly, leaf discs of 1.5 cm diameter from each application were taken, after that the samples were washed in distil water, was lightly dried by towel and put into test tubes (a leaf disc was placed in each tube) containing 20 mL of distil water. The samples were incubated at 25 °C for 4 hours using an orbital shaker (Thermo Scientific MaxQ 4000, Massachusetts, USA) at 250 rpm before the electrical conductivity of each solution was determined by EC meter (Metler Toledo Seven Easy S30, Colombus, Ohio, USA) then immediately autoclaved (ALP CLG 32L, South Korea) at 121 °C for 20 minutes. After the samples were removed from the autoclave, they were incubated in the orbital shaker for 4 hours and then total conductivity was determined once more at room temperature with the EC meter. By this method, cell membrane injury was defined as the percentage of total ions present in the tissue.
Lipid peroxidation (MDA content): Lipid peroxidation in the leaf samples was evaluated according to Rajinder et al. (1981). Fresh leaf tissues (100 mg) were homogenized in trichloroacetic acid (TCA, 0.1%), so centrifuged (10 000 × g, 5 min, 4°C) (Beckman Coulter Allegra 64R, USA). Subsequently, supernatant was mixed with thiobarbituric acid (TBA, 0.5%) and incubated (30 min, 95ºC). The reaction was terminated in an ice bath for then the aliquots were centrifuged (10 000 × g, 10 min, 25ºC). The absorbance was recorded spectrophotometrically (Perkin Elmer Lambda 25, USA) at 532 nm and non-specific absorbance at 600 nm. The MDA concentration was determined using an extinction coefficient of 155 mM-1 cm-1.
Leaf relative water content (RWC) and loss of turgidity (LT): The analyses related to water status of the leaves (RWC, %; LT, %) were measured as described by Arefian and Shafaroudi (2015). Concisely, leaf discs (1 cm) were weighed and so put in a petri dish containing deionised water for 4 h, and then blotted and weighed, at room temperature for fresh weight (FW) and turgid weight (TW), respectively. For the dry weight (DW), leaf discs were oven-dried (48 h, 70 °C). Leaf RWC and LT were estimated as follows: RWC= [(FW-DW)/ (TW-DW)] × 100, LT= (TW-FW)/TWx100.
Total soluble protein (TSP) content and SDS-PAGE: The TSP content was determined by making some modifications in Shen et al. (2003)'s method. The TSP was extracted with a mortar and pestle from, 250 mg of leaf samples at 4ºC with 1.0% polyvinylpolypyrrolidone (PVPP) and 1 mL of the extraction buffer containing 25 mM tris-base, 275 mM sucrose, 2mM ethylenediamine-tetraacetic acid (EDTA), 10 mM dithiothreitol (DTT),
0,5 mM phenylmethylsulfonyl fluoride (PMSF). The extract was centrifuged (10 000 × g, 10 min, 4 °C) (Beckman Coulter Allegra 64R, USA) and so was used for the Bradford assay (Bradford, 1976). Discontinuous sodium dodecyl sulfate polyacrylamide gel electrophoresis (SDS-PAGE) was performed with a PROTEAN tetra vertical electrophoresis unit (Bio-Rad, Hercules, CA, USA) using “TGXTM FastCastTM premixed acrylamide solutions” kit (Bio-Rad, Hercules, CA, USA). An equal amount of total protein (7.5 μg) was loaded for each sample and gels were stained with Coomassie Brilliant Blue G-250. Protein bands were examined in the imaging system (Vilber, Quantum ST4 Gel Imaging System, France). The SDS-PAGE molecular weight standard (SERVA, Pretained Broad Range SDS-PAGE standard) was used during electrophoresis of the samples.
Statistical analyses: The experiment was arranged in a completely randomized design. The experimental groups were consisted of three replicates with six tubers at each replicate. The suitability of the data to normal distribution was tested with the Shapiro-Wilks test. In the case of normal distribution of the data, analyses were done with parametric tests, in other cases non-parametric tests. Variance analysis, paired t test, Friedman test and Wilcoxon test were used for repeated measurements in the comparison of dependent groups. In comparison of independent groups, Kruskal Wallis test and Mann Whitney U test were used. Statistical analyses were made with SPSS v.22 package program (SPSS Inc., Chicago, IL, USA). Statistical significance level was taken as α = 0.05.
Result and Discussion
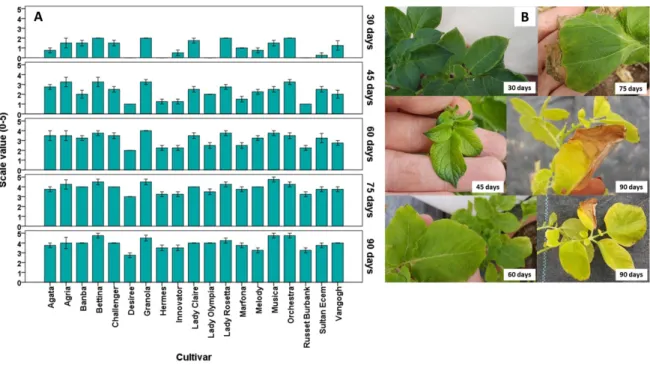
Cultivar tolerance according to salt stress damage scale: The extent of damage (0-5 scale) determined by considering morphological changes in potato cultivars at 15 days intervals is given in Fig. 1A. According to the evaluations, it has been observed that cvs.Desiree, Hermes, Innovator, Lady Olympia, and Russet Burbank had a minimum average damage score both for each sampling period and at the end of the experiment. The Bettina, Granola, Lady Claire, Lady Rosetta and Orchestra cultivars were found to have the highest damage values. It was indicated that as the duration of exposure to salt stress increased, the damage occurring in the cultivars also increased, and statistically significant differences were found between the sampling times based on cultivars. Statistically significant differences were determined among the cultivars at each sampling time (30 and 45 days, p≤0,001; 60, 75, 90 days, p=0.001).
It was determined that short- and medium-term salt stress (5 dS m-1 NaCl) did not affect the vitality of potato plants very much, as the duration of salt exposure increased, it was observed some damages in the leaves and shoots of the plants, and even some plants completely lost their turgidity according to the sensitivity of the cultivar (Fig.1B). According to the evaluations made at the end of 30, 45, 60, 75 and 90 days in plants exposed to salt stress; It has been observed that cvs. Desiree, Hermes, Innovator, Lady Olympia, Russet Burbank had a minimum average damage scores at each sampling time and at the end of the experiment. However, cvs. Bettina, Granola, Lady Claire, Lady Rosetta and Orchestra varieties were found to have the highest damage value. Besides death of the plant, salt stress causes quality loss, necrosis and prevents growth and yield depends on the
tolerance situation (Dajic, 2006). In all cases, the first visible symptoms of salt are these kinds of necrosis. Similar results were obtained in potato (Celebi-Toprak et al., 2005), strawberry (Turhan and Eris, 2005) and rice (Chunthaburee et al., 2016). However, as screening for salt tolerance based on visible symptoms is suitable for susceptible crops (Dajic, 2006).
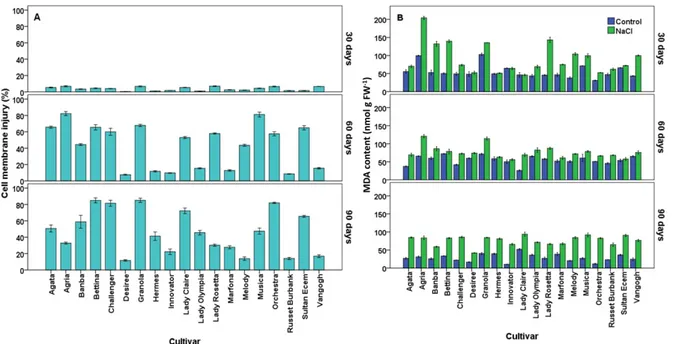
Cell membrane injury: The percentage of cell membrane injury from the leaves of nineteen potato cultivars is shown in Fig.2A. At the end of 30-days, when the percentage of damage from the leaves of the cultivars was evaluated; while cvs.Vangogh (6.60%), Orchestra (6.63%), Granola (6.77%), Agria (6.83%) and Lady Rosetta (6.97%) had the highest proportional injury, the cv. Desiree had the lowest damage value with a 0.42% cell membrane injury percentage. According to the data of the end of 60-days, when the average cell membrane damage values were evaluated; cvs. Agria (82.24%) and Musica (81.14%) had the highest injury values, while cvs. Russet Burbank (7.65%) and Desiree (8.50%) had the lowest damage values. When the leaf damage percentage of plants exposed to NaCl for 90-days was evaluated, it was determined that cvs. Granola (53.1%) and Bettina (51.65%) had the highest damage values and cvs. Desiree (6.56%), Russet Burbank (8.01%) and Innovator (11.22%) had the lowest damage values. Statistically significant differences were found between the cultivars at each sampling time (p≤0.001) and between sampling times for each cultivar (for Banba p=0.039; for Sultan Ecem and Van Gogh, p=0.050; for all other cultivars p=0.018).
Figure 1. Distribution of the injured plants to injury degrees due to 5 dS m-1 NaCl application (Panel A). Error bars represent ± SE of three replications. Morphological changes of potato plants’ leaves at
The cell membrane damage rates and time-dependent changes in the leaves of the varieties are parallel with phenotypic damage scale values. At the end of the salt application, it was indicated that cvs. Bettina, Granola, Musica and Orchestra had the highest rate of cell membrane damage, whereas cvs. Desiree, Melody and Russet Burbank had the lowest cell membrane damage value. Plasma membrane is the first region affected by stress conditions (Hasegawa et al., 2000). Under environmental stresses, plant cell membranes undergo changes that result in a lack of integrity and therefore increase in permeability (Taibi et al., 2016). Hence, the ability of the cell membrane to control the speed of ion traffic inside and outside cells is used as a symptom of membrane damage (Hosseini-Boldaji et al., 2017). Al-Hussaini et al. (2015) indicated that significant differences were found among potato cultivars in injury % under salt stress, "Riviera" had the lowest injury % and considered as a salt tolerant genotype, while "Arnova" had the highest injury % and considered as a salt sensitive genotype. Similarly, Faried et al. (2016) showed that N-Y LARA potato cultivar with lower ion leakage amount and higher membrane stability index (MSI) was more tolerant than cv.720-110 NARC to salinity stress. It is thought that the tolerance of cultivars exposed to salt stress may be due to their sugar-accumulating capacities during stress as sucrose interacts with the cellular membranes to increase the stability of the lipid layers (Arefian et al., 2014).
Lipid peroxidation (MDA content): The changes in MDA content in the leaf tissues of potato cultivars are shown in Figure 2B. According to the average values at the end of 30-days applications, the maximum MDA content occurred in cv. Agria (151.50 nmol g FW-1), whereas the minimum MDA content occurred in cvs. Lady Claire (46.29 nmol g FW-1), Hermes (49.91 nmol g FW-1) and Desiree (50.47 nmol g FW-1). When the applications were compared, the MDA content of the control treatment was 56.80 nmol g FW-1 while the MDA content of the 5 dS m-1 NaCl treatment was 91.92 nmol g FW-1.
When the average MDA contents were evaluated according to the values at the end of 60-days application, cvs.Agria (97.20 nmol g FW-1) and Granola (92.70 nmol g FW-1) had the highest average MDA content, while cv.Lady Claire had the lowest MDA content with 47.56 nmol g FW-1. When the applications were compared, the content of MDA, which was 54.93 nmol g FW-1 in the control, was 76.47 nmol g FW-1 by NaCl application. Accordingly, the difference between cultivars and applications was found statistically significant. In addition, the interaction between cultivar and NaCl applications was found be significant at the 5% level. When the average content of MDA in the leaves was evaluated on the 90th day after NaCl application was started; cv.Lady Claire had the highest MDA content with 75.95 nmol g FW-1, while cv.Desiree had the lowest MDA content with 29.11 nmol g FW-1. There were statistically significant differences between the sampling times in cvs. Agria and Granola (p≤0.001), Banba and Lady Rosetta (p=0.002), Bettina and Innovator (p=0.030), Desiree (p=0.001), Lady Claire (p=0.010), Lady Olympia and Musica (p=0.034). Statistically significant differences were determined between cultivars on the 30th and 60thdays (p≤0.001).
Production of MDA due to damage to the cell membranes is a response of plants to environmental stress, especially salinity (Dehnavi et al., 2017). The accumulation of MDA, a lipid peroxidation product, is considered an appropriate biomarker used to assess free radical levels and membrane damage in living cells (Arefian et al., 2014; Dehnavi et al., 2017; Singh et al., 2018). It is thought that low lipid peroxidation in salt tolerant plants results from more effective antioxidant defence systems (enzymatic and non-enzymatic) that reduce membrane
damage against the effect of free radicals (Azevedo Neto et al., 2006). Salt tolerance mechanisms in potato are not adequately understood, but comparison of sensitive and tolerant cultivars has revealed many parameters associated with salt stress tolerance, such as accumulation of MDA in tolerant cultivars (Sobhanian et al., 2011). The MDA levels in potato micro tubers have been found to increase significantly under in vitro salt stress (Zhang et al., 2005). In a study in which responses of wild potato species to NaCl stress (0, 40, 80 and 120 mM NaCl) were investigated in vitro, it was determined that salinity increased the lipid peroxidation and the percentage of ion leakage in S. stoloniferum and S. bulbosum (Daneshmand et al., 2010). However, the same authors remarked that the content of lipid peroxidation and ion leakage was not affected by salinity in S. acaule (tolerant cultivar). Jbir-Koubaa et al. (2015) have also shown that potato hybrid lines limiting MDA accumulation after 8 days of NaCl application were more salt tolerant than BF15 parent line.
Figure 2. The percentage of cell membrane injury (Panel A) and malondialdehyde (MDA) content (Panel B)
of nineteen potato cultivars. Error bars represent ± SE of three replications
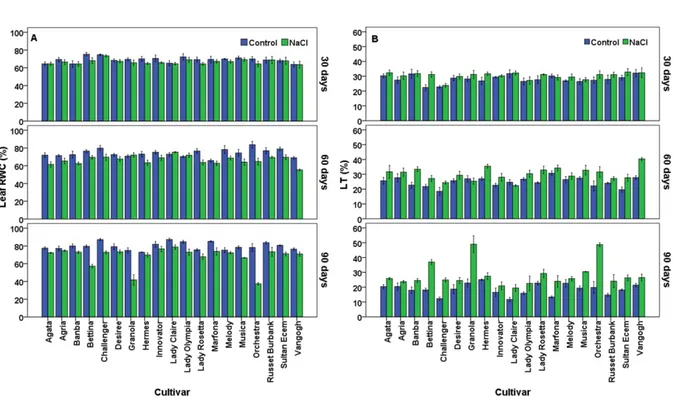
Leaf relative water content (RWC) and loss of turgidity (LT): The leaf RWC values of the cultivars are shown in Fig. 3A. When the average leaf RWC percentages were evaluated according to 30-days NaCl applications and cultivars, it was determined that the cv. Challenger had the highest leaf RWC value with 74.10%, while the cv. Van Gogh (63.70%) had the lowest leaf RWC value. When the applications were compared, the leaf RWC value of the control application was 69.25%, while the leaf RWC value of the NaCl application (5 dS m-1) was 66.64%. The difference between cultivars was found statistically significant (p = 0.022). At the end of the 60-days NaCl application when the average leaf RWC values were evaluated, cv. Challenger had the highest leaf RWC (74.72%), while cv. Van Gogh had the lowest leaf RWC (62.12%). Based
on the average values of data from the applications, the average leaf RWC content in control plants (74.21%) was significantly higher (p=0,009) than that in the NaCl treatment plants (66.61%). When the average leaf RWC values were evaluated according to applications and cultivars, it was determined that cv.Lady Claire had the highest leaf RWC with 83.00%, while cvs. Orchestra and Granola cultivars had the lowest leaf RWC value with 5 dS m-1 NaCl application for 90 days. When the applications were compared, the leaf RWC value of the control application was 79.74%, while the leaf RWC value of the NaCl application (5 dS m-1) was 68.12%, so the difference between the cultivars was statistically significant (p=0.009).
The changes in LT values of potato cultivars are given in Figure 3B. When the average LT values were evaluated according to 30-days NaCl applications and cultivars, it was determined that the cv. Van Gogh had the highest LT value with 32.23%, while the cv. Challenger had the lowest LT value with 23.30%. When the applications were compared, the LT value was 28.06% in control treatment plants and 30.33% in NaCl treatment plants. The difference between the cultivars was statistically significant (p=0.024). At the end of the 60-days NaCl application the maximum LT value occurred in cv. Vangogh (33.16%), whereas the minimum LT value occured in cv. Lady Claire (21.02%). When the applications were compared, the LT value of the control treatment plants was 24.86% while the LT value of the 5 dS m-1 NaCl treatment plants was 30.24%. The difference between the cultivars was statistically significant (p=0.001). When the average LT values were evaluated according to the applications and cultivars; it was indicated that cv. Granola had the highest LT value (37.76%), while cv.Lady Claire had the lowest LT value (15.61%) with 5 dS m-1 NaCl application for 90 days. When the applications were compared, LT value, which was 18.41% in control treatment plants, was 28.26% with NaCl treatment plants. The difference between cultivars was found statistically significant (p = 0.004).
Plant water relationships explain the way it follows in controlling water loss in plant cells, which are effective in physiological and metabolic processes that determine the amount and quality of growth (Passioura, 2010). In potato plants, leaf water potential and osmotic potential decreased with increasing NaCl concentrations (Heuer and Nadler, 1998). It was determined that a positive turgor was maintained during the growth period of potato plants (Solanum tuberosum L. cv. Desiree). It is thought that this is due to osmotic regulation of plants and is achieved under salinity, mainly by accumulation of chloride and proline, and under water deficiency, it is likely due to cell wall elasticity or change of cell size (Heuer and Nadler, 1998). A plant exposed to salinity balances the water potential with water loss, which leads to a decrease in osmotic potential and turgor. This creates chemical signals that can trigger adaptive responses (Hasegawa et al., 2000). Plants with salt stress tolerance have higher levels of leaf RWC under salt stress because they have a higher ability to absorb and hold water (Hu et al., 2013; Singh et al., 2018). At the same time, plants can control their growth under salt stress by reducing water loss due to reducing transpiration from above ground parts or by increasing water uptake by sending more assimilates into the root system (Nunes et al., 2008; Singh et al., 2018). Osmoprotectant compounds reduce the osmotic potential of the cell, allowing water potential to be recovered. This results in plants receiving more water from the root zone, which can immediately buffer the effect of water deficiency and enable them to perform their metabolic activities more efficiently during stress (Ashraf and Foolad, 2007; Singh et al., 2018).
Figure 3. The effects of NaCl application on leaf RWC (Panel A) and LT (Panel B) of nineteen potato
cultivars. Error bars represent ± SE of three replications.
Total soluble protein (TSP) content and SDS-PAGE: The content of TSP in the leaf tissues of potato cultivars is given in Figure 4. When the content of TSP on the leaves according to the cultivars evaluated at the end of 90 days; cv. Agata had the highest (21.64 mg protein g FW-1) TSP content, cvs. Bettina (18.42 mg protein g FW-1), Banba (17.15 mg protein g FW-1), Agria (15.36 mg protein g FW-1) and Desiree (14.85 mg protein g FW-1) cultivars followed this cultivar, respectively. The Innovator (6.97 mg protein g FW-1), Lady Claire (7.17 mg protein g FW-1), Melody (7.29 mg protein g FW-1) and Lady Olympia (8.00 mg protein g FW-1) cultivars had the lowest leaf TSP content. The difference between cultivars was found statistically significant on the base of applications and was calculated as p = 0.001 in the control and p≤0.001 in the NaCl application.
One of the important mechanisms that plants use to deal with osmotic stress conditions is the synthesis of proteins by the task of osmotic regulation (Ashraf and Harris, 2004). The reason that salt stress at low concentrations increases the content of TSP in leaves is thought to be related to the synthesis of new stress proteins, while the decrease in TSP content at higher stress levels is associated with decrease in photosynthesis (Abdoli Nejad and Shekafandeh, 2014). It was found that the content of TSP in the leaf increased in severe salinity conditions, especially in tolerant species, and this provided better photosynthesis and plant growth by increasing water osmotic potential with water intake in olive (Brito et al., 2003), in corn (Azevedo Neto et al., 2006) and in almond (Zrig et al., 2015). Although TSPs of the potato plants have been reported to decrease in saline conditions (Zhang et al., 2009), the expression of defence-related proteins has been found to increase
under salt stress, and it has been suggested that these are involved in the salt stress tolerance mechanism in the potato plant (Aghaei et al., 2008).
Figure 4. The effects of NaCl application on TSP content of nineteen potato cultivars.
Error bars represent ± SE of three replications.
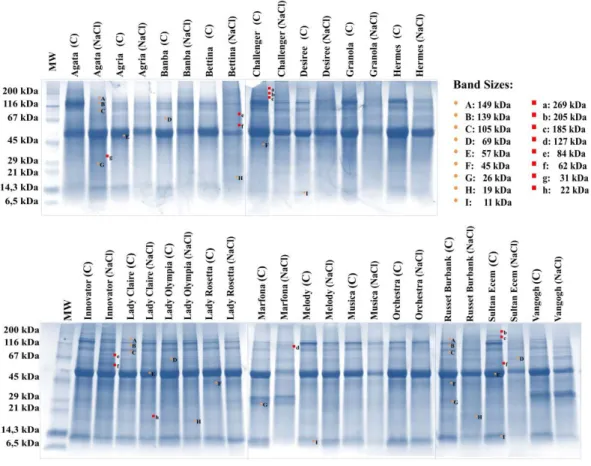
Depending on NaCl application (5 dS m-1) in leaf tissues of potato cultivars, many protein bands that have changed after 90 days have been identified (Figure 5). However, it was only focused on bands that change along with stress. According to this, the bands observed to be different between the cultivars, the bands that were not observed in the NaCl application when they were present in the control sample or were not found in the control application while appearing in the NaCl application, and the bands with increasing/decreasing intensity according to the applications were selected by association with salt stress.
Although their density was different in the leaf tissues of all cultivars, 9 protein bands (149 kDa, 139 kDa, 105 kDa, 69 kDa, 57 kDa, 45 kDa, 26 kDa, 19 kDa, 11 kDa), which were generally decreased and/or disappeared by salt stress, have been identified. In addition, a total of 8 protein bands (269 kDa, 205 kDa, 185 kDa, 127 kDa, 84 kDa, 62 kDa, 31 kDa, 22 kDa) specific to some cultivars, salt-induced or disappeared, were detected. It was determined that 269 kDa size protein band in cv. Desiree, and 205 kDa and 185 kDa sizes bands in cvs. Challenger and Sultan Ecem disappeared by salt stress. Five new protein bands formed under salt stress were identified in cvs. Marfona (127 kDa), Agata (84 kDa, 31 kDa), Bettina and Innovator (84 kDa, 62 kDa), Melody (84 kDa), Sultan Ecem (62 kDa), Lady Claire and Lady Rosetta (22 kDa) (Figure 5).
Figure 5. The effects of NaCl application on protein profile of nineteen potato cultivars. Bands common to all
varieties are shown in capital letters, and bands specific to varieties are shown in lower case (C: Control, MA: Molecular weight standard)
Due to the importance of proteins as functional molecules in controlling cellular processes, it is important to investigate protein pattern changes between contrast genotypes by using SDS-PAGE at critical stress time points (Arefian et al., 2014). In the samples taken from shoots and roots of the potato plant under salt stress conditions, 47 differently expressed protein points with an increase in expression of 20 and a decrease in expression of 27 were identified (Aghaei et al., 2009). An increase in the expression of various defence-related proteins, including osmotin-like protein, various heat shock proteins, and calreticulin, has been detected in the salt-tolerant potato cultivar (Kennebec) (Aghaei et al., 2009). The increased amount of protein due to salt stress is also based on the increase in expression of proteins that exist as much as newly formed proteins (Dubey and Rani, 1989). In addition, the decrease in the amount of protein is based on the denaturation of enzymes involved in the synthesis of amino acids and proteins under salt stress conditions, the decrease in the utility of amino acids and the resulting decrease in protein synthesis (Popova et al., 1995). It was determined that the protein content decreased (Heuer and Nadler, 1998) in potato plants exposed to salt stress. In salt-tolerant cultivars, a higher concentration of protein is produced due to the higher efficiency of the osmotic regulation mechanism, which leads to a
decrease in sodium toxicity in the cytoplasm compared to sensitive varieties. As a result, protein degradation is prevented in tolerant cultivars under salt stress (Jamali et al., 2015).
Conclusions
The results of the screening studies revealed important information and differences in terms of tolerance among potato cultivars. At the end of the salt stress application, among 19 potato cultivars evaluated cvs. Bettina, Challenger, Granola, Lady Claire, Musica and Orchestra were the most susceptible, cvs. Agata, Agria, Banba, Lady Rosetta, Sultan Ecem, Hermes, Innovator, Lady Olympia moderately tolerant, cvs. Marfona, Melody, Van Gogh tolerant, cvs Desiree and Russet Burbank were the highly tolerant to salt stress, respectively. Leaf RWC and LT were not related to higher salt tolerance of the potato cultivars. Besides, it is concluded that, visual damage scale, cell membrane injury and MDA analysis could be used as biomarkers in salt stress tolerance of potato cultivars. The results also suggest that, although TSP content is not an effective parameter, SDS-PAGE protein profiles represent adaptive mechanisms to cope with excessive salt in potato cultivars. It is thought that these results will facilitate the choice of cultivars for both producers and breeders.
Acknowledgement
The authors would like to thank to Eskisehir Osmangazi University Research Foundation for financially supporting this research. All authors participated in the conception of the topic. All authors read and approved the final manuscript after critically revising it for important content. The authors declare that there is no conflict of interest regarding the publication of this article.
References
Abdoli Nejad, R. and Shekafendeh, A. 2014. Salt stress-induced changes in leaf antioxidant activity, proline and protein content in Shah Anjir and Anjir Shiraz fig seedlings. International Journal of Horticultural Science
and. Technology, 1 (2): 121–129.
Aghaei, K., Ehsanpour, A.A. and Komatsu, S. 2008. Proteome analysis of potato under salt stress. Journal of
Proteome Research, 7: 4858–4868.
Aghaei, K., Ehsanpour, A.A. and Komatsu, S. 2009. Potato responds to salt stress by increased activity of antioxidant enzymes. Journal of Integrative Plant Biology, 51: 1095–103.
Aksoy, E., Demirel, U., Öztürk, Z.N., Çalışkan, S. and Çalışkan, M.E. 2015. Recent advances in potato genomics, transcriptomics, and transgenics under drought and heat stresses: A review. Turkish Journal of
Al-Hussaini, Z.A., Yousif, S.H.A., and Al-Ajeely, S.A. 2015. Effect of different medium on callus induction and regeneration in potato cultivars. International Journal of Current Microbiology and Applied Sciences, 4(5): 856-865.
Arefian, M., Vessal, S. and Bagheri, A. 2014. Biochemical changes and SDS-PAGE analyses of chickpea (Cicer
arietinum L.) genotypes in response to salinity during the early stages of seedling growth. Journal of Biological and Environmental Sciences, 8 (23): 99-109.
Arefian, M. and Shafaroudi, S.M. 2015. Physiological and gene expression analysis of extreme chickpea (Cicer
arietinum L.) genotypes in response to salinity stress. Acta Physiologia Plantarum, 37: 193.
Arora, R., Pitchay, D.S. and Bearce, B.C. 1998. Water‐stress‐induced heat tolerance in geranium leaf tissues: A possible linkage through stress proteins? Physiologia Plantarum, 103 (1): 24-34.
Ashraf, M. and Harris, P.J.C. 2004. Potential biochemical indicators of salinity tolerance in plants. Plant
Science, 166: 3–16.
Ashraf, M. and Foolad, M.A. 2007. Improving plant abiotic stress resistance by exogenous application of osmo protectants glycine betaine and proline. Environmental and Experimental Botany, 59: 206–216.
Ashraf, M.A., Ashraf, M. and Ali, Q. 2010. Response of two genetically diverse wheat cultivars to salt stress at different growth stages: leaf lipid peroxidation and phenolic contents. Pakistan Journal of Botany, 42 (1): 559-565.
Azevedo Neto, A.D., Prisco, J.T., Enéas-Filho, J., de Abreu, C.E.B., Gomes-Filho, E., 2006. Effect of salt stress on antioxidative enzymes and lipid peroxidation in leaves and roots of salt-tolerant and salt-sensitive maize genotypes. Environmental and Experimental Botany, 56 (1): 87-94.
Belmecheri-Cherifi, H., Albacete, A., Martínez-Andújar, C., Pérez-Alfocea, F. and Abrous-Belbachir, O. 2019. The growth impairment of salinized fenugreek (Trigonella foenum-graecum L.) plants is associated to changes in the hormonal balance. Journal of Plant Physiology, 232: 311-319.
Bostock, R. M., Pye, M. F., and Roubtsova, T. V. 2014. Predisposition in plant disease: exploiting the nexus in abiotic and biotic stress perception and response. Annual Review of Phytopathology, 52: 517-549.
Bradford, M.M. 1976. A rapid and sensitive method for quantitation of microgram quantities of protein utilizing the principle of protein dye binding. Analytical Biochemistry, 72: 248-254.
Brito, G., Costa, A., Fonseca, H. M., and Santos, C. V. 2003. Response of Olea europaea ssp. maderensis in vitro shoots exposed to osmotic stress. Scientia Horticulturae, 97(3-4): 411-417.
Celebi-Toprak, F., Behnam, B., Serrano, G., Kasuga, M., Yamaguchi-Shinozaki, K., Naka, H., Watanabe, J.A., Yamanaka, S. and Watanabe, K.N. 2005. Tolerance to salt stress of the transgenic tetrasomic tetraploid potato, Solanum tuberosum cv. Desiree appears to be induced by the DREB1A gene and rd29A promoter of
Chunthaburee, S., Dongsansuk, A., Sanitchon, J., Pattanagul, W. and Theerakulpisut, P., 2016. Physiological and biochemical parameters for evaluation and clustering of rice cultivars differing in salt tolerance at seedling stage. Saudi Journal of Biological Sciences, 23 (4): 467-477.
Çiçek, S., Kilercioğlu, B., Doğan, R. and Budaklı Çarpıcı, E. 2018. Bazı ileri makarnalık buğday (Triticum
turgidum var. Durum L.) genotiplerinin çimlenme döneminde tuz stresine tepkileri. Bursa Uludağ
Üniversitesi Ziraat Fakültesi Dergisi, 32 (2): 19-29.
Dajic, Z. 2006. Salt stress: Physiology and molecular biology of stress tolerance in plants, Ed: Madhava Rao, K.V., Raghavendra, A.S., Janardhan Reddy, K, Springer, Dordrecht, pp. 41-99.
Daneshmand, F., Arvin, M.J. and Kalantari, K.M. 2010. Physiological responses to NaCl stress in three wild species of potato in vitro. Acta Physiologiae Plantarum, 32 (1), 91-101.
Dubey, R.S. and Rani, M. 1989. Influence of NaCl salinity on growth and metabolic status of protein amino acids in rice seedling. Journal of Agronomy and Crop Science, 162: 97–106.
Dehnavi, M., Zarei, T., Khajeeyan, R., and Merajipoor, M. 2017. Drought and salinity impacts on bread wheat in a hydroponic culture: A physiological comparison. Journal of Plant Physiology and Breeding, 7(1), 61-74. Faried, H. N., Ayyub, C. M., Amjad, M., and Ahmed, R. 2016. Salinity impairs ionic, physiological and
biochemical attributes in potato. Pakistan Journal of Agricultural Sciences, 53(1).
Ghoulam, C., Foursy, A., and Fares, K. 2002. Effects of salt stress on growth, inorganic ions and proline accumulation in relation to osmotic adjustment in five sugar beet cultivars. Environmental and Experimental
Botany, 47 (1): 39-50.
Hasegawa, P.M., Bressan, R.A., Zhu, J.K. and Bohnert, H.J. 2000. Plant cellular and molecular responses to high salinity. Annual Review of Plant Physiology and Plant Molecular Biology, 51, 463–499.
Hosseini-Boldaji, S.A., Babakhani, B. and Hassan-Sajedi, R. 2017. The investigation of some biochemical and physiological responses of alfalfa (Medicago sativa L.) cultivars from Iran to NaCl salinity stress. Iranian
Journal of Plant Physiology, 8 (1): 2269 -2276.
Heuer, B. and Nadler, A. 1998. Physiological response of potato plants to soil salinity and water deficit. Plant
Science., 137: 43–51.
Hu, T., Yi, H and Hu, L. 2013. Stomatal and metabolic limitations to photosynthesis resulting from NaCl stress in perennial ryegrass genotypes differing in salt tolerance. Journal of American Society of Horticultural
Science, 38: 350–357.
Jain, M., Mathur, G., Koul, S. and Sarin, N.B. 2001. Ameliorative effects of proline on salt stress-induced lipid peroxidation in cell lines of groundnut (Arachis hypogea L.), Plant Cell Reports, 20: 463-468.
Jamali, S.S., Borzouei, A., Aghamirzaei, M., Khosronejad, H.R. and Fathi, M. 2015. Cell membrane stability and biochemical response of seven wheat cultivars under salinity stress. Brazilian Journal of Botany, 38 (1): 63-69.
Jbir-Koubaa, R., Charfeddine, S., Ellouz, W., Saidi, M.N., Drira, N., Gargouri-Bouzid, R. and Nouri-Ellouz, O. 2015. Investigation of the response to salinity and to oxidative stress of inter specific potato somatic hybrids grown in a greenhouse, Plant Cell, Tissue and Organ Culture (PCTOC), 120 (3): 933-947.
Karakuş, M. 2008. Farklı tuz (NaCl) stresi koşullarında prolin uygulamalarının patateste fizyolojik ve morfolojik özelliklere etkileri, Yayınlanmamış Doktora Tezi, Harran Üniversitesi Fen Bilimleri Enstitüsü Tarla Bitkileri Anabilim Dalı, 110 s.
Katerji, N., Mastrorilli, M., Lahmer, F. Z., Maalouf, F., and Oweis, T. 2011. Faba bean productivity in saline– drought conditions. European Journal of Agronomy, 35(1): 2-12.
Kikuchi, A., Huynh, H. D., Endo, T. and Watanabe, K.. 2015. Review of recent transgenic studies on abiotic stress tolerance and future molecular breeding in potato. Breeding Science, 65 (1): 85-102.
Liang, W., Ma, X., Wan, P., and Liu, L. 2018. Plant salt-tolerance mechanism: a review. Biochemical and
Biophysical Research Communications, 495(1): 286-291.
Mansour, M.M.F. and Salama, K.H.A. 2004. Cellular basis of salinity tolerance in plants. Environmental and
Experimental Botany, 52: 113-122.
Maršálová, L., Vítámvás, P., Hynek, R., Prášil, I.T. and Kosová, K. 2016. Proteomic response of Hordeum
vulgare cv. Tadmor and Hordeum marinum to salinity stress: similarities and differences between a
glycophyte and a halophyte. Frontiers in Plant Science, 7:1154.
Newton, A. C., Johnson, S. N., and Gregory, P. J. 2011. Implications of climate change for diseases, crop yields and food security. Euphytica, 179(1): 3-18.
Nunes, C., de Sousa Araújo, S., da Silva, J.M., Fevereiro, M.P.S., and da Silva, A.B. 2008. Physiological responses of the legume model Medicago truncatula cv. Jemalong to water deficit. Environmental and
Experimental Botany, 63 (1-3): 289-296.
Parida A.K. and Das A.B. 2005. Salt tolerance and salinity effects on plants: a review. Ecotoxicology and
Environmental Safety, 60: 324–49.
Passioura, J.B. 2010. Scaling up: The essence of effective agricultural research. Functional Plant Biology, 37: 585–591.
Popova, L.P., Stoinova, Z.G. and Maslenkova, L.T. 1995. Involvement of abscisic acid in photosynthetic process in Hordeum vulgare L. during salinity stress. Plant Growth Regulation, 14: 211–218.
Rajinder, S.D., Dhindsa, R.S., Plumb-Dhindsa, P. and Thorpe, T.A. 1981. Leaf senescence: correlated with increased levels of membrane permeability and lipid peroxidation, and decreased levels of superoxide dismutase and catalase. Journal of Experimental Botany, 32(1): 93-101.
Saleh, J., Maftoun, M., Safarzadeh, S., and Gholami, A. 2009. Growth, mineral composition, and biochemical changes of broad bean as affected by sodium chloride and zinc levels and sources. Communications in Soil
Shen, S., Jing, Y. and Kuang, T. 2003. Proteomics approach to identify wound- response related proteins from rice leaf sheath. Proteomics, 3 (4): 527-535.
Singh, J., Singh, V. and Sharma, P.C. 2018. Elucidating the role of osmotic, ionic and major salt responsive transcript components towards salinity tolerance in contrasting chickpea (Cicer arietinum L.) genotypes.
Physiology and Molecular Biology of Plants, 24(3): 441-453.
Sobhanian, H., Aghaei, K. and Komatsu, S. 2011. Changes in the plant proteome resulting from salt stress: toward the creation of salt-tolerant crops. Journal of Proteomics, 74 (8): 1323-1337.
Sofy, M.R., Sharaf, A.E.M., Osman, M.S. and Sofy, A.R. 2017. Physiological changes, antioxidant activity, lipid peroxidation and yield characters of salt stressed barely plant in response to treatment with Sargassum extract. International Journal of Advanced Research in Biological Sciences, 4: 90-109.
Taibi, K., Taïbi, F., Abderrahim, L A., Ennajah, A., Belkhodja, M. and Mulet, J. M. 2016. Effect of salt stress on growth, chlorophyll content, lipid peroxidation and antioxidant defence systems in Phaseolus vulgaris L..
South African Journal of Botany, 105: 306-312.
Thiele, G., Theisen, K., Bonierbale, M. and Walker, T. 2010. Targeting the poor and hungry with potato science.
Potato Journal, 37: 75‒86.
Turhan, E., and Eris, A. 2005. Effects of sodium chloride applications and different growth media on ionic composition in strawberry plant. Journal of Plant Nutrition, 27(9): 1653-1665.
Yeo, A.R. 1994. Physiological criteria in screening and breeding, In Soil Mineral Stresses, Springer, Berlin, Heidelberg pp. 37-59.
Zhang, X., Hu, L., and He, M.X. 2009. Scattering by pure seawater: effect of salinity. Optics Express, 17(7): 5698-5710.
Zhang, Z., Mao, B., Li, H., Zhou, W., Takeuchi, Y. and Yoneyama, K. 2005. Effect of salinity on physiological characteristics, yield and quality of microtubers in vitro in potato. Acta Physiologiae Plantarum, 27 (4): 481-489.
Zrig, A., Mohamed, H. B., Tounekti, T., Ahmed, S. O., and Khemira, H. 2015. Differential responses of antioxidant enzymes in salt-stressed almond tree grown under sun and shade conditions. Journal of Plant