The effects of electromagnetic fields to whole protein, myelin basic
protein, neuron specific enolase profiles and nitric oxide levels in rat
brains
Gülay ÇİFTÇİ, Hatice Özlem NİSBET, Ayşegül AKAR3, Ertuğrul SUNAN4
1Department of Biochemistry, 2Surgery, 3Biophysics, 4Electrical-Electronics Engineering, University of Ondokuz Mayis, Samsun, Turkey.
Summary: The aim of the study was to investigate the effects of electromagnetic fields (EMF) to whole protein, neuron specific enolase (NSE), myelin basic protein (MBP) profiles and nitric oxide levels in rat brains. In addition, serum NSE was also determined. For this aim, 33 rats with 2-days-old age were divided into three groups. The rats in control group were kept in the normal conditions with no exposure of EMF. Group 2 and 3 were exposed to 900 and 1800MHz EMF respectively for 2 h/day for 90 days at the same time and everyday in the piecage restrainer. At the end of the exposure period, the brains of rats were excluded and splitted up to two parts (right and left), horizontally. The brain parts of same groups were mixed, homogenized and sonicated. The protein concentrations were equalized to 40 mg/ml with spectrophotometer. The protein profiles were determined for sizes and densities of bands with SDS-PAGE. NSE and MBP profiles were detected with western blot technique. Nitric oxide levels were determined by using ELISA test kit. The sizes of protein bands were detected as being same but the densities were found as variable into the groups for all parameters. The protein band, MBP and NSE densities of brains of rats were defined as increased in group 2, but decreased in group 3 when compared with control group. Also, there was no difference seen in right and left parts of brains in all groups. NSE in serum was determined to be higher in group 3 than the group 2 and control. Nitric oxide levels in the right and left brain parts were 224.09±20.32 µM/mL and 207.43±24.19 µM/mL in control group, 253.8±33.58 µM/mL and 336.9±24.47 µM/mL in group 2, 237.87±36.30 µM/mL and 281.53±36.75 µM/mL in group 3, respectively. The difference of nitric oxide levels among the groups was found as not significant (P>0.05). The results of this study may lighten the future and advance studies about the risks of the cellular and digital communication handsets against brain used by the general public.
Key words: Electromagnetic field, myelin basic protein, neuron specific enolase, nitric oxide, rat.
Elektromanyetik alanın rat beyin total protein, myelin basic protein ve neuron spesifik enolaz profilleri ile nitric oksit düzeylerine etkisi
Özet: Bu çalışma elektromanyetik alan (EMF) uygulanmış olan ratların beyin bölgelerindeki total protein, myelin basic protein (MBP) ve neuron spesifik enolaz (NSE) profilleri ile nitrik oksit düzeylerinin karşılaştırmalı olarak incelenmesi amacıyla gerçekleştirilmiştir. Bu amaçla 33 adet 2 günlük rat kullanılmış ve ratlar 3 grup olarak bölünmüştür. Kontrol grubundaki ratlara EMF uygulanmamıştır. Grup 2’de bulunan ratlara 900 ve Grup 3’tekilere de 1800MHz EMF uygulanmıştır. Deney süresi sonunda beyin bölgeleri dikey olarak sağ ve sol parçalara ayrılmıştır. Aynı grupta bulunan ratlara ait sağ ve sol beyin parçaları ayrı ayrı karıştırılmıştır. Bu karışımlar homojenize edildikten sonra sonike edilmişlerdir. Protein konsantrasyonları spektrofotometrik olarak 40 mg/ml olmak üzere eşitlenmiştir. Total protein profilleri bant büyüklükleri ve yoğunlukları yönünden SDS-PAGE yöntemiyle incelenmiştir. NSE ve MBP profilleri western blot tekniği ile belirlenmiştir. Nitrik oksit (NO) düzeyleri ise ELISA ile ölçülmüştür. Protein profilinin tüm gruplarda bant büyüklükleri yönünden aynı olduğu fakat yoğunluklarının değişkenlik gösterdiği görülmüştür. Protein bant, MBP ve NSE yoğunlukları kontrol grubu ile karşılaştırıldığı zaman grup 2’de artmış ve grup 3’te ise azalmış olduğu görülmüştür. NSE profili grup 3’te diğerlerine göre daha fazla bulunmuştur. NO düzeyleri de sırasıyla sağ ve sol beyin bölgelerinde kontrol grubunda 224.09±20.32 µM/mL ve 207.43±24.19 µM/mL, grup 2’de 253.8±33.58 µM/mL ve 336.9±24.47 µM/mL, grup 3’te237.87±36.30 µM/mL ve 281.53±36.75 µM/mL olarak hesaplanmıştır. Bu sonuçların, halk arasında sıklıkla kullanılmakta olan ve EMF yayan iletişim araçlarının beyin üzerine etkileri hakkında gelecekte yapılacak olan çalışmalara ışık tutacağı düşünülmektedir.
Anahtar sözcükler: Elektromanyetik alan, myelin basic protein, neuron spesifik enolaz, nitrik oksit, rat.
Introduction
There is a widespread use of wireless phones (DECT), cellular phones (GSM), wireless local networks (WLAN), mobile phones (Electro Magnetic Field
source), high voltage currents, base stations, and other sources of radiofrequency such as WiFi and bluetooth devices, all of which have come to be an integral part of modern life all around the world. Because of the longer
and increased exposure to the electromagnetic field produced by these sources, the levels of environmental electromagnetic radiation also have been increased (17). GSM base stations produce electromagnetic fields at high frequencies in the 900 and 1800 MHZ range (8, 17). It is suggested that high-frequency electromagnetic field (HF EMF) causes biological tissues to heat up since they absorb the radiation energy (4). Being held close to ears and head during use, brain is especially exposed to high specific absorption ratio (SAR) and electromagnetic field (EMF) because of the antenna of cellular phones. Possible side effects of the EMF produced by cellular phones on the human meningeal tissue, brain and nervous system became an interesting topic for many researchers and led them to conduct studies on the subject (7, 12). There have been many studies on the effects of EMF in the fields of epidemiology, cellular biology and toxicology; however, the possible effects of EMFs on the human central nervous system are still a moot question (8, 19).
Neuron-specific enolase (NSE) is a soluble glycolytic pathway enzyme of dimer protein enolase in neuron form (2-phospho-D-glycerate hydrolase) and plays a role in neuronal differentiation (22). NSE was first identified in brain tissue before it was identified in neuroendocrine cells and tumors (3). It is suggested that NSE neurons are present in all cells originating from neuroendocrine tissues, and that it could thus be used as a marker (14).
Myelin basic protein (MBP) is localized in myelin of central nervous system (CNS), in the elements that produce myelin, and in oligodentrocytes and plays a role in the process of myelinization as a structural element (6).
Nitric oxide (NO), which is a vital biological molecule for the central nervous system, was first identified in 1988 (5). NO performs many important functions in the brain including working as a neurotransmitter, scavenging of reactive oxygen species, regulating cerebral blood flow and inflammations (15). NO could release cytotoxic factors like macrophage and active microglia. It can also lead to mitochondrial dysfunction and contribute to excitatory aminoacide-based neuronal damage, axonal loss, oligodendrocyte damage, neurodegeneration and cell death (26).
This study aimed to identify the total protein profile of both right and left hemispheres and to examine the changes in MBP, NSE protein profiles and nitric oxide after exposure to an electromagnetic field of 900 and 1800 MHZ.
Materials and Methods
Experimental animals: The animal material of study
was 33 male rats which were 2 days-old-age. Rats were obtained from the Center of Medicinal and Surgical Research, Ondokuz Mayis University, and an ethical approval for the study was received from the Laboratory
Animals Local Ethical Committe of Ondokuz Mayis University, Samsun. The animals were housed in standard laboratory conditions on a timer-controlled, 12-hour light/12-12-hour dark cycle, temperatures of 20±1°C and a relative humidity of 55%. The animals were given
ad libitum feed and water. Group 1(control group, n= 11)
was kept in the normal condition of the laboratory, with no exposure EMF. Group 2 (n=11) was exposed to 900 MHz EMF and group 3 (n=11) was exposed to 1800 MHz EMF 2h/day for 90 days at the same time. Group 2 and 3 were subjected to EMF in different rooms.
EMF and exposure system: In this study, the
exposure of EMF was planned as described by Aydin and Akar (2). The radiofrequency was originated from Everest GSM Simulators (Model: 900CW4 and 1800CW2, Turkey). 900 MHz GSM Simulator had 850-950 MHz band interval, 4W maximum output power, 2 RF outputting canal and circular polarization high gain specification equal to mobile phone antenna. For 1800 MHz GSM simulator had 1750-1850 MHz band interval, 2 W maximum output power, 2 RF outputting canal and circular polarization high gain specification equal to mobile phone antenna. To investigate the reflections and background noises in this media, a spectrum analyzer/ satellite receiver (Promax (MC-877C, Barcelona/Spain) and field meter (Holaday (HI-4417, MN/USA) were used before the experiment. During exposure of group 2 and 3, EMF measurements were carried out by utilizing Portable RF Survey System, Holaday (HI-4417, MN/USA) with its standard probe as well. The probe which can perform measurements at 100kHz-3GHz frequency range and 0.3-300V/m interval is able to pick and get a vector sum on the X, Y and Z axis. During exposure, to apply equal distribution of electrical area, monopole antennas of exposure systems in different rooms were placed in the middle point of the plexiglass pie cage restrainer and whole body of rats were fixed as possible as the closest position to monopole antenna (because of rats moving, approximately 2-6 cm for 90 days). To reduce stress of rats, air holes of 1 cm diameter at the top of plexiglass pie cage restrainer were formed. Monopole antenna heights were approximately 15 cm. In order to static grounding, galvanize with 1mm thick was placed at the bottom of the restrainer. Output power for group 2 is set as 2 W and 1 W for group 3 during exposure of rats.
Brain tissue sample preparation: After 90 days of
trial, the animals were sacrificed under general anesthesia, and their brains were horizontally divided into two pieces. The same animals were used to determine the NO levels and to perform Western blot analysis. Tissue samples were weighted and subsequently homogenized using 1/1 (w/v) PBS (pH 7.6) at 4Co. One
unit of the mixture was used for nitric oxide analysis, while four units were reserved for western blot analysis. These tissues were then homogenized by adding 2 units
of 1/2 (w/v) PBS (pH 7.6) to the tissue samples separated for nitric oxide analysis. The supernatant was separated by centrifugation (Kuboto 3500, Japan) at 10 000 g for 60 min at 4oC and was stored at -80 oCuntil assay.
Three units of 1/3 (w/v) 150 mM sodium chloride, Nonidet-P40 (NP40) 1%, Tris (pH 8) 50 mM and protease inhibitor (Roche) were added to the tissues separated for western blot analysis, and the mixture was kept in ice for an hour in a shaker.After homogenization and sonication, the supernatant was separated by centrifugation at 10 000 g for an hour at 4oC and was
stored at -80 oCuntil assay.
Determination of protein concentrations in serum and brain extracts: Before the protein profiles of brain
lysates were analyzed, the amount of protein was measured (Nanodrop-1000, Thermo), and the protein concentrations were equalized to 40 mg/ml with spectrophotometer.
Blood without anticoagulant was collected in tubes from the heart of rats. Blood samples were centrifuged at 1 500 g for 10 min at 4 oC, and serum samples were
stored at – 80oC until assay. The amount of protein in the
sera was measured with total protein kit (Audit Diagnostics, Ireland) by an auto-analyzer (Autolab, AMS Srl, Autoanalyzer, Netherlands).
Serum protein profile and NSE Detection: The
amount of protein in the different groups of serum was equalized. The protein was separated by adding 20 µl of the sample to 2 %10 SDS-PAGE gels according to Laemmli (11). In order to determine the protein profile in the serum, protein bands were dyed with blue silver staining and made visible (17). Western blot analysis was performed after proteins in the gel were transferred to a membrane in order to determine the NSE levels in the serum.
Western blot analysis of neuron specific enolase and myelin basic protein: SDS-PAGE was employed to
determine the protein profile in the brain tissue (11). In order to determine the MBP and NSE protein levels, SDS-PAGE was followed by a western blot analysis. For this purpose, previously prepared brain lysates were mixed with the sample buffer (50mM Tris- HCl, pH 6.8, 12.5% glycerol, 1% sodium dodecyl sulfate (SDS), 5% β-mercaptoethanol and 0.001% bromophenol blue) in a 1/1 mixture, and the proteins were denatured by boiling at 95-100°C before samples were added. Using 20 μl of
the sample and molecular mass standards (Sigma, S8445), %10 SDS-PAGE 2h at 16 mA was prepared. Blue silver staining was used to display the protein profile. Subsequently, protein bands were re-analyzed on the basis of molecular weight using Molecular Imaging Software (Kodak).
Western blot was performed after SDS-PAGE to determine the MBP and NSE protein levels. For this purpose, proteins were separated using %10 SDS-PAGE and prestained markers (Sigma, SDS-7B2). The proteins in the gel were transferred to PVDF membranes (polyvinyl difluoride membranes) (Millipore) using 2.5 mMTris, 0.02 Mglycine at pH 8.3, 20% (v/v) methanol transfer buffer and a semi-dry blot device run with 90 mA for 45 min (26). The membrane was shaken gently in the blocking serum PBS (pH 7.4), 0.1% (v/v) Tween-20 (PBST) for an hour at room temperature. The membrane was subsequently shaken in the anti-Neuron Specific Enolase (NSE) antibody (1/100) (abcam/ab24709) or anti-MBP antibody (1/100) (santacruz/sc-71546) solution for an hour at room temperature. The membrane was washed in PBS for 30 minutes by gentle shaking (three times). For MBP, AB enzyme and peroxidase substrate implementation were conducted in harmony with the procedures of the commercial kit used (goat ABC straining system:sc-2023) after washing. For NSE, biotin-labeled secondary antibody NSE and streptavidin peroxidase enzyme were used in harmony with the procedure outlined by the commercial kit (Histostain-Plus Kits, California, USA). At the end, the bands were dyed with 3-amino-9-etilkarbazol (AEC) (Zymed AEC RED substrate kit, ABD) chromogen. Subsequently, the protein bands were measured on the basis of prestain markers using Molecular Imaging Software (Kodak).
Measurement of nitric oxide in the brain tissue: The
level of NO in the brain was measured using the commercial colorimetric ELISA kit on the supernatant produced from brain tissues previously (Nitric Oxide Assay Colorimetric Kit, Oxford Biomedical Research, Oxford, MI).
Statistical analysis: Student-t test was applied for
the comparison of NO levels in right- and left- brain parts of rats in each group. Randomized factorial design, 2×2 interactions and main effects were analyzed. All data were expressed as mean ± standard error of the mean (SEM). Statistical analyses were executed by SAS (21).
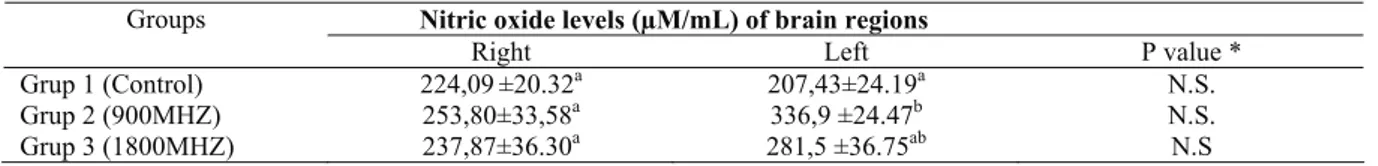
Table 1. The levels of NO in brain parts of rats. Tablo 1. Beyin bölgelerindeki NO düzeyleri.
Nitric oxide levels (µM/mL) of brain regions Groups
Right Left P value *
Grup 1 (Control) 224,09±20.32a 207,43±24.19a N.S.
Grup 2 (900MHZ) 253,80±33,58a 336,9 ±24.47b N.S.
Grup 3 (1800MHZ) 237,87±36.30a 281,5 ±36.75ab N.S
* The differences of means indicated with different letters in same were not important (P>0.05). a,b,ab; The differences of means indicated with different in same column were important (P<0.05).
Results
Electrical field measurements over head, dorsal, tail of 11 rats every week were obtained and mean electric field values of whole body were calculated with using SPSS13 software for 90 days. The whole body EMF values were given arithmetic mean ± SD. The whole body EMF values were found as 28.6±5.26 V/m and 14.67±3.43V/m in group 2 and 3, respectively.
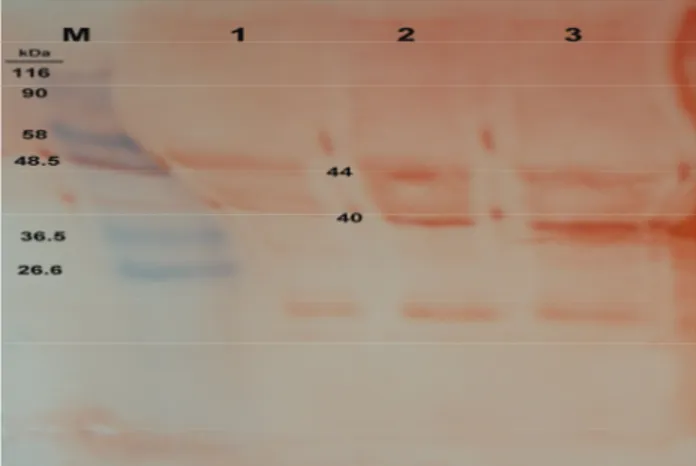
The molecular sizes of protein bands were shown as same but the densities were found as variable among the groups for all parameters (Figure 1).
The protein band, MBP and NSE densities of brains of rats were defined as increased in group 2, but decreased in group 3 when compared with control group (Figure 2 and 3). There was no difference seen in right and left parts of brains in all groups.
The protein concentrations of rat sera were equalized (Figure 4). The NSE bands of sera among groups were found as same, but the densities were found as increased as parallel as frequency (control<900 MHz< 1800 MHz) (Figure 5).
Figure 1. The total protein profiles of right and left brains. M:marker, Lane 1: Group 1 (control) (right brain), Lane 2: Group 1 (control) (left brain), Lane 3: Group 2 (900 MHz) (right brain), Lane 4: Group 2 (900 MHz) (left brain), Lane 5: Group 3 (1800 MHz) (right brain), Lane 6: Group 3 (1800 MHz) (left brain).
Şekil 1. Sağ ve sol beyin bölgelerinin total protein profile. M:marker, Sütun1: Grup 1 (kontrol) (sağ beyin), Sütun 2: Grup 2 (kontrol) (sol beyin), Sütun 3: Grup 2 (900 MHz) (sağ beyin), Sütun 4: Grup 2 (900 MHz) (sol beyin), Sütun 5: Grup 3 (1800 MHz) (sağ beyin), Sütun 6: Grup 3 (1800 MHz) (sol beyin).
Figure 2. The Myelin Basic Protein profiles of right and left brains. M: marker, Lane 1: Group 1 (control) (right brain), Lane 2: Group 1 (control) (left brain), Lane 3: Group 2 (900 MHz) (right brain), Lane 4: Group 2 (900 MHz) (left brain), Lane 5: Group 3 (1800 MHz) (right brain), Lane 6: Group 3 (1800 MHz) (left brain).
Şekil 2. Sağ ve sol beyin bölgelerinin MBP profile. M:marker; Sütun1: Grup 1 (kontrol) (sağ beyin); Sütun 2: Grup 1 (kontrol) (sol beyin); Sütun 3: Grup 2 (900 MHz) (sağ beyin); Sütun 4: Grup 2 (900 MHz) (sol beyin); Sütun 5: Grup 3 (1800 MHz) (sağ beyin); Sütun 6: Grup 3 (1800 MHz) (sol beyin).
Figure 3. The NSE profiles of right and left brains. M: marker, Lane 1: Group 3 (1800 MHz) (left brain), Lane 2: Group 3 (1800 MHz) (right brain), Lane 3: Group 2 (900 MHz) (left brain), Lane 4: Group 2 (900 MHz) (right brain), Lane 5: Group 1 (control) (left brain), Lane 6: Group 1 (control) (right brain).
Şekil 3. Sağ ve sol beyin bölgelerinin NSE profile. M:marker, Sütun 1: Grup 3 (1800 MHz) (sol beyin), Sütun 2: Grup 3 (1800 MHz) (sağ beyin), Sütun 3: Grup 2 (900 MHz) (sol beyin), Sütun 4: Grup 2 (900 MHz) (sağ beyin), Sütun 5: Grup 1 (kontrol) (sol beyin), Sütun 6: Grup 1 (kontrol) (sağ beyin).
Figure 4. The total protein profiles of rat sera. Lane 1: Group 1 (control), Lane 2: Group 2 (900 MHz), Lane 3: Group 3 (1800 MHz).
Şekil 4. Rat serumlarının total protein profili. M:marker, Sütun 1: Grup 1 (kontrol), Sütun 2: Grup 2 (900 MHz);, Sütun 3: Grup 3 (1800 MHz).
The NO levels of right and left brain parts were found as 224.09±20.32 µM/mL and 207.43±24.19 µM/mL in control group, 253.8±33.58 µM/mL and 336.9±24.47 µM/mL in group 2, 237.87±36.30 µM/mL and 281.53±36.75 µM/mL in group 3, respectively. Among the rats in each group, the level changes were found as statistically not important for the left and right brain parts (P>0.05). The NO level comparison for right brains of rats among all groups, the differences were statistically not important (P>0.05). When compared for left brains NO levels of rats, the differences between group 1 and group 2 were found as statistically important (P<0.05); but not important for other groups (P>0.05).
Discussion and Conclusion
Nitric oxide molecules in the brain play an important role in pathological conditions like neurodegenerative diseases as well as in physiological functions such as learning and memory in the brain (23). NO, which could be found in the central nervous system as a protective and neurotoxic agent, facilitates cerebral blood flow and neurotransmission, triggers neuron activity, and promotes neuronal apoptosis (25). The increase in the synthesis of NO is followed by an increase in the synthesis and accumulation of peroxynitrite (ONOO-), which is the metabolic oxide of
NO. In this way, it could cause the emergence and diffusion of oxidative damage as well as neurotoxicity. It is suggested that the determination of the NO synthesis mechanism is important for understanding the bioactivation and inhibition of the brain tissue (20). The possible effects of electromagnetic field emission on the brain from devices that have become an integral part of modern life, is still controversial. In this study, an increase was observed in the level of NO in the right and
left hemispheres of the brain of rats that were exposed to a 900MHZ (group 2) electromagnetic field for 90 days, compared to the control group. When the rats were exposed to 1800 MHZ (group 3) electromagnetic field, the level of NO in their brains decreased and remained closer to that of the rats in the control group. The fact that the level of NO was higher in the brain after exposure to a 900MHZ electromagnetic field could be explained by the increase in the cerebral blood flow due to the vasodilatation effect caused by the increase in the NO levels in response to the damage in the brain. The fall could be explained by the conversion of NO into peroxynitrite after reacting with superoxide. In harmony with the findings of our study, Ilhan et al (9) also observed an increase in the level of NO in the brain of rats which were exposed to a 900 MHz electromagnetic field using mobile phones for 7 days (1h/day). Irmak et al (10) did not find any change in the level of NO in the brains of rabbits which were exposed to a 900 MHZ electromagnetic field for 7 days (30 min/day). However, they observed an increase in the level of NO in the brain tissues of the rats which were exposed to a 4 Hz magnetic field for 60 minutes or a low frequency magnetic field of 50 Hz. They also stated that the increase in the level of free radicals in brain cells causes DNA chain breaks and cell deaths when the rats were exposed to a 60 HZ magnetic field (12). An increase in the level of NO was observed in the brain tissues of C57BL/6 mices (13), which were taken as a model for Parkinson's disease and of male Sprague Dawley rats (24) which were taken as a model for epilepsy. In another study, it was found that the increase in eNOS levels after the ischemia stroke hits increased, NO products and reduced or limited the damage in the brain tissues of the mice that were exposed to ischemia (7).
NSE is an enzyme that catalyzes the conversion of 2-phosphoglyceratein into phosphoenolpyruvate using glycolytic pathway and has a negative effect in gluconeogenesis. This enzyme is found in the cytoplasm and dendrites of neurons and is thought to be an indicator of neuronal damage (14, 22). Although the NSE levels is low in the peripheral blood, it is stated that it could be taken as a sensitive indicator since the NSE levels increase in the serum in case of a neuronal damage (23). In this study, with the aim of identifying NSE, western blot method was used to determine two bands with molecular weights of 44 and 38 kDa. When compared on the basis of band intensity, a positive relationship was found between the band intensity and the electromagnetic field exposed. In the western blot analysis performed to identify the NSE presence in brain tissues, 3 bands with molecular weights of 40, 46 and 50 kDa were identified. The band intensity was found to be highest in the group
Figure 5. The NSE profiles of rat sera. Lane 1: Group 1 (control), Lane 2: Group 2 (900 MHz), Lane 3: Group 3 (1800 MHz).
Şekil 5. Rat serumlarının NSE profili. M:marker, Sütun1: Grup 1 (kontrol), Sütun 2: Grup 2 (900 MHz), Sütun 3: Grup 3 (1800 MHz).
that was exposed to a 900 MHZ electromagnetic field. The band intensity in the group that was exposed to 1800 MHz electromagnetic field was found to be lower than the control group. This is found in the cytoplasm and dendrites of neurons, and rises in the brain after exposure to a 900 MHz electromagnetic field. It is transmitted to serum when the blood-brain barrier is breached due to brain damage. The reason why the level of 2-phospho-D-glycerate hydrolase is higher in the serum after exposure to a 1800 MHz electromagnetic field could be because of the NSE intensity in the brain decreases while an increase occurs in the serum. In a study, it was found that the enolase activity decreased when cells were exposed to an electromagnetic radiation of 15, 55, 65, and 72 HZ (16). In a study conducted by Ammari et al. (1), it was found that after exposure to a 900 MHZ electromagnetic field, the release of glial fibrillary acidic protein (GFAP) increased in the brain because of the impact of oxidative stress on astrocytes. This increase was found to cause neuronal damage, cell death, synapse loss, and axonal myelin damage. No studies have yet been conducted to examine the change in the NSE levels in the brain and in the serum after exposure to 900 or 1800 MHz electromagnetic fields.
It is suggested that the rate of MBP accumulation might be related to the rate of myelin synthesis and determining myelin proteins using polyacrylamide gel electrophoresis could contribute to the evaluation of the relationship between the amount of myelin synthesized and the amount of MBP (3). In this study, using western blot analysis, an increase was observed in the MBP intensity in the brain after being exposed to a 900 MHZ EMF, while a decrease was observed in the MBP intensity in the brain after being exposed to 1800 MHZ electromagnetic radiation, compared to the control group. No statistically significant difference was identified between the right and left hemispheres. No studies have yet been conducted on the status of MBP in the brain after exposure to electromagnetic field. In a study, it was found that the MBP in the brain quickly decreases after prolonged exposure to radiation. It was also stated that this decrease could be closely associated with the decrease in oligodendrocyte precursor cells and the MBP levels (18).
In conclusion, this study is expected to light the way for future studies on the risks concerning the exposure of brain to mobile phones and other popular devices producing EMF.
References
1. Ammari M, Gamez C, Lecomte A, Sakly M, Abdelmelek H, De Seze R (2010): GFAP expression in the rat brain following sub-chronic exposure to a 900 MHz electromagnetic field signal. Int J Radiat Biol, 86, 67–75.
2. Aydin B, Akar A (2011): Effects of a 900-MHz Electromagnetic Field on Oxidative Stress Parameters in Rat Lymphoid Organs, Polymorphonuclear Leukocytes and Plasma. Arc Med Res, 42, 261–267.
3. Cohen SR. Guarnieri M (1976): Immunochemical measurement of myelin basic protein in developing rat brain: an index of myelin synthesis. Dev Biol, 49, 294– 299.
4. Foster KR, Glaser R (2007): Thermal mechanisms of interaction of radiofrequency energy with biological systems with relevance to exposure guidelines. Health Phys, 92, 609–620.
5. Garthwaite J, Boulton CL (1995): Nitric oxide signaling in the nervous system. Ann Rev Physiol, 57, 683–706. 6. Hartman BK, Agrawal HC, Kalmbach S, Shearer WT
(1979): A comparative study of the immunohistochemical localization of basic protein to myelin and oligodendrocytes in rat and chicken brain. J Comp Neurol, 15, 273–290.
7. Hua Q, Zhu X, Li P, Tang H, Cai D, Xu Y, Jia X, Chen J, Shen Y (2008): Refined qing kai ling, traditional chinese medicinal preparation, reduces ıschemic stroke-ınduced ınfarct size and neurological deficits and ıncreases expression of endothelial nitric oxide synthase. Biol Pharm Bull, 31, 633–637.
8. Hyland GJ (2000): Physics and biology of mobile telephony. Lancet, 356, 1833–1836.
9. Ilhan A, Gurel A, Armutcu F, Kamisli S, Iraz M, Akyol O, Ozen S (2004): Ginkgo biloba prevents mobile phone-induced oxidative stress in rat brain. Clin Chim Acta, 340, 153–162.
10. Irmak MK, Fadillioğlu E, Güleç M, Erdoğan H, Yağmurca M, Akyol O (2002): Effects of electromagnetic radiation from a cellular telephone on the oxidant and antioxidant levels in rabbits. Cell Biochem Funct, 20, 279– 283.
11. Laemmli UK (1970): Cleavage of structural proteins during the assembly of the head of bacteriophage 274 T4. Nature, 227, 680–685.
12. Lai H, Singh NP (2004): Magnetic-field-induced DNA strand breaks in brain cells of the rat. Environ Health Perspect, 112, 687–94.
13. Li SD, Liu Y, Yang MH (2011): Effect of Bushenhuoxue Yin on cerebral levels of nitric oxide, tumor necrosis factor-α and interferon-γ in a mouse model of Parkinson disease. Nan Fang Yi Ke Da Xue Xue Bao, 31, 90–92. 14. Marangos PJ, Schmechel DE (1987): Neuron specific
enolase, a clinically useful marker for neurons and neuroendocrine cells. Annu Rev Neurosci, 10, 269–295. 15. Mason RB, Pluta RM, Walbridge S, Wink DA, Oldfield
EH, Boock RJ (2000): Production of reactive oxygen species after reperfusion in vitro and in vivo: protective effect of nitric oxide. J Neurosurg, 93, 99–107.
16. Nazar ASMI, Paul A, Dutta SK (1987): Frequency-dependent alteration of enolase activity by ELF fields Neurons and Neuroendocrine Cells. Annu Rev Neurosci, 10, 269–295.
17. Otto M, Mühlendahl KE (2007): Electromagnetic fields (EMF): Do they play a role in children’s environmental health (CEH)? Int J Hyg Environ Health, 210, 635–644.
18. Panagiotakos G, Alshamy G, Chan B, Abrams R, Greenberg E, Saxena A, Bradbury M, Edgar M, Gutin P, Tabar V (2007): Long-term impact of radiation on the stem cell and oligodendrocyte precursors in the brain. LoS One, 11, 2(7):e588.
19. Repacholi MH (2001): Health risks from the use of mobile phones. Toxicol Lett, 120, 323– 331.
20. Santos RM, Lourenço CF, Gerhardt GA, Cadenas E, Laranjinha J, Barbosa RM (2011): Evidence for a pathway that facilitates nitric oxide diffusion in the brain. Neurochem Int, 59(1), 90–96.
21. SAS (2008): SAS Ver. 9.1.3, SAS Campus Drive Cary, NC 27513 USA.
22. Schmechel D, Marangos PJ, Zis AP, Brightman M, Goodwin FK (1978): Brain endolases as specific markers of neuronal and glial cells. Sci, 20, 199(4326), 313–315. 23. Suzuki R, Yamaguchi T, Kirino T, Orzi F, Klatzo I
(1983) The effects of 5-minute ischemia in gerbils, I: blood brain barrier, cerebral blood flow, and local cerebral glucose utilization changes. Acta Neuropathol (Berl), 60, 207–216.
24. Swamy M, Yusof WR, Sirajudeen KN, Mustapha Z, Govindasamy C (2011): Decreased glutamine synthetase, increased citrulline–nitric oxide cycle activities, and oxidative stress in different regions of brain in epilepsy rat model. J Physiol Biochem, 67, 105–113.
25. Szabo C (1996): Physiological and pathophysiological roles of nitric oxide in the central nervous system. Brain Res Bull, 41 (3), 131–141.
26. Yuan H, Gerencser AA, Liot G, Lipton SA, Ellisman M, Perkins GA, Bossy-Wetzel E (2007): Mitochondrial fission is an upstream and required event for bax foci formation in response to nitric oxide in cortical neurons. Cell Death Differ, 14, 462–471.
Geliş tarihi: 02.12.2011 / Kabul tarihi: 21.02.2012 Address for correspondence:
Gülay Ciftci
Department of Biochemistry Faculty of Veterinary Medicine University of Ondokuz Mayis 55139, Samsun, Turkey Tel.: +90 362 3121919-3908 Fax: +90 362 4576922 [email protected]