O
h
r
c
i
r
g
a
in
e
a
s
l
R
e
ule olakoğlu1, Fili Aka Bolat2, Gonca oban3 1Tıbbi Mikrobiyoloji ABD, 2Tıbbi Patoloji ABD, 3Kadın astalıkları ve Doğum ABD, Başkent niversitesi Tıp Fakültesi, Adana, Turkey P P E A ENCE AND GEN T PE D ST B T N
HUMAN PAPILLOMA VIRUS (HPV)
PREVALENCE AND GENOTYPE DISTRIBUTION
HUMAN PAPİLLOMA VİRUS HPV
PREVALANSI VE GENOTİP DA ILIMI
D : 10.4328/ CAM.4959 eceived: 22.02.2017 Accepted: 11.03.2017 Printed: 01.04.2017 Clin Anal Med 2017 8(suppl 2): 109-13 Corresponding Author: ule olakoğlu, Başkent niversitesi, Adana Dr. Turgut Noyan ygulama ve Araştırma Merke i, üreğir, Adana, Türkiye.
GSM: +905332394006 E-Mail: [email protected] Öz
uman papillomavirus ( P ) prevelansını ve genotip dağılımının değerlendi-rilmesi, profilaktik P aşısının etkisinin i lenmesinde ok önemlidir. Bu a-lışmanın amacı, Başkent niversitesi Adana Dr. Turgut Noyan ygulama ve Araştırma Merke inde, bayan hastalarda P prevalansı ve genotip dağılımı-nı göstermektir. Nisan 2014 ve Kasım 2015 arasında, yaşları dağılımı 22-68 yıl olan 268 bayan hastadan servikal örnekler toplanmıştır. P DNA PC ile oğaltılmış ve P genotiplendirmesi oche linear array detection kit ile ya-pılmıştır. istopatolojik inceleme 146 bayan hastaya yaya-pılmıştır. Toplamda 268 uygun örneğin 124 ünde ( 46.3) P i in po itif bulunmuştur ve bun-ların oğu 84/124 ( 67.7) yüksek riskli ( ) P enfeksiyonlarıdır. P -16 po iti iği 20.9 (n 26) ve P -18 po iti iği 4 (n 5) olarak bulunmuştur. Grade - Servikal intraepitelyal neoplasiler (C N) de P tip spesifik preve-lansı sırasıyla 63.9, 53.8 ve 80 dir. üksek dereceli servikal le yonlarda
P -16 dışında diğer - P tipleri, P -31, 45, 51, 53 ve 56 yı i ermekte-dir. Sonu olarak, hastanemi de P -16 servikal le yonlarla en sık ilişkili P genotipi olarak saptanmıştır. Bu alışma, ayrıca yüksek ve düşük riskli P genotiplerini aynı amanda birden fa la P enfeksiyonların prevalansı hak-kında da bilgi vermektedir.
Anahtar Kelimeler
P Genotiplendirme İntra Epitelya Servikal Neopla iler
Abstract
Assessment of uman papillomavirus ( P ) prevalence and genotype dis-tribution is important for monitoring the impact of prophylactic P vac-cination. This study aimed to demonstrate the P prevalence and type distribution in women from the Baskent niversity Adana Dr. Turgut Noyan Practice and esearch Center. Cervical specimens from 268 women aged 22-68 years were collected between April 2014 and November 2015. is-topathological examinations were performedfor 146 women. P DNA was amplified by PC and P and genotyping was undertaken using the oche linear array detection kit. n total, 124 out of 268eligible samples (46.3 ) tested positive for P , with the majority of these 84/124 (67.7 ) having high-risk ( ) P infection 20.9 were positive for P 16 (n 26), and 4 for P 18 (n 5). P type-specific prevalence was 63.9 , 53.8 ,and 80 among cervical intraepithelial neoplasias (C N) Grades - , respectively. The coverage of other - P genotypes apart from 16, included P 31, 45, 51, 53, and 56in high-grade cervical lesions. n conclusion, P -16 was identified as the main P genotype associated with cervical disease in our hospital. The study reports the identification of high-and low-risk P genotypes as well as the prevalence of multiple P infections.
Keywords
P Genotyping Cervical ntraepithelial Neoplasms.
| Journal of Clinical and Analytical Medicine P P E A ENCE AND GEN T PE D ST B T N
2
Introduction
uman papilloma virus ( P ) is one of the most common causes of sexually transmitted disease in both men and women worldwide. Genital P infection is not a reportable disease, so actual incidence and prevalence figures are not known.Papil-lomaviruses are ubi uitous and have been detected in a wide variety of animals as well as in humans and are specific for their respective hosts. More than 200 types of P have been recogni ed on the basis of DNA se uence data showing genom-ic di erences 1 .
Cervical cancer (CC) represents the second-most common ma-lignancy in women around the world and contributes to 9.8 of all female cancers. ncreasing evidence suggests that multiple factors contribute to the development of cervical cancer, in-cluding genetic susceptibility or host genome, co-infection of
P and other agents, and life-style factors. Based on their as-sociation with cervical cancer and precursor lesions, P s can also be grouped into high-risk and low-risk P types. ow-risk P types include types 6, 11, 40, 42, 43, 44, 54, 61, 70, 72, and 81. igh-risk P types include types 16, 18, 31, 33, 34, 35, 39, 45, 51, 52, 56, 58, 59, 66, 68, and 70. Although all genotypes of P correlate with cervical cancers, P -16 and P -18 infec-tion accounts for about 70 of all cases 1-5 .
Although P -16, 18, 31, 52, and 58 are cited among the most common P genotypes in women with high-grade cervical le-sions worldwide, there is significant variation in the reported prevalence of - P genotypes amongcountries.Since the establishment of P as the central cause of CC, data on P type distribution in CC have proven useful to predict the poten-tial impact of P 16 and 18 vaccines, as well as to determine priorities for inclusion of carcinogenic P types in future P vaccines and P -based screening tests 2,3,5,6 .
The aim of the present study was therefore to provide an esti-mate of the background prevalence of P infection and age-specific P type distrubition, and to highlight the P gen-otypes most fre uently present in cervical cancer tissue and precursor lesionsin Baskent niversity Adana Dr Turgut Noyan Practice and esearchCenter, Adana, Turkey.
Materials and Method Study Population
Between April 2014 and November 2015, an P prevalence study was conducted among the female patients who attended the Baskent niversity Adana Dr. Turgut Noyan Practice and esearch Center. Samples were collected from women with routine cervical screening.
Cervical samples were collected with a cytobrush during gyne-cological exaninations. This was inserted into the endocervical canal and then placed into the transport medium (PreservCyt solution ologic, Bedford, MA, SA) and stored at 4 C until DNA extraction for P genotyping.
Clinical specimens
The 268 cervical cytology specimens collected were analy ed for the presence of DNA of P . istopathological examina-tions were performed in 146 women by the pathologist accord-ing to the Bethesda Diagnostic Criteria. esions were classified as normal cytology, C N - , or adenocarcinoma.
Linear Array HPV genotyping test
The inear Array ( A) P Genotyping test is registered for use in Europefor detecting 37 high- and low-risk P geno-types. The test is based on four major processes: 1) DNA ex-traction by the Ampli ute i uid Media Exex-traction Kit 2) PC amplification of target DNA using P primers 3) hybridi ation of the amplified products into oligonucleotide probes ( inear Array P genotyping test) and 4) detection of probe-bound amplified products by colorimetric determination ( inear Array Detection Kit). Brie y, using PGM 09/11 primers, a region ap-proximately 450 base pairs in length within the 1 gene of the
P genome was amplified by PC . This assay simultaneously amplified a region within the human globin gene as a control for cell ade uacy, nucleic acid extraction, and PC e ciency. PC assays were performed in a reaction volume of 100 l, using 50 l of A P master mix ( oche Molecular Systems) and 50 of DNA. The amplification parameters were: 2 min at 50 C and 9 min at 95 C 40 cycles of 95 C for 30s, 55 C for 1 min, and 72 C for 5 min or until samples were collected. Nucleic acid hybridi ation using a reverse line blot system was then performed. Brie y, the PC amplicons were denatured with the addition of 100 l of A denaturarion reagent ( oche Molecu-lar Systems). A er 10 min at room temperature, the denatured amplicons (100 l) were hybridi ed and detected using the recommended A protocol. Thirty-seven anogenital P geno-types were detected simultaneously, including 6, 11, 16, 18, 26, 31, 33, 35, 39, 40, 42, 45, 51-56, 58, 59, 61, 62, 64, 66-73, 81-84, S39, and CP6108. The A P genotyping strips were visually read using the P reference guide provided. Results
n total, 268samples were received between April 2014 and No-vember 2015. The 146samples were ac uired through punch biopsies (54.5 ).
Prevalence of HPV Infection
n total 124/268 samples tested positive for P (46.3 ), with the majority of those (84/124,67.7 ) having - P infection, 20.9 beingpositive for P -16 (n 26), and 4 being positive for P -18 (n 5). A total of 144/268 (53.7 ) of samples were P negative.Figure outlines the overall P genotype profile among the cohort and P multiplicity. The six most common P genotypes detected across all samples examined were P -16, P -CP6108 (n 17), P -53 (n 17), P 56 (n 13), P 51 (n 10), and P -84 (n 10) (Fig.)
HPV Type-Specific Prevalence
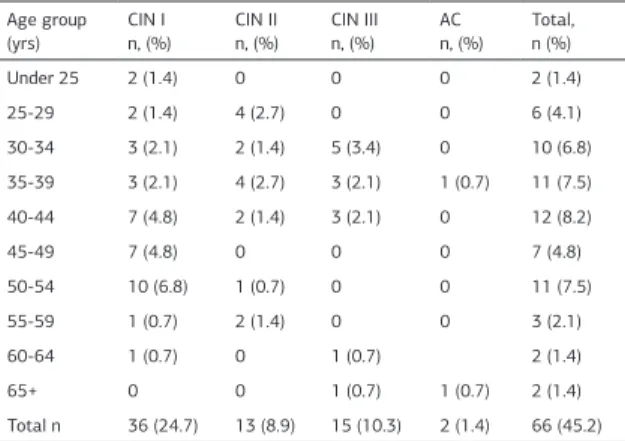
The majority of cervical pathologies were from C N cases (36/146, 24.7 ). P DNA was detected in 23/36 (63.9 ) of C N samples, 7/13 (53.8 ) of C N lesions, and 12/15 (80 ) of C N specimens. P DNA was not detected inAC samples (2/146, 1.4 ). Table details the number of P genotypes de-tected by pathological subtype. ne-third of all samples (28.8 ) had only one P genotype detected (n 19). P -16 DNA was present in 33.3 (5/15) of C N samples (Table ). ther
-P genotypes were more prevalent in C N - pathologies. -P genotypes were most common in C N lesions (Table ). Almost one-half (54.8 ) of all pathologies were P negative. I Journal of Clinical and Analytical Medicine
110
The distribution of P genotypes detected within each cer-vical pathology is detailed in Table . P -16 was the most common P detected across all cervical pathologies (Table ). e found that the prevalence of P infection without cervical abnormalities was 39.7 (58/146).
e-Specific Prevalence r HPV n ec i n
The pathological distribution of samples by 5-year age groups is shown in Table . The mean age of women included in the study was 41 years (range 22-68 years, standard deviation (SD) 9.8 years). n total, 5 samples were from women aged 24 years and under,74 from thoseaged 25-34 years, and 189from those aged 35 years and over. C N was more common in women aged 50-54 years and C N most common in women aged 30-34 years (Table ).
The number of P genotypes decreased with increasing age, with just over half (57.2 ) of all P infections found in tis-sue from women aged between 40 and 44 years (Table ). Most tissue samples had a single P genotype and this was more Fig. verall P genotype profile denoting the prevalence of single and multiple P infections. P genotypes omitted above (no. of single/multiple infections): P 33 (1/1), P 40 (2/0), P 64 (0/1), P 67 (0/1), P 70 (0/4), P 72 (0/2), P 82 (1/2), and P 83 (1/3).
Table . P Genotype Distribution by Cervical Pathology Cervical histologya n ( ) P genotype AC C N C N C N Total P 16 0 2 (5.6) 1 (7.7) 5 (33.3) 8 (12.1) P 31 0 1 (2.8) 2 (15.4) 1 (6.7) 4 (2.7) P 18 0 2 (5.6) 1 (7.7) 0 3 (2.1) P 51 0 2 (5.6) 2 (15.4) 0 4 (2.7) P 45 0 2 (5.6) 1 (7.7) 1 (6.7) 4 (2.7) P 39 0 1 (2.8) 0 0 1 (0.7) P 58 0 1 (2.8) 0 0 1 (0.7) P 66 0 1 (2.8) 0 1 (6.7) 2 (1.4) P 35 0 2 (5.6) 1 (7.7) 0 3 (2.1) P 6 0 2 (5.6) 0 0 2 (1.4) P 73 0 1 (2.8) 0 0 1 (0.7) P 53 0 3 (2.8) 0 2 (13.3) 5 (3.4) P 70 0 2 (5.6) 0 1 (6.7) 3 (2.1) P 42 0 2 (5.6) 0 1 (6.7) 3 (2.1) P 61 0 2 (5.6) 0 2 (13.3) 4 (2.7) P 11 0 2 (5.6) 0 0 2 (1.4) P CP6108 0 1 (2.8) 1 (7.7) 1 (6.7) 3 (2.1) P 82 0 0 2 (15.4) 0 2 (1.4) P 62 0 3 (2.8) 0 0 3 (2.1) P 84 0 4 (11.1) 0 1 (6.7) 5 (3.4) P 81 0 2 (5.6) 0 0 2 (1.4) P 55 0 3 (2.8) 0 1 (6.7) 4 (2.7) P 83 0 0 1 (7.7) 0 1 (0.7) P 67 0 1 (2.8) 0 0 1 (0.7) P 40 0 1 (2.8) 0 0 1 (0.7) P 56 0 2 (5.6) 1 (7.7) 1 (6.7) 4 (2.7) P 72 0 1 (2.8) 0 0 1 (0.7)
aSeveral patients may have had multiple P genotypes on testing. Table . Type of P Genotypes Detected by Cervical Pathology and 5- ear Age Group P -16 and or P -18 n ( ) ther high-risk P genotypes n ( ) ow-risk P genotypes only n ( ) P negative n ( ) Total Pathology C N 4 (11.1) 10 (27.7) 31 (86.1) 13 (36.1) 36 C N 2 (15.4) 7 (53.8) 4 (30.8) 6 (46.2) 13 C N 5 (33.3) 3 (20) 10 (66.7) 3 (20) 15 AC 0 0 0 2 (100) 2
Age group (yrs)
nder 25 2 (6.4) 0 2 (1.9) 3 (60) 5 25-29 3 (9.7) 17 (23.6) 11 (10.5) 14 (48.4) 31 30-34 5 (16.1) 8 (11.1) 19 (18.1) 25 (60.5) 43 35-39 5 (16.1) 16 (22.2) 19 (18.1) 35 (60.3) 58 40-44 7 (22.6) 13 (18) 26 (24.8) 21 (44.9) 49 45-49 2 (6.5) 9 (12.5) 7 (6.6) 17 (56.7) 30 50-54 2 (6.5) 4 (5.6) 14 (13.3) 18 (62.1) 29 55-59 4 (12.9) 4 (5.6) 5 (4.8) 4 (12.5) 13 60-64 0 1 (1.4) 2 (1.9) 6 (75) 8 65+ 1 (3.2) 0 0 1 (50) 2 Total n 31 72 105 144 (53.7) 268 C N, cervical intraepithelial neoplasia (Grades - ) SCC, s uamous cell carci-noma AC, adenocarcicarci-noma.
ancluding high-risk P genotypes other than P 16/18, that is: P -31, 33,35,39,45,51,52,56,58,59, and 68.
Table . Percentage Distribution of the Number of P Genotypes Detected by Pathological Subtype and 5- ear Age Group
Number of P genotypes detected ( of each pathology) P negative 1 2 3 4 or more Total n ( ) Pathology C N 13 (36.1) 8 (22.2) 4 (11.1) 10 (27.8) 1 (2.8) 36 (24.7) C N 6 (46.1) 3 (23.1) 2 (15.4) 1 (7.7) 1 (7.7) 13 (8.9) C N 3 (20) 8 (53.4) 2 (13.3) 2 (13.3) 0 15 (10.3) AC 2 (100) 0 0 0 0 2 (1.4)
Age group (yrs)
nder 25 3 (60) 0 2 (40) 0 0 5 (1.9) 25-29 14 (45.2) 8 (25.8) 2 (6.4) 5 (16.2) 2 (6.4) 31 (11.6) 30-34 25 (58.2) 8 (18.6) 5 (11.6) 5 (11.6) 0 43 (16) 35-39 35 (60.3) 14 (24.1) 3 (5.2) 3 (5.2) 3 (5.2) 58 (21.6) 40-44 21 (42.8) 14 (28.6) 7 (14.3) 7 (14.3) 0 49 (18.3) 45-49 17 (56.7) 9 (30) 1 (3.3) 3 (10) 0 30 (11.2) 50-54 18 (62.1) 6 (20.7) 1 (3.4) 4 (13.8) 0 29 (10.8) 55-59 4 (30.8) 7 (53.8) 0 2 (15.4) 0 13 (4.8) 60-64 6 (75) 1 (12.5) 1 (12.5) 0 0 8 (3) 65+ 1 (50) 0 0 0 1 (50) 2 (0.8) Total 144 67 13 29 6 268
C N, cervical intraepithelial neoplasia (Grades - ) AC, adenocarcinoma.
| Journal of Clinical and Analytical Medicine P P E A ENCE AND GEN T PE D ST B T N
4
common in those aged over 55 years. Four or more P geno-types were detected in some women and this was more com-mon under the age of 40 years (Table ). 17 of women with cervical pathology had P -16 or P -18 detected, and the highest proportion of P positive (16/18)were women aged 40-44 years (Table ). ther - P genotypes were more common in younger women, particularly those aged 25-29 years. - P genotypes were most common in those aged 40-44 years (Table ).
Discussion
This was a retrospective study investigating the P genotype distribution in women in Baskent niversity Adana Dr Turgut Noyan Practice and esearch Center. - P was detected in 67.7 of all samples, with P -16 being the most common (20.9 ) P genotype identified. This is consistent withpreva-lencesdescribed elsewhere across Europe in countries such as Spain, Germany, Finland, North reland, and internationally 3, 5, 7-9 .The prevalence of P in C N lesions in our study was 63.9 in C N , 53.9 in C N , and 80 in C N cases. e didn t detect any P DNA in AC samples across all cervical samples investigated. e found that P -16, CP6108, 53, 56, 51, and 84 were the most common genotypes in all cases and P -16, 31, 45, 51, 53, 56, and 61 were the most common genotypes in high-grade cervical lesions. The number of P genotypes detected in the current study varied across patho-logical grade, with the lowest percentage of single genotypes (22.2 ) in C N lesions and the highest proportion (53.4 ) in C N lesions.
n our study, the proportion of P positivity (67.7 ) was simi-lar to Europe (73.8 ), Central/South America (64.2 vs. 67.3 ), North America (76.4 ), Asia (66.9 ), Africa (70 ), and Turkey (66 ) 7, 11 . owever, our prevalence rate of P 16/18 (25 ) is lower than in Europe (57.6 ) and Africa (67.7 ) 6 .
n general, precancerous cervical lesions, i.e. C N - , have been accepted as a threshold of initiating definite treatment of precancerous lesion of s uamous cell carcinoma (SCC). dentifying P genotype distribution in C N - lesions that potentially progress to SCC is of utmost important in gaining insight into oncogenic potential of the di erent P genotypes, designing protocol for screening, and estimating the e cacy of type-specific P vaccines. As a substantial geographical variation in the P genotype distribution has been observed,
data regarding P type-specific prevalence in each country are therefore re uired 11,12 .
n an examination of FFPE tissue from more than 6,000 women from 17 European countries using the SFF10- iPA25 assay, Tjalma et al. 13 found P -16 was the most fre uent P type detected in both C N and invasive cervical cancer. P -16 and/ or P -18 prevalence (among P positive cases) was reported as 45.8 in C N and 67.3 in C N cases, higher than in our study. The prevalence of P -16 and/or-18 in our study was 15.4 in C N cases and 33.3 in C N cases. The authors reported P -31, 33, 35, 51, 52, 58, and 68 as the most
fre-uently detected genotypes in women with high-grade C N le-sions. t has been reported that, worldwide, P -16 is the geno-type with highest prevalence, followed by P -18 and P 31. Apart from P -16, we found that P - 31, 45, 51, 53, 56, and 61 were the most common genotypes identified in high-grade lesions. A study from Turkey by Ateşer et al. found that P - 16, 6, 11, 58, and 18 were the most common genotypes identified in high-grade lesions 3,10, 14, 15 .
Cli ord et al. 12 have suggested that worldwide, C N - in-fected with P 16, 18, or 45 are more likely to progress to SCC than C N - infected with other types. They performed a meta-analysis of published data to compare P type dis-tribution in C N - and SCC. These data suggest that C N
- infected with P 16, 18, and 45 more o enprogress to SCC. verall, P prevalence was slightly higher in SCC cases (87.6 ) than in C N - (84.2 ). P 16 was the most common type in both SCC (54.3 ) and C N - (45 ). P 18 was also more prevalent in SCC (12.6 ) than in C N - (7 ). hen esti-mated from studies in Asia, Europe, and South/Central America, respectively, there was no material di erence in SCC:C N - ratios for P 16, P 18, P 45, P 33, P 52, or P 58. owever, notably high ratios were observed for P 31 in South/Central America in comparison toEurope and Asia, and for P 58 in China (including Taiwan and ong Kong) in com-parison tonon-Chinese Asian countries, raising the possibility of localised variation in the malignant potential of particular
P types 2,11 .
There were only two cases of AC included in the current in-vestigation. P DNA was not detected in AC samples. There-fore our study is probably not powerful enough to investigate
P prevalence in this subgroup. A recent study in FFPE tissue detected using the SPF10-DE A/ iPA25-PC assay reported thatthe prevalence of P -16 and/or P -18 was 64.3 , lower than reported in an English multi-site investigation of P DNA in cervical cytology and cervical cancer biopsies using the oche inear array typing system (81.9 , among P positive cases) and among AC cases from other European studies (94.6 ) 3 .
e found that the prevalence of P infection without cervical abnormalities was 39.7 . Forman et al. reported that, world-wide, the prevalence of P infection without cervical abnor-malities is 11 to 12 . De Sanjos et al. found that, overall, in Asia and China the prevalence of P in females without cy-tological abnormalities was 8.0 and 11.4-20.3 , respectively ( eng2016). gembo et al. found that P infection among women in Africa with normal cervical cytology was 57.3 in Southern Africa, followed by Eastern Africa (42.2 ), estern Africa (7.8 ), and Northern Africa (12.8 ) 6 .
Table . Age-Specific Prevalence for Cervical Pathology Age group (yrs) C N n, ( ) C N n, ( ) C N n, ( ) AC n, ( ) Total, n ( ) nder 25 2 (1.4) 0 0 0 2 (1.4) 25-29 2 (1.4) 4 (2.7) 0 0 6 (4.1) 30-34 3 (2.1) 2 (1.4) 5 (3.4) 0 10 (6.8) 35-39 3 (2.1) 4 (2.7) 3 (2.1) 1 (0.7) 11 (7.5) 40-44 7 (4.8) 2 (1.4) 3 (2.1) 0 12 (8.2) 45-49 7 (4.8) 0 0 0 7 (4.8) 50-54 10 (6.8) 1 (0.7) 0 0 11 (7.5) 55-59 1 (0.7) 2 (1.4) 0 0 3 (2.1) 60-64 1 (0.7) 0 1 (0.7) 2 (1.4) 65+ 0 0 1 (0.7) 1 (0.7) 2 (1.4) Total n 36 (24.7) 13 (8.9) 15 (10.3) 2 (1.4) 66 (45.2)
I Journal of Clinical and Analytical Medicine 112
P P E A ENCE AND GEN T PE D ST B T N
A previous meta-analysis showed that, worldwide, P preva-lence was highest in the younger age categories ( 34 years), with a second peak in the older age categories ( 45 years). e observed a similar pattern, with peaks of prevalence in subjects aged 34 years and these older than 40 years. The mechanism of the association between P infection and age is not clear. ee et al. showed that changes in vaginal microbiota in post-menopausal women made them more susceptible to P infec-tion. ther research found that bacterial vaginosis was associ-ated with susceptibility to P infection. Moreover, the social activities of the younger age groups can lower immunity to P and increase chance exposure 15, 16 .
n this study, multiple P infections were identified in 38.7 of the positive specimens, and the age-specific prevalence of mul-tiple P infections also showed peaks at ages 25-29 and 55-59 years. eng et al. 15 speculated that the decline of immuno-surveillance in the younger and older age groups may increase the risk of multiple P infections. Also it should be noted that P has the ability to evadehost defenses. According to previ-ous studies, people infected with 2 P genotypes might have an increased risk of developing cervical cancer. owever, the in-teraction af various genotypes in co-infections remains unclear, and future studies are needed to verify whether coordinated mechanisms in co-infections exist.
Although we achieved a few novel findings in the present study, there remain other relevant factors that should be considered. Firstly, we collected the samples from the general female popu-lation, and not specifically cervical cancer patients. Therefore the findings and conclusions drawn from this study may not be applicable for estimating P genotype-specific prevalence in woman a ected by cervical cancer. Secondly, P also causes diseases in men, including cancer of the penis Smith et al. 17 reported that the prevalence of overall P was 16 in men.
owever, the objectives of our study did not include an evalua-tion of gender-specific prevalence of P infecevalua-tion. t would be interesting in future studies to investigate whether the preva-lence of P infection in men matches that of women, since vaccinating males is also considered important 15 .
n conclusion, P -16 was identified as the main P genotype associated with cervical disease in our hospital. The study re-ports the identification of high-and low-risk P genotypes as well as the prevalence of multiple P infections. hen com-paring the P prevalence between countries it is important to consider that variations in P positivity may be explained by di erences in the uality and type of samples analy ed (biop-sies, surgical specimens, or fresh tissue), as well as the methods of P detection and assessment.
Competing interests
The authors declare that they have no competing interests. References
1. Burd EM. uman Papillomavirus and Cervical Cancer. Clin Microbiol ev 2003 16 (1): 1-17.
2. Ciapponi A, Bardach A, Glujovsky D, Gibbons , Picconi MA. Type-specific P prevalence in cervical cancer and high-grade lesions in atin America and the Ca-ribbean: Systematic eview and meta-analysis. P oS ne 2011 6 (10): e25493. 3. Anderson A, orke MA, ilson , amison , Gavin AT on behalf of the North-ern reland P orking Group. P prevalence and type-distribution in cervical cancer and premalignant lesions of the cervix: A population-based study from Northern reland. Med irol 2016 88:1262-70.
4. eng - , an - , uang - , e C- , iu -G, uan - et al. Prevalence and genotype distribution of human papillomavirus among akka women in Chine. Ann Transl Med 2016 4 (15): 276.
5. i N, franceschi, owell- ones , Snijders P F, Cli ord GM. uman papilloma-virus type distribution in 30,848 invasivecervical cancers worldwide: variation by geographical region, histological tyoe and year of publication. nt Cancer 2011 128: 927-35.
6. gembo K, Gona PN, Seymour A , Park S, Bain PA, Maranda , gembo G. Prevalence of uman Papillomavirus genotypes among African women with nor-mal cervical cytology and neoplasi: A systematic review and meta-analysis. P oS
ne 2015 14 10 (4):e0122488.
7. Garc a-Espinosa B, Moro- odr gue E, lvere -Fern nde . Genotype distribu-tion of uman Papillomavirus ( P ) in histological secdistribu-tions of cervical intraepi-thelial neoplasia and invasive cervical carcinoma in Madrid, Spain. BMC Cancer 2012 12: 533-41.
8. onge M, Bısecke G, einecke A, Bettendorf . uman Papillomavirus genotype distribution in cytologically screened women from Northwest Germany. Acta Cytol 2013 57: 591-2.
9. einonen MK, Anttila A, Malila N, Dillner , Forslund , Nieminen P. Type- and age-specific distribution of human papillomavirus in women attending cervical cancer screening in Finland. Br Cancer 2013 109:2941-50.
10. Ataşer G, Aydın AS, Günver F, Purisa S. Kronik vajinal akıntılı hastalarda P -DNA po iti ik oranı ve sitopatolojik sonu ların değerlendirilmesi. Med Bull aseki 2014 52:93-7.
11. Kietpeerakool C, Kleebkaow P, Srisomboon . uman Papillomavirus genotype distribution among Thai women with high-grade cervical intraepithelial lesions and invasive cervical cancer: a literature review. Asian Pac Cancer Prev 2015 16(3):5153-8.
12. Cli ord GM, Smith S, Aguado T, Franceschi S. Comparison of P type distri-bution in high-grade cervical lesions and cervical cancer: a meta-analysis. British
ournal of Cancer 2003 89 (1): 101-5.
13. Tjalma A, Fiander A, eich , Powell N, Nowakowski AM, Kirschner B, et al. Di erences in human papillomavirus type distribution in high-grade cervi-cal intraepithelial neoplasi and invasive cervicervi-cal cancer in Europe. nt Cancer 132:854-67.
14. Ermel A, adadri, Tong , rango , Macharia B, amogola-Masire D, et al. nvasive cervical cancers in the nited States, Botswana and Kenya: P type distribution and health policy implications. nfectious Agents and Cancer 2016 11:56.
15. eng - , an - , uang - , e C- , iu -G, uan - , et al. Prevalence and genotype distribution of human papilloma virus akka women in Chine. Ann Transl Med 2016 4(15):276.
16. ee E, ee S, ee , Song -M, ee K, an M , et al. Association of the vaginal microbiota with uman Papillomavirus infection in a Korean twin cohort. P oS
ne 2013 8:e63514.
17. Smith S, Gilbert PA, Melendy A, ana K, Pimenta M. Agespecific prevalence of uman Papillomavirus infection in males: a global review. Adolesc ealth 2011 48:540-2.
How to cite this article:
olakoğlu , Bolat FA, oban G. uman Papilloma irus ( P ) Prevalence and Genotype Distribution. Clin Anal Med 2017 8(suppl 2): 109-13.