Turkish Journal of Fisheries and Aquatic Sciences 13: 725-736 (2013)
www.trjfas.org ISSN 1303-2712 DOI: 10.4194/1303-2712-v13_4_18
© Published by Central Fisheries Research Institute (CFRI) Trabzon, Turkey in cooperation with Japan International Cooperation Agency (JICA), Japan
Changes of Macroalgae Biomass in Sinop Peninsula Coast of the Black Sea,
Turkey
Introduction
Benthic macroalgae communities play an important ecologically functional role in coastal ecosystems as they are essential for many organisms as habitat (Cacabelos et al., 2010), mating and nursery grounds (Shaffer, 2003) and feeding areas (Lorentsen et al., 2004). They have an important contribution to primary production (Mohammed and Fredriksen, 2004), the sediment stabilization and coastline protection (Madsen et al., 2001), and are a suitable indicator on the ecological status of coastal communities (Juanes et al., 2008). One of the most
conspicuous results of eutrophication in shallow coastal waters is the mass development of macroalgae. In general, the process of eutrophication leads to a shift in the macrophytobenthic community from slow-growing seagrasses and macroalgae to phytoplankton and fast-growing macroalgae such as Ulva, Enteromorpha and Cladophora spp. (Duarte 1995). Because of these properties they are the most important organisms maintaining the ecosystem’s stability.
There have been various studies on macroalgae during the last ten years and they are known to determine patterns of macroalgal dominance and biomass in the Black Sea regional ecosystems. Most
Ali Karaçuha
1,*, Melek Ersoy Karaçuha
11
Sinop University, Faculty of Fisheries, 57000 Sinop, Turkey.
* Corresponding Author: Tel.: +90.368 2876256-3206; Fax: +90.368 2876268; E-mail: [email protected]
Received 26 July 2012 Accepted 4 December 2013
Abstract
In this study, seasonal and annual variations in seaweed species composition and biomass were examined to determine the ecological status of macroalgae around the Sinop Peninsula, Black Sea. Algal samples were collected monthly from five stations at zero to 0.5 m depth on rocky substrata with quadrat by hand during 2010. As a result of this study, a total of 30 taxa were identified, comprising 9 Chlorophyta, 8 Heterokontophyta and 13 Rhodophyta. The total highest biomas value (8515.5 g dw m-2) was obtained from Hamsilos station and the lowest from Dışliman (2466.0 g dw m-2) and Öztürkler (2485.0 g dw m-2
) stations, throughout the year. Based on Bray-Curtis similarity values, the stations can be classified in three groups. As a result, the highest values of biomass were found to be in the unpolluted stations, while a progressive decrease in such values was observed in stations where the effects of the anthropogenic pressure became more marked.
Keywords: Macroalgae, biomass, Sinop, Black Sea.
Sinop Yarımadası Kıyıları (Karadeniz, Türkiye) Makroalg Biomasındaki Değişimler Özet
Bu araştırmada, Karadeniz’in Sinop Yarımadası çevresindeki denizel makroalglerin ekolojik durumlarını belirlemek için mevcut alg türlerinin komposizyon ve biyokütlesindeki mevsimsel ve yıllık değişimler incelenmiştir. Alg örnekleri 0-0,5 m arasındaki kayalık substratumlarda beş ayrı istasyondan 2010 yılı boyunca aylık olarak kuadrat kullanılarak elle toplanmıştır. Bu araştırma sonunda, 9’u Chlorophyta, 8’i Heterokontophyta ve 13’ü Rhodophyta olmak üzere toplam 30 takson tespit edilmiştir. Bir yıl boyunca en yüksek biomas değeri 8515,5 g/m2 kuru ağırlık ile Hamsilos, en düşük değerler ise Dışliman (2466,0 g/m2 kuru ağırlık) ve Öztürkler (2485,0 g/m2 kuru ağırlık) istasyonlarından tespit edilmiştir. Bray-Curtis benzerlik analizine göre istasyonlar mevsimsel olarak üç ayrı grup altında toplanmıştır. Sonuç olarak, kirlenmemiş istasyonların daha yüksek biomas değerine ulaştığı, insan etkilerinin daha belirgin olarak görüldüğü yerlerde önemli düzeyde azalış gösterdiği belirlenmiştir.
726 A. Karaçuha and M. Ersoy Karaçuha / Turk. J. Fish. Aquat. Sci. 13: 725-736 (2013)
of these studies (Kostenko, 1990; Oskolskaya et al., 2001; Sava et al., 2003; Bologa and Sava, 2006; Sava and Bologa, 2010; Sava et al., 2011) however, have been carried out on the shores of northern part of the Black Sea. The changes of macroalgae biomass was poorly known in the Black sea coast of the Turkey. The single study on the the biomass of the macroalgae was by Bat et al. (2001), who studied only Ulva linza Linnaeus, 1753 and Ulva lactuca Linnaeus, 1753, which is in seawage pollution area of Sinop peninsula coast. On the other hand, the macroalgal floristic studies have been mostly described (Aysel et al.,2004; Karaçuha and Gönülol, 2007). Therefore, the purpose of this study is to describe the diversity and abundance of the marine macroalgae and analyze the spatial variations of macroalgae biomass in Sinop Peninsula coast of the Black sea. The results are believed to be useful as reference sources for the further study of macroalgal biomass in the Black sea coasts of Turkey.
Materials and Method
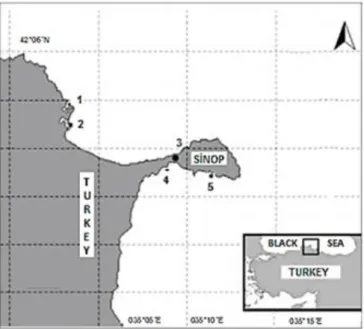
The work was undertaken at five stations (Hamsilos, Akliman, Dışliman, Öztürkler, Karakum) in Sinop Peninsula coast (Figure 1). Dışliman area (42°01′52″N, 35°09′06″E) of Sinop, input of sewage is the region. The shallow subtidal zone of Karakum (42°00′54″N, 35°11′30″E) and Öztürkler (42°01′01″N, 35°07′54″E) were very popular seaside resort throughout the summer. On the other hand, Hamsilos (42°03′38″N, 35°02′39″E) and Akliman (42°03′03″N, 35°02′36″E) stations were a natural cove. However, tourism and fishing has evolved considerably in Akliman. Also, Hamsilos and Akliman stations were relatively clean areas compared to the other stations.
Algal samples were collected between January 2010 and December 2010. The field methodology
involves monthly quantitative collections by hand. Algal samples were collected at zero to 0-0,5 m depth on rocky substrata where seaweed formed a dense canopy. A 20x20 cm area was marked with a square metal frame and all algal samples were collected within this area. Living macroalgae were carefully separated from the substrate in each quadrat with a knife and placed in a labeled plastic bag. Three replicates of algae samples were taken at each stations. Also, the water quality (oxygen, conductivity, temperature, salinity, pH) at each station were measured by using a WTW (water checkes physical parameter) device. Samples were transferred to the laboratory for identification. Samples were separated from foreign materials (stones, sand, animals) manually, and the specimens of each species were rinsed with distiled water and then quickly dried on blotting paper. The material belonging to Rhodophyta according Silva et al. (1996), Cholorophyta according Gallordo et al. (1993) and Ochrophyta according Ribera et al. (1992) were determined. A floristic list of the collected species was compiled and updated according to Algae Base and WORMS. Identified algae were then dried at 60°C for 48 hours to determine the dry weight for each species (Zhuang and Zhang, 2001) and weighed to determine the biomass with a balance with 0.001 g precision. The evaluation of algae abundance in quadrates was determined by dry biomass.
The calculation of ecological indices was based on a methology adapted to the phytobenthos by Boudouresque (1970). The multivariate analysis of communities, such as the number of species, the biomass values of specimens, the diversity index (H’) (Shannon and Weaver, 1949), the Similarity Index (Bray and Curtis, 1957) and evenness index (J’) (Pielou, 1975) were calculated for each sampling period, using the software PRIMER 5.2.9. Triangular matrices were computed based on similarities
A. Karaçuha and M. Ersoy Karaçuha / Turk. J. Fish. Aquat. Sci. 13: 725-736 (2013) 727
between every pair of samples, using the Bray-Curtis coefficient and transformed data (in order to reduce the contribution of dominant species in the similarity matrix). The Shannon diversity index (H´) (logarithms base e) was calculated (based on biomass data) using g dry weight m-2. To determine better seasonal distribution patterns, the biomass data of all stations in each sampling period were analyzed using cluster and multidimensional scaling (MDS) techniques, based on the Bray-Curtis similarity (group average technique), The routine SIMPER was run to look for the species that contributed more to average similarity of groups of samples.
Results
Physico-Chemical Analyses
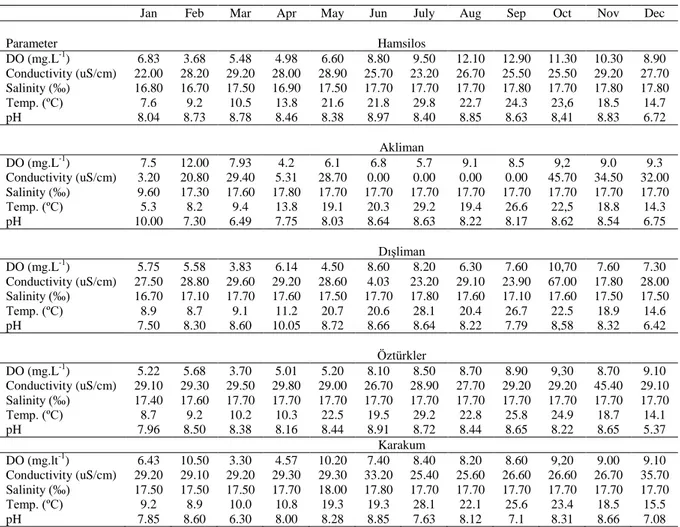
The mean monthly values of the seawater temperature (Table 1) were minimum in January (~5°C, Akliman) and maximum in July (~30°C, Hamsilos). In the same period, the maximum salinity value was determined in May (18‰, Karakum) and the minumum value was obtained in January (5,3‰,
Akliman). On the other hand, the DO (mg-1) values were higher in Hamsilos than the other stations. Generally, the minimum DO (mg-1) values were recorded at Dışliman (Table 1).
Floristic and Ecological Analysis Annual Variation
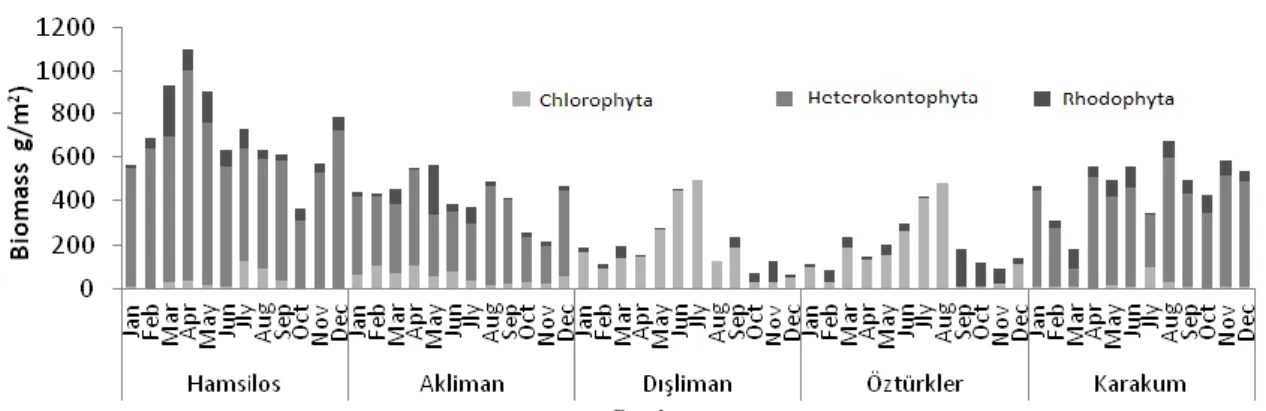
A total of 30 taxa were identified during this study, comprising 9 Chlorophyta, 8 Heterokontophyta and 13 Rhodophyta. A list of species and average seasonal biomass of individuals at each station is given in Table 2. Monthly values of biomass ranged from 64,35 dry weight (g/m2) (Dışliman station in December) to 1097,73 dry weight (g/m2) (Hamsilos station in April), throughout the year (Figure 2).
The highest number of species was found at Akliman (max. 25 species) and the lowest at Dışliman (min 15 species) stations throughout the year (Figure 3, Table 2). Besides, the highest total biomas value (8515,5 g dry weight m-2) was obtined from Hamsilos station and the lowest from Dışliman (2466,0 g dry weight m-2) and Öztürkler (2485,0 g dry weight m-2)
Table 1. Physico-chemical parameters of sea water (*)
Jan Feb Mar Apr May Jun July Aug Sep Oct Nov Dec
Parameter Hamsilos DO (mg.L-1) 6.83 3.68 5.48 4.98 6.60 8.80 9.50 12.10 12.90 11.30 10.30 8.90 Conductivity (uS/cm) 22.00 28.20 29.20 28.00 28.90 25.70 23.20 26.70 25.50 25.50 29.20 27.70 Salinity (‰) 16.80 16.70 17.50 16.90 17.50 17.70 17.70 17.70 17.80 17.70 17.80 17.80 Temp. (ºC) 7.6 9.2 10.5 13.8 21.6 21.8 29.8 22.7 24.3 23,6 18.5 14.7 pH 8.04 8.73 8.78 8.46 8.38 8.97 8.40 8.85 8.63 8,41 8.83 6.72 Akliman DO (mg.L-1) 7.5 12.00 7.93 4.2 6.1 6.8 5.7 9.1 8.5 9,2 9.0 9.3 Conductivity (uS/cm) 3.20 20.80 29.40 5.31 28.70 0.00 0.00 0.00 0.00 45.70 34.50 32.00 Salinity (‰) 9.60 17.30 17.60 17.80 17.70 17.70 17.70 17.70 17.70 17.70 17.70 17.70 Temp. (ºC) 5.3 8.2 9.4 13.8 19.1 20.3 29.2 19.4 26.6 22,5 18.8 14.3 pH 10.00 7.30 6.49 7.75 8.03 8.64 8.63 8.22 8.17 8.62 8.54 6.75 Dışliman DO (mg.L-1) 5.75 5.58 3.83 6.14 4.50 8.60 8.20 6.30 7.60 10,70 7.60 7.30 Conductivity (uS/cm) 27.50 28.80 29.60 29.20 28.60 4.03 23.20 29.10 23.90 67.00 17.80 28.00 Salinity (‰) 16.70 17.10 17.70 17.60 17.50 17.70 17.80 17.60 17.10 17.60 17.50 17.50 Temp. (ºC) 8.9 8.7 9.1 11.2 20.7 20.6 28.1 20.4 26.7 22.5 18.9 14.6 pH 7.50 8.30 8.60 10.05 8.72 8.66 8.64 8.22 7.79 8,58 8.32 6.42 Öztürkler DO (mg.L-1) 5.22 5.68 3.70 5.01 5.20 8.10 8.50 8.70 8.90 9,30 8.70 9.10 Conductivity (uS/cm) 29.10 29.30 29.50 29.80 29.00 26.70 28.90 27.70 29.20 29.20 45.40 29.10 Salinity (‰) 17.40 17.60 17.70 17.70 17.70 17.70 17.70 17.70 17.70 17.70 17.70 17.70 Temp. (ºC) 8.7 9.2 10.2 10.3 22.5 19.5 29.2 22.8 25.8 24.9 18.7 14.1 pH 7.96 8.50 8.38 8.16 8.44 8.91 8.72 8.44 8.65 8.22 8.65 5.37 Karakum DO (mg.lt-1) 6.43 10.50 3.30 4.57 10.20 7.40 8.40 8.20 8.60 9,20 9.00 9.10 Conductivity (uS/cm) 29.20 29.10 29.20 29.30 29.30 33.20 25.40 25.60 26.60 26.60 26.70 35.70 Salinity (‰) 17.50 17.50 17.50 17.70 18.00 17.80 17.70 17.70 17.70 17.70 17.70 17.70 Temp. (ºC) 9.2 8.9 10.0 10.8 19.3 19.3 28.1 22.1 25.6 23.4 18.5 15.5 pH 7.85 8.60 6.30 8.00 8.28 8.85 7.63 8.12 7.1 8.31 8.66 7.08
728 A. Ka ra çu ha a nd M . E rs o y K a ra çu h a / T u rk . J . F is h. Aq ua t. S ci. 1 3 : 7 2 5 -7 3 6 (2 0 1 3 )
Table 2. List of species and their average seasonal biomass (gram dry weight m-2 with SD) at each station (S, summer; F, fall; Sp, spring; W, winter)
HAMSİLOS AKLİMAN DIŞLİMAN
Chlorophyta W Sp S F W Sp S F W Sp S F
Bryopsis plumosa (Hudson)
C.Agardh
- - - 0.36±0.09 - - - 0.14±0.04 0.86±0.47 - - -
Chaetomorpha spp. 0.02±0.01 1.66±0.068 0.15±0.06 0.02 0.34±0.13 0.48±0.12 - 0.26±0.07 - - - -
Cladophora spp. 9.92±4.42 13.28±4.04 31.87±6.84 1.48±0.40 12.32±5.63 1.09±0.14 25.11±3.43 33.97±6.00 - - 0.13±0.07 2.35±1.31
Enteromorpha linza var. crispata (Bertoloni) J.Agardh
- - - - 14.57±3.11 17.15±1.96 - - 14.18±0.85 55.66±11.22 26.46±6.91 -
Enteromorpha linza var. minor
Schiffner
- - 11.93±3.05 - 12.28±2.44 16.16±2.32 - - 14.30±1.23 40.38±17.25 23.43±12.23 -
Ulva intestinalis Linnaeus 3.34±0.92 4.59±0.45 26.07±6.34 - 33.99±5.75 42.55±4.63 - - 45.53±7.20 125.76±14.98 90.61±25.18 9.72±1.63
Ulva lactuca Linnaeus - - - 25.46±15.59 60.02±11.62 0.78±0.45
Ulva linza Linnaeus - - - - 6.22±0.85 - - - 16.03±3.28 17.24±5.57 6.21±1.92 -
Ulva rigidaC.Agardh - - 13.66±3.88 - - 1.55±0.62 - - 42.02±7.69 23.39±14.32 61.45±10.28 23.3±7.37
Heterokontophyta (only Phaeophyceae) Cladostephus spongiosus (Hudson) C.Agardh - 18.22±0.94 3.97±1.24 0.83±0.40 0.05±0.02 10.89±4.06 4.15±1.65 - - - - - Cystoseira barbata (Stackhouse) C.Agardh - - - - 313.31±10.32 305.60±22.88 277.84±20.37 216.08±44.16 - - - -
Cystoseira crinita Duby 583.72±15.59 697.74±42.09 511.85±3.92 515.18±57.91 - - - -
Dictyota implexa (Desfontaines) J.V.Lamouroux - - - 1.19±0.29 - - 0.30 - - - - - Ectocarpus siliculosus (Dillwyn) Lyngbye - 0.29±0.13 - - 1.18±0.29 - - - 0.01±0.01 - - -
Padina pavonica (Linnaeus)
Thivy
- - 5.28±2.28 - 0.00 7.73±3.07 83.69±7.80 41.43±13.80 - - - -
Scytosiphon lomentaria
(Lyngbye) Link
30.15±11.61 37.88±14.76 - - 15.52±4.11 6.96±2.77 - - - -
Stilophora tenella (Esper)
P.C.Silva - - - - Rhodophyta Callithamnion corymbosum (Smith) Lyngbye - - 0.08±0.04 - 0.17±0.07 0.14±0.06 - - - 0.18±0.09 Ceramium spp. 27.03±7.01 15.36±4.62 3.71±1.33 5.08±1.00 21.50±9.80 20.20±6.43 7.40±1.96 19.18±0.48 5.88±2.99 1.08±0.57 9.89±5.17 47.64±14.12
Palisada perforata (Bory de
Saint-Vincent) K.W.Nam
- - - 23.47±9.32 - - - -
Corallina panizzoi R.Schnetter
& U.Richter
26.90±12.41 40.84±4.25 19.43±5.23 26.57±2.16 - 0.27±0.11 - 0.33±0.17 - - - -
Gelidium crinale (Hare ex
Turner) Gaillon
4.20±1.69 - 3.08±0.95 0.53±0.09 - - 0.21±0.06 0.11±0.04 - - 1.60±0.84 1.75±0.52
Gracilaria gracilis (Stackhouse) M.Steentoft.
L.M.Irvine & W.F.Farnham
- 3.02±1.35 - - - 16.33±6.49 - - - -
Hypnea musciformis (Wulfen)
J.V.Lamouroux
- 0.25±0.11 - - - 3.22±1.28 - - - -
Jania rubens (Linnaeus)
J.V.Lamouroux
0.34±0.16 25.68±4.39 15.10±5.14 15.47±1.89 - - - -
Laurencia obtusa (Hudson)
J.V.Lamouroux 27.46±13.15 9.08±2.19 3.27±1.34 1.05±0.26 0.59±0.27 12.68±4.35 12.19±2.78 0.07±0.03 - - - - Osmundea pinnatifida (Hudson) Stackhouse - - - 3.96±1.57 - - - - - Polysiphonia spp. 2.22±0.72 5.84±0.18 2.90±0.35 1.56±0.14 10.26±2.03 12.28±2.80 8.81±1.76 0.44±0.02 - - 0.33±0.17 -
A. Ka ra çu h a a n d M . Ers o y K a ra çu h a / Tu rk . J . Fi sh . Aq u at. Sc i. 13 : 7 2 5 -7 3 6 (2 0 1 3 ) 729 Table 2. Continued
HAMSİLOS AKLİMAN DIŞLİMAN
Chlorophyta W Sp S F W Sp S F W Sp S F
Pyropia leucosticta (Thuret) Neefus & J.Brodie 0.22±0.10 - - - 18.14±4.13 - - 0.01±0.01 Pterocladiella capillacea (S.G.Gmelin) Santelices & Hommersand 11.82±2.43 6.97±1.21 6.75±0.21 2.04±0.16 - 0.23±0.09 0.75±0.21 0.17±0.02 4.71±1.31 1.19±0.24 3.74±1.95 0.53±0.31 ÖZTÜRKLER KARAKUM Chlorophyta W Sp S F W Sp S F
Bryopsis plumosa (Hudson) C.Agardh - - - 0.14±0.03
Chaetomorpha spp. - - - 0.02±0.01 - 0.17±0.06 - 0.04±0.01
Cladophora spp. 5.66±2.40 16.65±6.65 4.38±1.29 1.35±0.24 0.41±0.09 3.01±0.78 14.48±1.89 1.01±0.13
Enteromorpha linza var. crispata (Bertoloni) J.Agardh 29.66±8.25 37.14±9.13 38.47±10.08 - - - - -
Enteromorpha linza var. minor Schiffner 4.54±1.27 5.02±1.22 48.70±12.74 14.03±8.10 - - - -
Ulva intestinalis Linnaeus 46.59±8.36 51.17±14.25 91.67±23.95 28.50±10.43 3.69±0.72 3.43±0.52 21.18±9.8 2.90±0.64
Ulva lactuca Linnaeus - 4.08±1.96 48.36±12.94 - - - - -
Ulva linza Linnaeus 7.44±1.28 24.40±5.07 7.16±1.90 - - - 2.73±1.327 -
Ulva rigida C.Agardh 9.80±3.76 42.79±5.94 61.44±16.39 3.67±0.20 1.78±0.5 0.86±0.19 5.83±1.49 -
Heterokontophyta (only Phaeophyceae)
Cladostephus spongiosus (Hudson) C.Agardh - 0.15±0.07 - - - 1.55±0.33 2.76±1.28 0.25±0.08
Cystoseira barbata (Stackhouse) C.Agardh - - - -
Cystoseira crinita Duby - - - - 247.29±45.75 442.46±9.20 410.63±43.45 445.34±23.88
Dictyota implexa (Desfontaines) J.V.Lamouroux - - - -
Ectocarpus siliculosus (Dillwyn) Lyngbye - - - - 0.29±0.13 0.45±0.17 - -
Padina pavonica (Linnaeus) Thivy - - - -
Scytosiphon lomentaria (Lyngbye) Link - - - - 16.16±6.99 9.24±3.88 - -
Stilophora tenella (Esper) P.C.Silva 0.04±0.02 - - - -
Rhodophyta
Callithamnion corymbosum(Smith) Lyngbye - 0.03±0.01 - - 2.11±0.73 1.87±0.24 1.32±0.61 0.01±0.01
Ceramium spp. 0.92±0.32 31.13±3.05 0.18±0.09 5.24±1.98 10.40±3.01 20.81±4.43 1.47±0.07 3.92±0.96
Palisada perforata (Bory de Saint-Vincent) K.W.Nam - - - -
Corallina panizzoi R.Schnetter & U.Richter 11.07±5.18 0.07±0.03 1.55±0.81 - 8.43±3.38 23.72±5.26 5.58±1.48 10.39±2.58
Gelidium crinale (Hare ex Turner) Gaillon 6.41±1.88 - 53.93±28.16 62.43±13.61 11.83±1.62 3.13±1.32 33.75±7.83 45.52±3.54
Gracilaria gracilis (Stackhouse) M.Steentoft. L.M.Irvine &
W.F.Farnham
- - - -
Hypnea musciformis (Wulfen) J.V.Lamouroux - - - -
Jania rubens (Linnaeus) J.V.Lamouroux - - - - 8.26±2.11 10.33±3.24 0.71±0.33 0.81±0.32
Laurencia obtusa (Hudson) J.V.Lamouroux - - - - 3.53±1.21 3.33±0.60 0.74±0.32 0.17±0.02
Osmundea pinnatifida (Hudson) Stackhouse - - - 7.05±2.96 - -
Polysiphonia spp. 0.08±0.04 0.16±0.07 0.27±0.11 0.11±0.02 0.44±0.10 0.22±0.09 0.33±0.09 0.04±0.01
Pyropia leucosticta (Thuret) Neefus & J.Brodie 7.92±3.80 - - - 0.73±0.22 - - 0.01±0.01
Pterocladiella capillacea (S.G.Gmelin) Santelices &
Hommersand
730 A. Karaçuha and M. Ersoy Karaçuha / Turk. J. Fish. Aquat. Sci. 13: 725-736 (2013)
stations thougout the year (Figure 3). On the other hand, the total biomass of Heterokontophyta reached its maximum value of 7218.94 g dry weight m-2 in Hamsilos station, followed by Karakum and Akliman. However, the maximum total biomass of Chlorophyta was calculated in Dışliman (2175.96 g dry weight m -2), then Öztürkler (1898.08 g dry weight m-2), all the year round (Figure 4). On the contrary, the minimum biomass values in taxa were taken from Rhodophyta. The maximum Rhodophyta biomass value of 941.5 g dry weight m-2 was obtained in Hamsilos and the lowest value of 290.01 g dry weight m-2 in Dışliman.
According to this study, the species composition showed obvious differences in time and space, the dominant taxa in the area was Chlorophyta. The genera Ulva had the highest number of taxa (four species) and was followed by Ceramium, Polysiphonia and Cladophora. The taxa belong to the genera Pterocladiella, Cladophora, Ulva, Callithamnion, Ceramium, Geldium and Polysiphonia had the widest distribution, being able to colonize all sampling stations. In contrast, some species were found only at spesific sites, for example, Stilophora tenella (Esper) P.C. Silva occured only at Öztürkler while Cystoseira barbata Stackhouse) C.Agardh, 1820 occured only at Akliman. In addition, Ulva lactuca Linneaus, 1753 occured only at Dışliman and Öztürkler, Osmundea pinnatifida (Hudson) Stackhouse, 1809 only at Akliman and Karakum, Jania rubens (Linnaeus) J.V.Lamouroux, 1816 and
Cystoseira crinita Duby, 1830 only at Hamsilos and Karakum, Gracilaria gracilis (Stackhouse) M.Steentoft, L.M.Irvine and W.F.Farnham, 1995, Hypnea musciformis (Wulfen) J.V.Lamouroux, 1813, Dictyota implexa (Desfontaines) J.V.Lamouroux, 1809, Padina pavonica (Linnaeus) Thivy, 1960 and Cystoseira crinita Duby, 1830 were found only at Hamsilos and Akliman (Table 2).
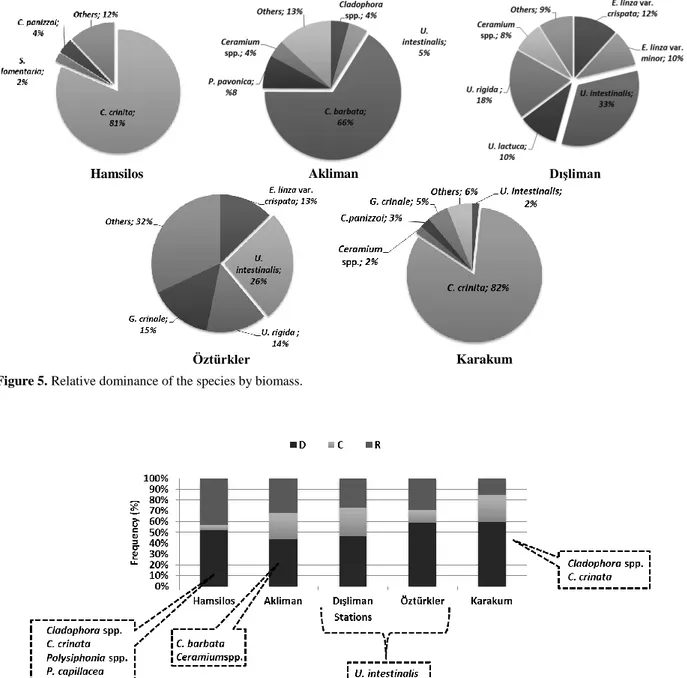
In addition, the biomass at each stations for each taxa showed differences (Figure 5). The dominant taxa in Hamsilos and Karakum was C. crinita (81% and 82% of total biomass, respectively) and in Akliman C. barbata (66%). On the other hand, in Dışliman and Öztürkler stations, the dominant taxa was Ulva intestinalis Linnaeus, 1753 (33% and 26%, respectively) (Figure 5).
According to Soyer’s frequency (F) index, only 12 were continuous (F≥50), 1 as common (F between 25 and 49) and 10 species as rare (F≤25) in Hamsilos station (Figure 6). However, at Dışliman only 7 were continious, 4 as common and 4 species as rare. In Hamsilos stations Cladophora spp., C. crinita, Polysiphonia spp. and Pterocladiella capillacea (S.G.Gmelin) Santelices and Hommersand, 1997; in Akliman station C. barbata and Ceramium spp. were the most continuous species. Cladophora spp. and C.crinita were the most continuous species in Karakum station. On the other hand, in Dışliman and Öztürkler stations, only U. intestinalis were found during all months (Figure 6).
Stations
Figure 2. The monthy variations of macroalgal biomass for each taxon according to the stations throughout the year.
Stations
A. Karaçuha and M. Ersoy Karaçuha / Turk. J. Fish. Aquat. Sci. 13: 725-736 (2013) 731
Figure 4. The total biomass (g dry weight m-2) of macroalgae taxa according to the station during a year.
Hamsilos Akliman Dışliman
Öztürkler Karakum Figure 5. Relative dominance of the species by biomass.
Figure 6. Frequency of macroalgae species according to the stations during the sampling period (D:dominance; C: common; R:
732 A. Karaçuha and M. Ersoy Karaçuha / Turk. J. Fish. Aquat. Sci. 13: 725-736 (2013)
Among the stations, the highest diversity and evenness were found at stations Dışliman and Öztürkler with a number of species (range: 3–10 and range: 6–12, respectively) (Figure 7). In these stations, the diversity and evenness values were always higher than station Hamsilos, Akliman and Karakum throughout the year.
Seasonal Variation
The seasonal abundance of estimated biomass was variable (Table 2 Figure 8a). In fact, the maximum average biomass value was determined in spring (484.20±116.44 g dry weight m-2), followed by summer with 445.40±64.63 g dry weight m-2 and winter with 358.80±107.15 g dry weight m-2, the lowest value was in fall (320.00±99.36 g dry weight
m-2). Generally, Heterokontophyta had the largest macroalgal biomass in all seasons, followed by Chlorophyta and then Rhodophyta (Figure 8b). The biomass of Heterokontophyta showed a maximum value of 1539.16±194.27 g dry weight m-2 in spring and the lowest value (1207,73±80,64 g dry weight m -2) in winter. The highest biomass of Chlorophyta was
obtained from summer (721.48±261.98 g dry weight m-2) and spring (575.11±115.8 g dry weight m-2).
In addition, the total seasonal abundance of average biomass at each station showed changes (Table 2, Figure 9). The station with the greatest seasonal biomass was Hamsilos with 881±134.35 g dry weight m-2 in spring and winter (727 ± 109.31 g dry weight m-2), followed by Karakum (537±21.77 g dry weight m-2) in spring, whereas Dışliman had the lowest value (86±19.97 g dry weight m-2) in winter.
Stations
Figure 7. The monthly fluctuations in the diversity and evenness index at each station (1: Hamsilos, 2: Akliman, 3: Dışliman,
4: Öztürkler, 5: Karakum).
(a) Seasons
(b)
Seasons
Figure 8. Seasonal variations of average biomass (g dry weight m-2) of macroalgal taxa (a) and the average biomass (g dry
A. Karaçuha and M. Ersoy Karaçuha / Turk. J. Fish. Aquat. Sci. 13: 725-736 (2013) 733
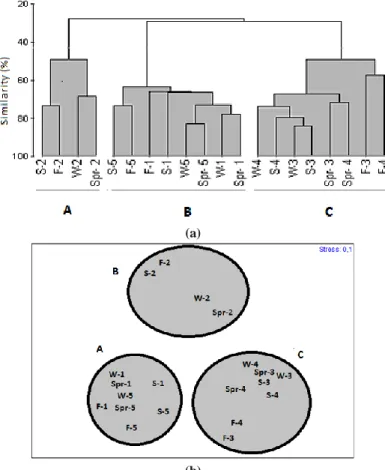
Based on Bray-Curtis similarity values, 3 groups of stations (A-C) can be described (Figure 10a). The assemblages identified were also separated in MDS analysis (Figure 10b). The stress value for the two-dimensional MDS plot was 0,15, indicating an appropriate group separation. The samples collected from the same station tended to join to each other, but group B joined only station Akliman. In contrast, group A involved the samples collected from the stations Hamsilos and Karakum.
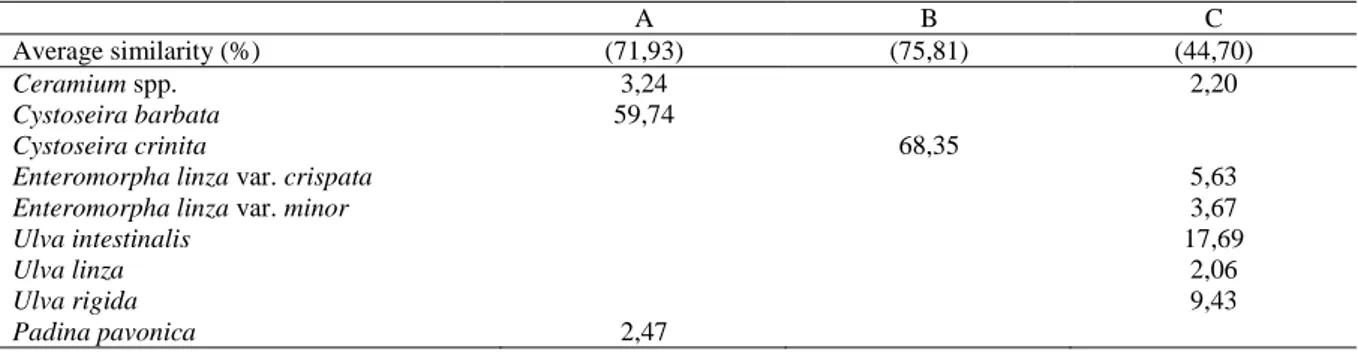
SIMPER demonstrated that the Heterokontophyta C. barbata, C. crinita and the Chlorophyta U. intestinalis were the most responsible
species for the similarity of group A, B and C, respectively (Table 3). Furthermore, the biomass values of the Ceramium spp., P. pavonica, Enteromorpha spp. and Ulva spp. affected more or less the association levels in all groups.
Discussion
In this study, the species composition showed obvious differences in time and space, and the species with the richest diversity found in this study was red algae. On the other hand, the genus Ulva had the highest number of taxa (four species) and was
Stations
Figure 9. Seasonal variations of biomass (g dry weight m-2) according the stations.
(a)
(b)
Figure 10. (a) Results of Cluster analysis, based on Bray-Curtis Similarity Index (macroalgal biomass) Scale bar, rescaled
distance cluster combine; (b) MDS distribution plot of samples from five stations, based on log-transformed biomass of species. (1, Hamsilos; 2, Akliman; 3, Dışliman; 4, Öztürkler; 5, Karakum; S, summer; F, fall; Spr, spring; W, winter ).
734 A. Karaçuha and M. Ersoy Karaçuha / Turk. J. Fish. Aquat. Sci. 13: 725-736 (2013)
followed by Ceramium, Polysiphonia and Cladophora. The taxa belonging to the genera Pterocladiella, Cladophora, Ulva, Callithamnion, Ceramium, Geldium and Polysiphonia had the widest distribution, being able to colonize all sampling stations. In contrast, some species were found only at spesific sites. For example, Stilophora tenella occured only at Öztürkler while Cystoseira barbata occured only at Akliman. In addition, Ulva lactuca occured only at Dışliman and Öztürkler, Osmundea pinnatifida only at Akliman and Karakum, Jania rubens and Cystoseira crinita only at Hamsilos and Karakum, Gracilaria gracilis, Hypnea musciformis, Dictyota implexa, Padina pavonica and Cystoseira crinita were found only at Hamsilos and Akliman.
The macroalgal highest biomass values were found in stations that are minimally affected by human activities. The two sites that had highest values were Hamsilos and Akliman. In contrast, the least values of biomass were found at Dışliman and Öztürkler in a station exposed to seawage pollution. In these stations, with areas marked by nutrients enrichment, the diversity and evenness values were always higher than others. This could be due to the influence of the abundance of tolerant species Ulva dominated in the stations. Also, there were less or more differences in these variables among the sampling periods, with winter period having generally lower and spring higher number of diversity and evenness values. On the other hand, the station with the greatest seasonal average biomass was Hamsilos with 881 g dry weight m-2, followed by Karakum (484,2 g dry weight m-2) in spring. There was an outstanding seasonal change in the macroalgal biomass peak that is associated with a change in the dominant species in the sampling stations Hamsilos and Karakum, macroalgal biomass was higher in spring. This can explain why the highest per cent values were recorded in both spring and summer compared to the low values recorded in winter The dominant taxa in Hamsilos and Karakum was C. crinita (81 and 82% of total biomass, respectively) during the seasons. The decrease in biomass detected in the communities in the winter months is probably related to the high wave action that occurs then. Plants are ripped from the rocks by erosion and the
combined accelerational and drag forces caused by wave action (Gaylord et al., 1994). On the other hand, it can also be a function of the autoecophysiology of the dominant species.
According to the results. the total biomass of 8043.20 g dry weight m-2 was estimated in the sampling stations. Generally. Heterokontophyta obtained the largest macroalgal biomass in all seasons. followed by Chlorophyta and then Rhodophyta. The brown algae biomass showed the maximum value with 1539.16±194.27 g dry weight m-2 in spring. This value decreased to 1300.05±149.65 g dry weight m-2 during summer (Figure 8). Heterokontophyta biomass showed the lowest value (1207.43±80.64 g dry weight m-2) in winter. Our investigation show that macroalgal species of green and brown algae have high values of biomass. with brown algae dominating during the research period. However. the green algae biomass values changed depending on summer and winter seasons. The decrease in biomass of the communities in winter months is probably related to the high wave action that occurs then. Plants are ripped from the rocks by erosion and the combined accelerational and drag forces caused by wave action (Gaylord et al.. 1994). On the other hand. it can also be a function of the dominant species.The highest biomass of Chlorophyta was obtained in summer (721.48±261.98 g dry weight m-2) and spring (575.11±115.80 g dry weight m-2). Slightly increasing abundance of macroalgae during spring and summer may be the result of greater light intensity, resulting in increased photosynthesis and growth of macroalgae (Lüning, 1990; Cheshire et al., 1996). In addition, nutrients which run off during the rainy season might influence growth and abundance of the macroalgae during the early part of the dry season (Petta, 1986). As has been shown in many studies, perennial macroalgae have a clear seasonality of growth and rest that is often triggered by the environmental factors photoperiod and temperature (Neto, 2000).
According to SIMPER analysis of contributions to similarities within seasons (all stations) C. barbata was the most responsible species for the similarity of the groups A formed by stations Hamsilos and Karakum, with C. crinita for the similarity of groups
Table 3. The species much contributing to similarity between the stations (as shown in Figure 6), according to Simper
analyses and percentage
A B C
Average similarity (%) (71,93) (75,81) (44,70)
Ceramium spp. 3,24 2,20
Cystoseira barbata 59,74
Cystoseira crinita 68,35
Enteromorpha linza var. crispata 5,63
Enteromorpha linza var. minor 3,67
Ulva intestinalis 17,69
Ulva linza 2,06
Ulva rigida 9,43
A. Karaçuha and M. Ersoy Karaçuha / Turk. J. Fish. Aquat. Sci. 13: 725-736 (2013) 735
B formed by station Akliman. Furthermore, the Chlorophyta U. intestinalis was the most responsible species for the similarity of group C formed by stations Dışliman and Öztürkler. However, it is clear that organic pollution acts as a physical stress in Ulva and Enteremorpha communities, changing their biomass and species composition. However, anthropogenic nutrient inputs into the Dışliman area of Sinop have increased rapidly in recent years with enhanced inputs of sewage effluent (Bat and Öztürk, 1997). According to Borum and Sand-Jensen (1996), nutrient availability for biological uptake is an important factor controlling algae species composition and biomass in shallow coastal waters, and various algae show different growth strategies, life forms and distribution along nutrient gradients. According to this study, the maximum biomass of Chlorophyta was calculated in Dışliman (2175.96 g dry weight m-2), followed by Öztürkler (1898.08 g dry weight m-2) and these were dominated by the opportunistic species Ulva rigida, U. intestinalis, Ceramium spp. and Enteromorpha linza var. crispata.
Finally, this study has revealed that, the biomass of macroalgae along Sinop shores varies depending on anthropogenic nutrient inputs. The Hamsilos and Karakum stations showed the highest values of biomass, while such values decreased in parallel to the increase of anthropogenic pressure. On the other hand, the increased antropogenic pollution in late spring and summer resulting from the increased population of Sinop was reflected in changes in the species composition of Ulva and Enteromorpha, and an increase in biomass and production. It has been shown that the macroalgae biomass and species number directly related to antropogenic affects.
References
Aysel, V., Erduğan, H., Dural-Tarakçı, B., Okudan, E.Ş., Şenkardeşler, A. and Aysel, F. 2004. Marine Flora of Sinop (Black Sea, Turkey).Ege Journal of Fisheries and Aquatic Sciences, 21: 59-68.
Bat, L. and Öztürk, M. 1997. Heavy Metal Levels in Some Organisms from the Sinop Peninsula of the Black Sea. Tr. J. of Engineering and Environmental Sciences, 21: 29-33.
Bat, L., Akbulut, M., Sezgin, M. and Çulha, M. 2001. Effects of Sewage Pollution the Structure of the Community of Ulva lactuca, Enteremorpha linza and Rocky Macrofauna in Dışliman of Sinop. Turk J Biol., 25: 93-102.
Bologa, A.S. and Sava, D. 2006. Progressive decline and present trend of Romanian Black Sea macroalgal flora. Cercetari marine. Recherches marines, INCDM Constantza, 36: 31– 60.
Borum, J. and Sand-Jensen, K. 1996. Is total primary production in shallow coastal marine waters stimulated by nitrogen loading? Oikos, 76: 406–410. Boudouresque, C.F. 1970. Recherches sur bionomie
analytique, structurale et expérimentale sur les peuplements benthiques sciaphiles en Méditerranée occidentale (fraction algale). MSc Thèse. Université
d’Aix- Marseille II.
Cacabelos, E., Olabarria, C., Incera, M., Troncoso, J.S., 2010. Effects of habitat structure and tidal height on epifaunal assemblages associated with macroalgae. Est Coat Shelf Sci., 89: 43–52.
Bray, J.R. and Curtis, J.T. 1957. An ordination of the upland forest communities of southern Wisconsin. Ecol. Monogr., 27: 325–349.
Cacabelos, E., Olabarria, C., Incera, M. and Troncoso, J.S. 2010. Effects of habitat structure and tidal height on epifaunal assemblages associated with macroalgae. Est. Coat Shelf. Sci., 89: 43–52.
doi: 10.1016/j.ecss.2010.05.012
Cheshire, A.C., Westphalen, G., Wenden, A., Scriven, L.J. and Rowland, B.C. 1996. Photosynthesis and respiration of phaeophycean-dominated macroalgal communities in summer and winter. Aquat. Bot., 55: 159–70.
Duarte, C.M. 1995. Submerged aquatic vagetation in relation to different nutrient regimes. Ophelia, 41: 87-112. doi: 10.1080/00785236.1995.10422039
Gallardo, T., Gomez Garreta, A., Ribera, M. A., Cormaci, M., Furnari, G., Giaccone, G. and Boudouresque, Ch. F. 1993. Check-list of Mediterranean Seaweeds. II. Chlorophyceae Wille I. Bot. Mar., 36: 399-421. Gaylord, B., Blanchette, C.A. and Denny, M.W. 1994.
Mechanical consequences of size in wave-swept algae. Ecological Monographs, 64: 287–313.
Gökkurt Baki, O. 2011. Coastal Zone Management Centre in the Sinop Province. Institute of Science, MSc Thesis, Samsun: Ondokuz Mayıs University, Juanes, J.A., Guinda, X., Puente, A. and Revilla, J.A. 2008.
Macroalgae, a suitable indicator of the ecological status of coastal rocky communities in the NE Atlantic. Ecological Indicators, 8: 351-359.
doi: 10.1016/j.ecolind.2007.04.005
Karaçuha, A. and Gönülol, A. 2007. Algae flora in the upper infralittoral zone of Sinop and Ayancik coastline. Journal of FisheriesSciences.com. 1: 1-12. doi: 10.3153/jfscom.2007001
Kostenko, N.S. 1990. Anthropogeneous changes in bottom algae of the Karadag reserve. Biological Sciences, 9: 101-110.
Lorentsen, S.H., Gremillet, D. and Nymoen, G.H. 2004. Annual variation in diet of breeding Great Cormorants:Does it reflect varying recruitment of Gadoids? Waterbirds, 27:161-169. doi: 10.1675/1524-4695(2004)027[0161:AVIDOB]2.0.CO;2
Lüning, K. 1990. Seaweeds. Their environment, biogeography and ecophysiology. John Wiley and Sons Inc., New York, 527 pp.
Madsen, J.D., Chambers, P.A., James, W.F., Koch, E.W. and Westlake, D.F. 2001. The interaction between water movement, sediment dynamics and submerged macrophytes. Hydrobiology, 444: 71-84.
doi: 10.1023/A:1017520800568
Mohammed, A.I. and Fredriksen, S. 2004. Production, respiration and exudation of dissolved organic matter by the kelp Laminaria hyperborea along the west coast of Norway. Journal of the Marine Biological Association of the U.K., 84: 887-894.
doi: 10.1017/S002531540401015Xh
Neto, A.I. 2000. Ecology and dynamics of two intertidal algal communities on the litoral of the island of Sa˜o Miguel (Azores). Hydrobiologia, 432: 135–147. Oskolskaya, O.I., Toskaya, A.V. and Tımofeev, V.A. 2001.
736 A. Karaçuha and M. Ersoy Karaçuha / Turk. J. Fish. Aquat. Sci. 13: 725-736 (2013)
destructive processes. Mediterranean Marine Science, 2: 37-43. doi: 10.12681/mms.274
Petta, N. 1986. Taxonomic Study of the seaweeds at Koh Samui, Surat Thani Province. MSc thesis, Bangkok: Kasetsart University (In Thai)
Pielou, E.C. 1975. Ecological diversity. Wiley-InterScience Publ., London.
Ribera, M.A., Gomez Garreta, A., Gallardo, T., Cormaci, M., Furnari, G. and Giaccone, G. 1992. Check-list of Mediterranean Seaweeds. I. Fucophyceae (Warming 1884). Bot. Mar., 36: 109-130.
Sava, D,. Doroftei, E. and Arcuş, M. 2011. Ecology and distribution of macrophytic red algae from the Romanian Black Sea coast. Botanica Serbica, 35: 37-41.
Sava, D. and Bologa, A. 2010. The Romanian Black sea macroalgae under current environmental quality of coastal waters. Rapp. Comm. int. Mer Médit., 39:736.
Sava, D., Arcuş, M., Doroftei, E., Buruşuricu, F. and Balaban, D.P. 2003. The latest data on the qualitative structure of macrophytobenthos from the Romanian Black Sea Shore - 4-th International Conference of PH students, Miskolc, Hungary: 365-370.
Shaffer, S. 2003. Preferential use of Nearshore Kelp Habitats by Juvenile Salmon and Forage Fish. Proceedings of the Georgia Basin/Puget Sound Research Conference.
Shannon, C.E. and Weaver, V. 1949. A mathematical theory of communication, Univ. Press. Illinois, Urbana. Silva, P.C., Basson, P.W. and Moe, R.L. 1996. Catalogue of
the Benthic Marine Algae of the Indian Ocean, California, 1259 pp.
Zhuang, S.H. and Zhang, M. 2001. Biodiversity investigation. II. The biodiversity in intertidals of Yantai littoral regions. Shandong Map Publisher, Jinan.