Address for correspondence: Dr. Akif Serhat Balcıoğlu, Başkent Üniversitesi Alanya Uygulama ve Araştırma Merkezi, Kardiyoloji Anabilim Dalı, Saray Mh., Yunus Emre Cd. No: 1, 07400, Alanya, Antalya-Türkiye
Phone: +90 242 510 25 25 Mobile: +90 532 628 46 97 Fax: +90 242 511 55 63 E-mail: [email protected] Accepted Date: 09.11.2015 Available Online Date: 23.03.2016
©Copyright 2016 by Turkish Society of Cardiology - Available online at www.anatoljcardiol.com DOI:10.14744/AnatolJCardiol.2015.6654
Akif Serhat Balcıoğlu, Sinan Akıncı, Davran Çiçek, Ali Çoner, Uğur Abbas Bal
1, İbrahim Haldun Müderrisoğlu
1Department of Cardiology, Medical and Research Center of Alanya, Başkent University; Alanya, Antalya-Turkey
1Department of Cardiology, Faculty of Medicine, Başkent University; Ankara-Turkey
Cardiac autonomic nervous dysfunction detected by both heart rate
variability and heart rate turbulence in prediabetic patients with
isolated impaired fasting glucose
Introduction
Cardiac autonomic nervous dysfunction (CAND) is a frequent chronic complication of diabetes with potentially life-threaten-ing effects such as silent myocardial ischemia and infarction, arrhythmia, sudden death, perioperative cardiovascular instabil-ity, orthostatic hypotension, and cardiomyopathy (1–3). CAND is caused by the impairment of the autonomic nerve fibers regulating heart rate, myocardial contractility, cardiac elec-trophysiology, and blood vessel constriction and dilatation (2). Hyperglycemia is the leading cause of this pathogenic process (4, 5). Because the clinical signs associated with CAND do not generally occur until late in the disease process and reversal of
cardiovascular denervation is thought to be possible in the early stages of the disease (1, 3), screening tests are useful for the early detection of CAND.
Prediabetes is a continuum between normoglycemia and dia-betes mellitus consisting of impaired fasting glucose (IFG) and/ or impaired glucose tolerance (IGT) and indicates an increased risk for cardiovascular diseases and the future development of type 2 diabetes mellitus (T2DM) (6). While patients with IFG and IGT both suffer from insulin resistance and deficiencies in insu-lin secretion, the two conditions show some differences such as those in associated cardiovascular risk (7, 8). There is a strong correlation between cardiovascular events and IGT, whereas this relation is less clear in IFG (8). Studies investigating CAND
Objective: Cardiac autonomic nervous dysfunction (CAND), a severe complication of diabetes, has also been shown to affect prediabetic pa-tients. The role of isolated impaired fasting plasma glucose (IFG), a subtype of prediabetes, is not clear in the pathogenesis of CAND. The aim of this study was to examine the relationship between isolated IFG and cardiac autonomic function using heart rate variability (HRV) and heart rate turbulence (HRT) indices derived from 24-h Holter–electrocardiogram recordings.
Methods: This observational, prospective, cross-sectional study examined 400 consecutive subjects divided into three groups according to oral glucose tolerance test results: the control group [Group I, fasting plasma glucose (FPG) <100 mg/dL and normal glucose tolerance, n=193], the isolated IFG group (Group II, FPG ≥100 and <126 mg/dL, n=134), and the isolated impaired glucose tolerance (IGT), both IFG and IGT, or newly di-agnosed diabetes’ group (Group III, n=73). Patients with non-sinus rhythm, known diabetes mellitus, coronary artery disease, heart failure, severe valvular disease, or receiving medical therapy that may affect HRV and HRT indices were excluded. Time domain HRV parameters, turbulence onset (TO), turbulence slope (TS), and HRT category were examined. Chi-square, one-way analysis of variance, Kruskal–Wallis H, and Mann– Whitney U tests were used to compare variables where appropriate. The correlation between Holter data and FPG levels was analyzed using the Spearman’s test. Multiple linear regression analysis was performed to identify independent predictors of the HRV and HRT parameters. Results: Median (interquartile range 25–75) FPG levels in Groups I, II, and III were 89 (83/93) mg/dL, 109 (104/116) mg/dL, and 174 (150.5/197) mg/ dL, respectively. There were significant differences in HRV and HRT parameters between and among all groups. While HRV parameters and TS decreased from Group I to Group III, TO and HRT category gradually increased. Additionally, FPG level was significantly correlated with SDNN, r=–0.220; SDNN index, r=–0.192; SDANN, r=–0.207; RMSSD, r=–0.228; pNN50, r=–0.226; TO, r=0.354; and TS, r=–0.331 (all p<0.001).
Conclusion: CAND, as detected by both HRV and HRT, appear to be present in the isolated IFG subtype of prediabetes. (Anatol J Cardiol 2016; 16: 762-9)
Keywords: autonomic function, glucose, heart rate variability, prediabetes
A
BSTRACTand prediabetes show conflicting results, particularly in terms of the relation between CAND and isolated IFG. It has been report-ed that alterreport-ed cardiac autonomic function is present in both IGT and diabetic subjects but not in patients with IFG (9). However, in the KORA S4 survey, the prevalence of CAND increased not only in individuals with T2DM and IGT but also in a lesser degree in those with isolated IFG (10).
Heart rate variability (HRV) and heart rate turbulence (HRT) are dependable Holter–electrocardiogram (ECG) parameters that indicate cardiac autonomic function (11, 12). The most com-monly used methods for the diagnosis of CAND are based on HRV assessment (the physiological variation in the time interval between heartbeats) and enable the independent measurement of the parasympathetic and sympathetic components of the au-tonomic nervous system (11). Another technique for evaluating CAND is the HRT, a reliable index of baroreceptor sensitivity, referring to variations in the sinus rhythm cycle length follow-ing isolated premature ventricular beats (PVBs) (12). A decrease in HRV is the first finding of CAND (13). Similarly, HRT has been found to be disturbed in patients with CAND (14).
This is the first study in the literature that aims to examine whether there is a relation between isolated IFG and cardiac au-tonomic function using both HRV and HRT parameters.
Methods
This observational, prospective, cross-sectional study exam-ined 400 consecutive subjects who underwent an oral glucose tolerance test (OGTT) in the endocrinology outpatient department and were referred to the cardiology outpatient department for Holter–ECG assessments. The exclusion criteria were as follows: non-sinus rhythm, known T2DM, the use of any antidiabetic medi-cation, history of coronary artery disease defined as a stenosis of more than 50% in at least one epicardial coronary artery in a past coronary angiography, acute coronary syndrome or a previ-ous myocardial infarction, typical stable angina pectoris, cardio-myopathies, heart failure (left ventricular ejection fraction <50%), severe valvular disease, hyperthyroidism, hypothyroidism, ven-tricular tachycardia on Holter–ECG, and use of medicine, includ-ing beta blockers, non-dihydropyridine calcium channel blockers, or antiarrhythmic drugs that may affect HRV and HRT indices.
The study was approved by the Local Ethics Committee and was performed in accordance with the Helsinki Declaration. All subjects gave informed consent prior to enrollment.
A total of 481 individuals underwent a 24-h Holter recording to obtain HRV and HRT parameters between January 2013 and June 2014. Eighty-one subjects were excluded because of the absence of PVBs needed for HRT analysis on the Holter record-ing. A total of 400 subjects were enrolled in the study.
The study population was divided into three groups accord-ing to the results of the 75-g OGTT usaccord-ing American Diabetes As-sociation criteria (6). The control group (Group I) included 193 subjects with a fasting plasma glucose (FPG) of less than 100
mg/dL and normal glucose tolerance (a 2-h OGTT glucose level below 140 mg/dL). The isolated IFG group (Group II) included 134 patients with an FPG of 100–125 mg/dL and a 2-h OGTT glucose level below 140 mg/dL. Group III included 73 patients with either isolated IGT (FPG level below 100 mg/dL and a 2-h OGTT glu-cose level between 140 and 200 mg/dL), both IFG and IGT (FPG level between 100 and 125 mg/dL and a 2-h OGTT glucose level between 140 and 200 mg/dL), or newly diagnosed T2DM (a 2-h OGTT glucose level above 200 mg/dL).
Holter–ECG recordings were acquired using three-channel digital recorders (Cardioscan Premier Version 12, DM Systems Co., Ltd. Beijing, China). Recordings lasting more than 20 h and of suffi-cient quality for evaluation were analyzed. A physician completely blind to the study assessed the Holter–ECG records. Before analy-sis, data were manually reviewed to check all complexes marked as true PVBs. HRV parameters included the standard deviation of the normal-to-normal (NN) interval (SDNN), the standard deviation of the average NN interval (SDANN) calculated over 5-min periods, the mean of the 5-min standard deviation of the NN interval (SDNN index) calculated over 24 h, the square root of the mean squared differences of successive NN intervals (RMSSD), and the division of the number of interval differences of successive NN intervals of more than 50 ms by the total number of NN intervals (pNN50). All analysis were made according to the standards determined by the Task Force of the European Society of Cardiology and the North American Society of Pacing and Electrophysiology (11).
HRT is the fluctuation in the sinus rhythm cycle length fol-lowing isolated PVBs. After an initial acceleration, the sinus rate decelerates after a PVB. There are two components of HRT: tur-bulence onset (TO) and turtur-bulence slope (TS). A transient vagal inhibition triggers the mentioned initial acceleration in the heart rate as a reaction to the missed baroreflex afferent input due to hemodynamically ineffective ventricular contraction. The suc-cessive deceleration in heart rate is caused by a sympathetical-ly mediated overshoot of blood pressure through vagal recruit-ment (15). After manual review of the Holter–ECG recordings, TO and TS were calculated as stated by Bauer et al. (12). A negative value of TO signifies early sinus acceleration and is considered normal, while a TS value over 2.5 ms/R-R interval indicates nor-mal expected late deceleration (12). HRT values are generally classified into three categories: HRT category 0 indicating nor-mal TO and TS, HRT category 1 indicating an abnornor-mal TO or TS, and HRT category 2 indicating abnormal TO and TS (12).
Statistics
Data analysis was performed using the Statistical Package for the Social Sciences (SPSS) for Windows, version 11.5 (SPSS Inc., Chicago, IL, United States). The Kolmogorov–Smirnov test was used to determine whether continuous variable distribu-tions were normal. Categorical variables were presented as the number of cases plus percentage and continuous variables as mean±standard deviation (SD) or median and 25/75% inter-quartile ranges, where applicable. The chi-square test was used
for inter-group comparisons. Continuous variables were com-pared between Groups I, II, and III using the one-way analysis of variance (ANOVA) or Kruskal–Wallis H tests as appropriate. The Mann–Whitney U test was used to compare continuous variables in terms of hypertension, gender, and smoking status. The correlation between Holter findings and FPG was analyzed using the Spearman’s test. Multiple linear regression analysis was used to determine the predictor(s) with the greatest effect on the HRV and HRT parameters after adjustment for all pos-sible confounding factors. Variables with a p value of <0.10 in the univariable test as well as all variables of known clinical impor-tance were accepted as a candidate for the multivariable model. Standardized coefficient of regression and levels of significance for each independent variable were also calculated. Logarithmic transformation was used for SDNN, SDNN index, SDANN, RMS-SD, pNN50, TO, and TS in regression analysis as data were not normally distributed. All tests of significance were two-tailed. Statistical significance was defined as p<0.05.
Results
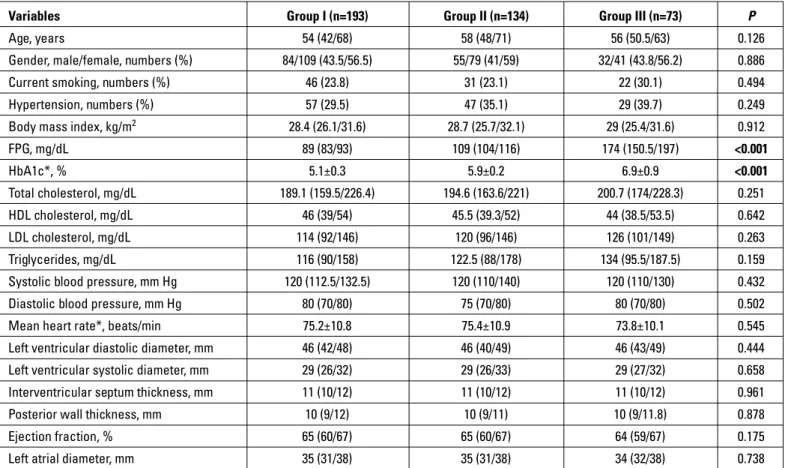
Baseline characteristics and clinical, laboratory, and echo-cardiographic fi ndings are presented in Table 1. Although the ratio of patients with hypertension was higher in Groups II and
III, this difference was not significant. As expected, median FPG levels were significantly higher in Groups II and III than in the control group and higher in Group III than in Group II (p<0.001, p<0.001, and p<0.001, respectively).
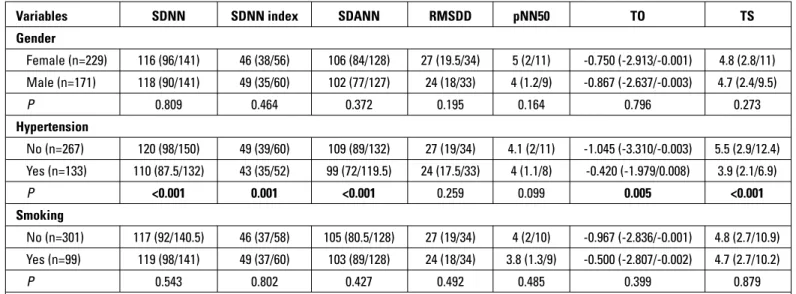
Holter data are given in Table 2. The duration of Holter–ECG recordings and mean R-R intervals were similar in all groups. HRV and HRT parameters were significantly different between Groups I and II (SDNN: p=0.013, SDNN index: p=0.018, SDANN: p=0.032, RMSSD: p=0.012, pNN50: p=0.005, TO: p<0.001, TS: p<0.001); Groups I and III (SDNN: p<0.001, SDNN index: p<0.001, SDANN: p<0.001, RMSSD: p<0.001, pNN50: p<0.001, TO: p<0.001, TS: p<0.001); Groups II and III (SDNN: p=0.017, SDNN index: p=0.032, SDANN: p=0.010, RMSSD: p=0.005, pNN50: p=0.018, TO: p<0.001, TS: p=0.001); and among all groups (Table 2). SDNN, SDNN index, SDANN, RMSSD, pNN50, and TS gradually de-creased from Group I to Group III, while TO and HRT category increased (Table 2). HRV and HRT measurements according to gender, hypertension, and smoking status are presented in Table 3. SDNN (p<0.001), SDNN index (p=0.001), SDANN (p<0.001), TO (p=0.005), and TS (p<0.001) were significantly different in pa-tients with hypertension.
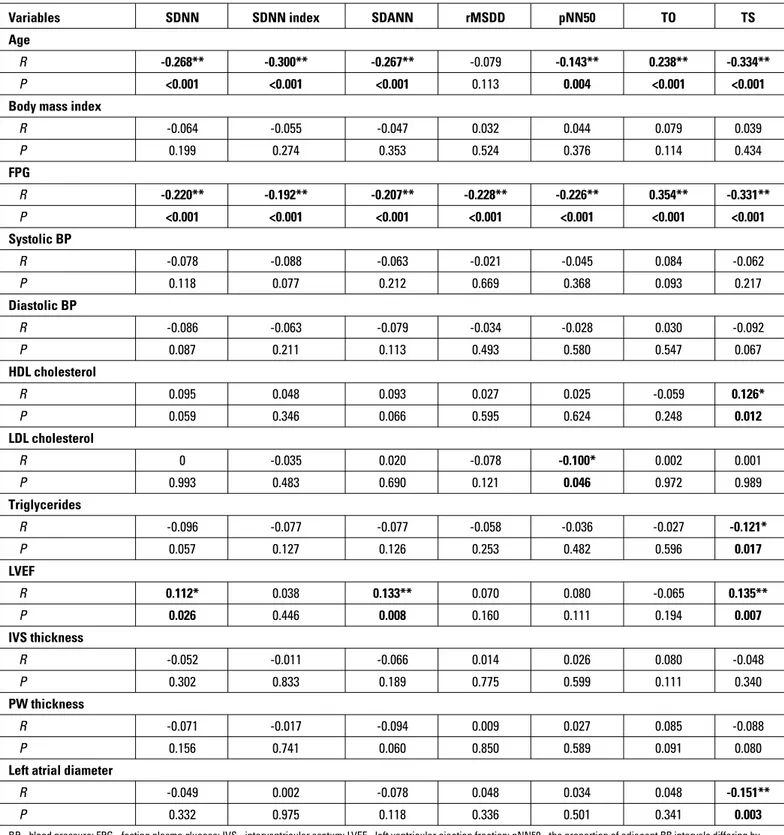
Correlation analyses revealed that FPG was significantly as-sociated with SDNN (r=–0.220, p<0.001), SDNN index (r=–0.192, p<0.001), SDANN (r=–0.207, p<0.001), RMSSD (r=–0.228, p<0.001),
Table 1. Baseline characteristics and echocardiographic and laboratory findings
Variables Group I (n=193) Group II (n=134) Group III (n=73) P
Age, years 54 (42/68) 58 (48/71) 56 (50.5/63) 0.126
Gender, male/female, numbers (%) 84/109 (43.5/56.5) 55/79 (41/59) 32/41 (43.8/56.2) 0.886
Current smoking, numbers (%) 46 (23.8) 31 (23.1) 22 (30.1) 0.494
Hypertension, numbers (%) 57 (29.5) 47 (35.1) 29 (39.7) 0.249
Body mass index, kg/m2 28.4 (26.1/31.6) 28.7 (25.7/32.1) 29 (25.4/31.6) 0.912
FPG, mg/dL 89 (83/93) 109 (104/116) 174 (150.5/197) <0.001 HbA1c*, % 5.1±0.3 5.9±0.2 6.9±0.9 <0.001 Total cholesterol, mg/dL 189.1 (159.5/226.4) 194.6 (163.6/221) 200.7 (174/228.3) 0.251 HDL cholesterol, mg/dL 46 (39/54) 45.5 (39.3/52) 44 (38.5/53.5) 0.642 LDL cholesterol, mg/dL 114 (92/146) 120 (96/146) 126 (101/149) 0.263 Triglycerides, mg/dL 116 (90/158) 122.5 (88/178) 134 (95.5/187.5) 0.159
Systolic blood pressure, mm Hg 120 (112.5/132.5) 120 (110/140) 120 (110/130) 0.432
Diastolic blood pressure, mm Hg 80 (70/80) 75 (70/80) 80 (70/80) 0.502
Mean heart rate*, beats/min 75.2±10.8 75.4±10.9 73.8±10.1 0.545
Left ventricular diastolic diameter, mm 46 (42/48) 46 (40/49) 46 (43/49) 0.444
Left ventricular systolic diameter, mm 29 (26/32) 29 (26/33) 29 (27/32) 0.658
Interventricular septum thickness, mm 11 (10/12) 11 (10/12) 11 (10/12) 0.961
Posterior wall thickness, mm 10 (9/12) 10 (9/11) 10 (9/11.8) 0.878
Ejection fraction, % 65 (60/67) 65 (60/67) 64 (59/67) 0.175
Left atrial diameter, mm 35 (31/38) 35 (31/38) 34 (32/38) 0.738
Group I - subjects with FPG <100 mg/dL and normal glucose tolerance test; Group II - patients with isolated IFG; Group III - patients with isolated IGT/both IFG and IGT/newly diagnosed T2DM; FPG - fasting plasma glucose; IFG - impaired fasting glucose; IGT - impaired glucose tolerance. Data presented as median (25/75% interquartile range). *Data presented as mean±standard deviation. Kruskal–Wallis or one-way ANOVA test was used for continuous variables. Chi-square test was performed for the comparison of categorical variables
pNN50 (r=–0.226, p<0.001), TO (r=0.354, p<0.001), and TS (r=–0.331, p<0.001). TO had the strongest power among all HRV and HRT pa-rameters regarding correlation with FPG level (Table 4).
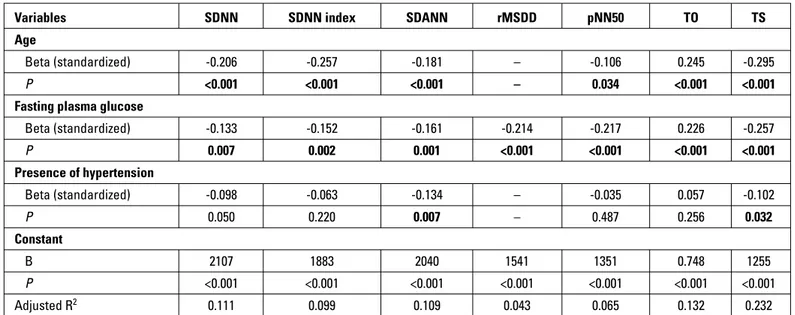
Multiple linear regression analysis was performed to determine the independent predictors of HRV and HRT measures. Age had an independent relation with SDNN, SDNN index, SDANN, TO, and TS. The presence of hypertension was another independent predictor
of SDANN and TS. In addition, FPG level was an independent deter-minant of all examined HRV and HRT parameters (Table 5).
Discussion
According to our knowledge, this is the first study in the lit-erature investigating the relation between HRT and
prediabe-Table 2. Comparison of 24-h Holter electrocardiographic findings, heart rate variability, and heart rate turbulence parameters
Variables Group I Group II Group III P
Recording time, h 23.1 (22.5/23.6) 23.3 (22.6/23.7) 23.1 (22.6/23.5) 0.128
Mean RR interval, ms 797.9 (722.6/908.6) 799.6 (731.3/872.3) 779.1 (728.4/874.1) 0.649 Heart rate variability parameters
SDNN, ms 125 (100.5/153) 117 (94.5/134.5) 102 (84/119) <0.001
SDNN index, ms 50 (41/62) 44 (36/58) 42 (33/51) <0.001
SDANN, ms 113 (89.5/137.5) 102.5 (83.8/123.5) 90 (72/109.5) <0.001
RMSSD, ms 29 (21/37) 24 (19/33) 22 (17/25) <0.001
pNN50, % 7 (2/12.5) 3.5 (1.8/9) 2 (1.1/4) <0.001
Heart rate turbulence parameters
Turbulence onset, % -1.879 (-3.843/-0.46) -0.610 (-2.033/0) -0.003 (-0.008/0.003) <0.001
Turbulence slope, ms/RR 7.8 (3.4/13) 4.3 (2.5/8.5) 3 (2.1/4.4) <0.001
Heart rate turbulence category
0, numbers (%) 141 (73.1) 81 (60.4) 39 (53.4)
1, numbers (%) 42 (21.8) 41 (30.6) 20 (27.4) 0.001
2, numbers (%) 10 (5.2) 12 (9) 14 (19.2)
Group I - subjects with FPG <100 mg/dL and normal glucose tolerance test; Group II - patients with isolated IFG; Group III - patients with isolated IGT/both IFG and IGT/newly diagnosed T2DM; IGT - impaired glucose tolerance; IFG - impaired fasting glucose; FPG - fasting plasma glucose; pNN50 - the proportion of adjacent RR intervals differing by >50 ms in the 24-h recording; RMSSD - the square root of the mean squared differences of successive normal-to-normal intervals; SDANN - the standard deviation of the average normal-to-normal intervals calculated over the 5-min period of the entire recording; SDNN - the standard deviation of all normal-to-normal intervals; SDNN index - the mean of the deviation of the 5-min normal-to-normal intervals over the entire recording. Data presented as median (25/75% interquartile range). The Kruskal–Wallis and chi-square tests were used
Table 3. Heart rate variability and heart rate turbulence measurements according to gender, hypertension, and smoking status
Variables SDNN SDNN index SDANN RMSDD pNN50 TO TS
Gender Female (n=229) 116 (96/141) 46 (38/56) 106 (84/128) 27 (19.5/34) 5 (2/11) -0.750 (-2.913/-0.001) 4.8 (2.8/11) Male (n=171) 118 (90/141) 49 (35/60) 102 (77/127) 24 (18/33) 4 (1.2/9) -0.867 (-2.637/-0.003) 4.7 (2.4/9.5) P 0.809 0.464 0.372 0.195 0.164 0.796 0.273 Hypertension No (n=267) 120 (98/150) 49 (39/60) 109 (89/132) 27 (19/34) 4.1 (2/11) -1.045 (-3.310/-0.003) 5.5 (2.9/12.4) Yes (n=133) 110 (87.5/132) 43 (35/52) 99 (72/119.5) 24 (17.5/33) 4 (1.1/8) -0.420 (-1.979/0.008) 3.9 (2.1/6.9) P <0.001 0.001 <0.001 0.259 0.099 0.005 <0.001 Smoking No (n=301) 117 (92/140.5) 46 (37/58) 105 (80.5/128) 27 (19/34) 4 (2/10) -0.967 (-2.836/-0.001) 4.8 (2.7/10.9) Yes (n=99) 119 (98/141) 49 (37/60) 103 (89/128) 24 (18/34) 3.8 (1.3/9) -0.500 (-2.807/-0.002) 4.7 (2.7/10.2) P 0.543 0.802 0.427 0.492 0.485 0.399 0.879
pNN50 - the proportion of adjacent RR intervals differing by >50 ms in the 24-h recording; rMSSD - the square root of the mean squared differences of successive normal-to-normal intervals; SDANN - the standard deviation of the average to-normal intervals calculated over 5-min period of the entire recording; SDNN - the standard deviation of all normal-to-normal intervals; SDNN index - the mean of the deviation of the 5-min normal-normal-to-normal intervals over the entire recording; TO - turbulence onset; TS - turbulence slope. Data presented as median (25/75% interquartile range). Analyzed using the Mann–Whitney U test
tes. In addition, our study clarifies the conflicting data regard-ing CAND and IFG. The principal findregard-ings of this study were as follows: 1) Patients with isolated IFG were likely to have CAND;
2) While time domain HRV parameters and TS decreased from Group I to Group III, TO and HRT category gradually increased; 3) FPG level was significantly correlated with time domain HRV
Table 4. Correlation coefficients and significance levels between both heart rate variability and also heart rate turbulence parameters with baseline characteristics, echocardiography, and laboratory measurements
Variables SDNN SDNN index SDANN rMSDD pNN50 TO TS
Age
R -0.268** -0.300** -0.267** -0.079 -0.143** 0.238** -0.334**
P <0.001 <0.001 <0.001 0.113 0.004 <0.001 <0.001
Body mass index
R -0.064 -0.055 -0.047 0.032 0.044 0.079 0.039 P 0.199 0.274 0.353 0.524 0.376 0.114 0.434 FPG R -0.220** -0.192** -0.207** -0.228** -0.226** 0.354** -0.331** P <0.001 <0.001 <0.001 <0.001 <0.001 <0.001 <0.001 Systolic BP R -0.078 -0.088 -0.063 -0.021 -0.045 0.084 -0.062 P 0.118 0.077 0.212 0.669 0.368 0.093 0.217 Diastolic BP R -0.086 -0.063 -0.079 -0.034 -0.028 0.030 -0.092 P 0.087 0.211 0.113 0.493 0.580 0.547 0.067 HDL cholesterol R 0.095 0.048 0.093 0.027 0.025 -0.059 0.126* P 0.059 0.346 0.066 0.595 0.624 0.248 0.012 LDL cholesterol R 0 -0.035 0.020 -0.078 -0.100* 0.002 0.001 P 0.993 0.483 0.690 0.121 0.046 0.972 0.989 Triglycerides R -0.096 -0.077 -0.077 -0.058 -0.036 -0.027 -0.121* P 0.057 0.127 0.126 0.253 0.482 0.596 0.017 LVEF R 0.112* 0.038 0.133** 0.070 0.080 -0.065 0.135** P 0.026 0.446 0.008 0.160 0.111 0.194 0.007 IVS thickness R -0.052 -0.011 -0.066 0.014 0.026 0.080 -0.048 P 0.302 0.833 0.189 0.775 0.599 0.111 0.340 PW thickness R -0.071 -0.017 -0.094 0.009 0.027 0.085 -0.088 P 0.156 0.741 0.060 0.850 0.589 0.091 0.080
Left atrial diameter
R -0.049 0.002 -0.078 0.048 0.034 0.048 -0.151**
P 0.332 0.975 0.118 0.336 0.501 0.341 0.003
BP - blood pressure; FPG - fasting plasma glucose; IVS - interventricular septum; LVEF - left ventricular ejection fraction; pNN50 - the proportion of adjacent RR intervals differing by >50 ms in the 24-h recording; R - coefficient of correlation; PW - posterior wall; rMSSD - the square root of the mean squared differences of successive normal-to-normal intervals; SDANN - the standard deviation of the average normal intervals calculated over the 5-min period of the entire recording; SDNN - the standard deviation of all normal-to-normal intervals; SDNN index - the mean of the deviation of the 5-min normal-to-normal-to-normal-to-normal intervals over the entire recording; TO - turbulence onset; TS - turbulence slope. Spearman’s test was used. *P<0.05; **P<0.01
parameters, TO, and TS; and 4) FPG and age were significant independent predictors of almost all impaired HRV and HRT parameters. Accordingly, altered sympathovagal function as re-vealed by impaired HRV and HRT was present in patients with isolated IFG and this influence was independently associated with the FPG level.
Prediabetes, a clinical condition standing on the continuum between a normal glycemic state and overt T2DM, is related with increased risk of the similar macrovascular and microvascular complications of overt diabetes (16). The overall prevalence of prediabetes was 36.5% among individuals older than 18 years in the National Health and Nutritional Examination Survey (17). Ac-cording to the Turkish Diabetes Epidemiology Study II, which in-cluded 26,499 adults aged ≥20 years (mean age 45.8±15.3 years), the prevalence of prediabetes was 30.8% in Turkey (isolated IFG: 14.7%, isolated IGT: 7.9%, both IFG and IGT: 8.2%) (18).
CAND is one of the most important microvascular compli-cations because of its association with significantly increased cardiovascular morbidity and mortality (19, 20). Clinical symp-toms generally occur late in the disease process (1). However, the first finding of CAND is a decrease in HRV, which is appar-ent even at the subclinical stage (21). SDNN represappar-ents both the sympathetic and parasympathetic modulation of HRV, RMSSD, and the pNN50 parasympathetic system (11). As with HRV, HRT has also been determined to be applicable in the diagnosis of CAND (12). Two components of HRT, TO and TS, are critically vagal dependent and reflect the status of the parasympathetic system (22).
Although the relation between CAND and IGT is well estab-lished in several studies (23–26), previous studies have shown
incompatible results with each other regarding the relation be-tween CAND and isolated IFG. The FPG levels were classified as normal (<110 mg/dL, n=1779), IFG (110–125 mg/dL, n=56), and T2DM (≥126 mg/dL or receiving antidiabetic therapy, n=84) in the Framingham Heart Study (27). Although their IFG subjects had higher FPG criterion than our subjects (110 mg/dL vs. 100 mg/ dL), SDNN and low-frequency and high-frequency power were inversely associated with plasma glucose levels and those pa-rameters were reduced in both the diabetic and the IFG groups. However, in the Framingham Heart Study, classification of pa-tients into normal glucose tolerance, IFG, and T2DM groups by solely FPG without OGTT may cause confusion because pa-tients with IFG may also have IGT or diabetes. Therefore, us-ing such a method, it is impossible to determine isolated IFG. Wu et al. (9) reported that altered cardiac autonomic function, as examined by SDNN, 30/15 ratio, and frequency-domain HRV parameters, was present in both IGT and diabetic subjects, but was not different in patients with isolated IFG from those with normal glucose tolerance. As in Wu’s report, the Atherosclero-sis Risk in Communities (ARIC) Study used a FPG level of <100 mg/dL as its IFG criterion and showed that there was no dif-ference in SDNN between those with IFG and normal glucose tolerance (28). However, similar to the Framingham Heart Study, the ARIC study could not examine the influence of IGT in IFG subjects. The current study may be considered more reliable because of our use of 2-h OGTT glucose levels for the deter-mination of true isolated IFG patients. Additionally, the differ-ence in results between the current study and that of Wu et al. (9) may be caused by glycemia differences between normal glucose tolerance and isolated IFG groups. While mean HbA1c
Table 5. The results of multiple linear regression analysis for determining the best predictors that affect heart rate variability and heart rate turbulence parameters
Variables SDNN SDNN index SDANN rMSDD pNN50 TO TS
Age
Beta (standardized) -0.206 -0.257 -0.181 – -0.106 0.245 -0.295
P <0.001 <0.001 <0.001 – 0.034 <0.001 <0.001
Fasting plasma glucose
Beta (standardized) -0.133 -0.152 -0.161 -0.214 -0.217 0.226 -0.257 P 0.007 0.002 0.001 <0.001 <0.001 <0.001 <0.001 Presence of hypertension Beta (standardized) -0.098 -0.063 -0.134 – -0.035 0.057 -0.102 P 0.050 0.220 0.007 – 0.487 0.256 0.032 Constant B 2107 1883 2040 1541 1351 0.748 1255 P <0.001 <0.001 <0.001 <0.001 <0.001 <0.001 <0.001 Adjusted R2 0.111 0.099 0.109 0.043 0.065 0.132 0.232
pNN50 - the proportion of adjacent RR intervals differing by >50 ms in the 24-h recording; rMSSD - the square root of the mean squared differences of successive normal-to-normal intervals; SDANN - the standard deviation of the average normal-to-normal intervals calculated over the 5-min period of the entire recording; SDNN - the standard deviation of all normal-to-normal intervals; SDNN index - the mean of the deviation of the 5-min normal-to-normal intervals over the entire recording; TO - turbulence onset; TS - turbulence slope. The independent predictors of SDNN, SDNN index, SDANN, rMSSD, pNN50, TO, and TS were identified by multiple linear regression analysis
values were quite close between the normal glucose tolerance and isolated IFG groups (4.9%±0.5% vs. 5.1%±0.5%) in Wu et al.’s study (9), they were 5.1%±0.3% vs. 5.9%±0.2% in our study. Therefore, the IFG subjects in Wu et al.’s (9) study may be less hyperglycemic compared with our isolated IFG patients, which could result in a similarity in HRV parameters between the nor-mal glucose tolerance and isolated IFG groups.
In the recent Kora S4 survey of 1202 participants (the num-ber of individuals with normal glucose tolerance, isolated IFG, isolated IGT, both IFG and IGT, and newly diagnosed T2DM was 565, 336, 72, 151, and 78, respectively), the prevalence of CAND increased in individuals with T2DM and IGT as well as in those with isolated IFG (10). Similarly, we observed that SDNN, SDNN index, SDANN, RMSSD, and pNN50 values were lower in the isolated IFG group than in the control group but higher than in the isolated IGT, both IFG and IGT, or newly diagnosed T2DM group. Different from the previous HRV studies, a novel finding of our study was the demonstration of the relation between disturbed HRT indices and prediabetes. We observed that TO and TS values and HRT category were impaired in patients with isolated IFG compared with the subjects with normal glucose tolerance, reflecting mainly parasympathetic CAND. In addition, correlation analysis revealed the continuous relation between FPG and HRV and HRT parameters. Our study also demonstrat-ed that FPG was an independent determinant of almost all HRV and HRT parameters.
Although only parasympathetic involvement is expected in the early stages of CAND (4), disturbance in all studied HRV and HRT parameters indicates the impairment of both parasympa-thetic and sympaparasympa-thetic limbs of the autonomic nervous system, even in an isolated IFG state. These findings support the fact that patients may have subclinical CAND that is more serious than is believed for several years before it becomes clinically apparent (29). Accordingly, because the progression of cardiovascular de-nervation is partly reversible or can be slowed down in the early stages of the disease (30), screening for CAND may be recom-mended for all prediabetic patients in addition to all newly diag-nosed T2DM patients. Assessment of CAND is possible through a variety of methods, such as cardiovascular autonomic reflex tests, HRV, and imaging modalities (3). The criteria for diagnosis and staging are published elsewhere (31).
Study limitations
The first limitation of this study was the absence of Ewing’s cardiovascular autonomic reflex tests, which are the gold stan-dard for the determination of CAND. However, studies compar-ing Holter-based HRV analysis and cardiovascular autonomic reflex tests found a high correlation between both techniques. Additionally, frequency domain methods were not performed for HRV analysis. However, many time- and frequency-domain variables obtained over the 24-h period were found to be highly correlated with each other.
Conclusion
Findings of this study revealed that HRT disturbance, consid-ered a sign of sympathovagal imbalance, is already present in the prediabetic stage. Our study also verified recent data regard-ing the existence of a relation between CAND and isolated IFG and demonstrated the independent relation between FPG and almost all HRV and HRT parameters. It seems important to be aware of CAND in all prediabetic patients, including those with isolated IFG. Because previous data suggests that the reversal of cardiovascular denervation may occur in the early stages of the disease; screening of all subgroups of prediabetic patients for CAND may be considered.
Conflict of interest: None declared. Peer-review: Externally peer-reviewed.
Authorship contributions: Concept – A.S.B., D.Ç., İ .H.M.; Design – S.A., A.S.B.; Supervision – D.Ç., İ.H.M.; Materials – A.S.B., A.Ç., S.A.; Data collection&/or processing – A.S.B., S.A., A.Ç.; Analysis and/or in-terpretation – S.A., U.A.B., A.S.B.; Literature search – A.Ç., U.A.B.; Writ-ing – A.S.B.; Critical review – A.S.B., S.A., D.Ç., A.Ç., U.A.B., İ.H.M.
References
1. Boulton AJ, Vinik AI, Arezzo JC, Bril V, Feldman EL, Freeman R, et al. Diabetic neuropathies: a statement by the American Diabetes Association. Diabetes Care 2005; 28: 956-62. Crossref
2. Vinik AI, Erbaş T. Diabetic autonomic neuropathy. Handb Clin Neu-rol 2013; 117: 279-94. Crossref
3. Balcıoğlu AS, Müderrisoğlu H. Diabetes and cardiac autonomic neuropathy: Clinical manifestations, cardiovascular consequenc-es, diagnosis and treatment. World J Diabetes 2015; 6: 80-91. 4. Pop-Busui R. Cardiac autonomic neuropathy in diabetes: a clinical
perspective. Diabetes Care 2010; 33: 434-41. Crossref
5. Vinik AI, Maser RE, Mitchell BD, Freeman R. Diabetic autonomic neuropathy. Diabetes Care 2003; 26: 1553-79. Crossref
6. American Diabetes Association. (2) Classification and diagnosis of diabetes. Diabetes Care 2015; 38 Suppl: S8-S16. Crossref
7. Petersen JL, McGuire DK. Impaired glucose tolerance and im-paired fasting glucose--a review of diagnosis, clinical implications and management. Diab Vasc Dis Res 2005; 2: 9-15. Crossref
8. Temelkova-Kurktschiev TS, Koehler C, Henkel E, Leonhardt W, Fuecker K, Hanefeld M. Postchallenge plasma glucose and glyce-mic spikes are more strongly associated with atherosclerosis than fasting glucose or HbA1c level. Diabetes Care 2000; 23: 1830-4. 9. Wu JS, Yang YC, Lin TS, Huang YH, Chen JJ, Lu FH, et al.
Epidemio-logical evidence of altered cardiac autonomic function in subjects with impaired glucose tolerance but not isolated impaired fasting glucose. J Clin Endocrinol Metab 2007; 92: 3885-9. Crossref
10. Ziegler D, Voss A, Rathmann W, Strom A, Perz S, Roden M, et al. In-creased prevalence of cardiac autonomic dysfunction at different degrees of glucose intolerance in the general population: the KORA S4 survey. Diabetologia 2015; 58: 1118-28. Crossref
11. Heart rate variability. Standards of measurement, physiological in-terpretation, and clinical use. Task Force of the European Society of Cardiology and the North American Society of Pacing and
Elec-trophysiology. Eur Heart J 1996; 17: 354-81. Crossref
12. Bauer A, Malik M, Schmidt G, Barthel P, Bonnemeier H, Cygankie-wicz I, et al. Heart rate turbulence: standards of measurement, physiological interpretation, and clinical use: International Society for Holter and Noninvasive Electrophysiology Consensus. J Am Coll Cardiol 2008; 52: 1353-65. Crossref
13. Ewing DJ, Campbell IW, Clarke BF. The natural history of diabetic autonomic neuropathy. Q J Med 1980; 49: 95-108.
14. Balcıoğlu S, Arslan U, Türkoğlu S, Özdemir M, Çengel A. Heart rate variability and heart rate turbulence in patients with type 2 diabetes mellitus with versus without cardiac autonomic neuropathy. Am J Cardiol 2007; 100: 890-3. Crossref
15. Guzik P, Schmidt G. A phenomenon of heart-rate turbulence, its evaluation, and prognostic value. Card Electrophysiol Rev 2002; 6: 256-61. Crossref
16. Souza CF, Gross JL, Gerchman F, Leitao CB. Prediabetes: diagnosis, evaluation of chronic complications, and treatment. Arq Bras En-docrinol Metabol 2012; 56: 275-84. Crossref
17. Bullard KM, Saydah SH, Imperatore G, Cowie CC, Gregg EW, Geiss LS, et al. Secular changes in U.S. Prediabetes prevalence defined by hemoglobin A1c and fasting plasma glucose: National Health and Nutrition Examination Surveys, 1999-2010. Diabetes Care 2013; 36: 2286-93. Crossref
18. Satman I, Ömer B, Tütüncü Y, Kalaca S, Gedik S, Dinçcağ N, et al. Twelve-year trends in the prevalence and risk factors of diabetes and prediabetes in Turkish adults. Eur J Epidemiol 2013; 28: 169-80. 19. Pop-Busui R, Evans GW, Gerstein HC, Fonseca V, Fleg JL, Hoogwerf
BJ, et al. Effects of cardiac autonomic dysfunction on mortality risk in the Action to Control Cardiovascular Risk in Diabetes (ACCORD) trial. Diabetes Care 2010; 33: 1578-84. Crossref
20. Young LH, Wackers FJ, Chyun DA, Davey JA, Barrett EJ, Taille-fer R, et al. Cardiac outcomes after screening for asymptomatic coronary artery disease in patients with type 2 diabetes: the DIAD study: a randomized controlled trial. JAMA 2009; 301: 1547-55. 21. Metelka R. Heart rate variability-current diagnosis of the
car-diac autonomic neuropathy. A review. Biomed Pap Med Fac Univ Palacky Olomouc Czech Repub 2014; 158: 327-38. Crossref
22. Lin LY, Lai LP, Lin JL, Du CC, Shau WY, Chan HL, et al. Tight mecha-nism correlation between heart rate turbulence and baroreflex sensitivity: sequential autonomic blockade analysis. J Cardiovasc Electrophysiol 2002; 13: 427-31. Crossref
23. Gerritsen J, Dekker JM, TenVoorde BJ, Bertelsmann FW, Kostense PJ, Stehouwer CD, et al. Glucose tolerance and other determinants of cardiovascular autonomic function: the Hoorn Study. Diabetolo-gia 2000; 43: 561-70. Crossref
24. Putz Z, Nemeth N, Istenes I, Martos T, Gandhi RA, Korei AE, et al. Autonomic dysfunction and circadian blood pressure variations in people with impaired glucose tolerance. Diabet Med 2013; 30: 358-62. Crossref
25. Putz Z, Tabak AG, Toth N, Istenes I, Nemeth N, Gandhi RA, et al. Noninvasive evaluation of neural impairment in subjects with im-paired glucose tolerance. Diabetes Care 2009; 32: 181-3. Crossref
26. Rezende KF, Melo A, Pousada J, Rezende ZF, Santos NL, Gomes I. Autonomic neuropathy in patients with impaired glucose toler-ance. Arq Neuropsiquiatr 1997; 55: 703-11. Crossref
27. Singh JP, Larson MG, O'Donnell CJ, Wilson PF, Tsuji H, Lloyd-Jones DM, et al. Association of hyperglycemia with reduced heart rate variability (The Framingham Heart Study). Am J Cardiol 2000; 86: 309-12. Crossref
28. Schroeder EB, Chambless LE, Liao D, Prineas RJ, Evans GW, Rosa-mond WD, et al. Diabetes, glucose, insulin, and heart rate variabil-ity: the Atherosclerosis Risk in Communities (ARIC) study. Diabetes Care 2005; 28: 668-74. Crossref
29. Dimitropoulos G, Tahrani AA, Stevens MJ. Cardiac autonomic neu-ropathy in patients with diabetes mellitus. World J Diabetes 2014; 5: 17-39. Crossref
30. Howorka K, Pumprla J, Haber P, Koller-Strametz J, Mondrzyk J, Schabmann A. Effects of physical training on heart rate variability in diabetic patients with various degrees of cardiovascular auto-nomic neuropathy. Cardiovasc Res 1997; 34: 206-14. Crossref
31. Spallone V, Ziegler D, Freeman R, Bernardi L, Frontoni S, Pop-Busui R, et al. Cardiovascular autonomic neuropathy in diabetes: clinical impact, assessment, diagnosis, and management. Diabetes Metab Res Rev 2011; 27: 639-53. Crossref