Concordance of PCR and Early Thorax Computed Tomography Findings in
COVID-19 Patients
COVID-19 Hastalarında Erken Dönemde Çekilen Akciğer Bilgisayarlı Tomografi Bulguları ile
PCR Testinin Uyumluluğu
Recep ALANLI1
0000-0003-4663-1898
Murat Bülent KÜÇÜKAY1
0000-0003-3657-6565
Okan ÇİÇEK2
0000-0002-8674-1138
Kadir Serkan YALÇIN1
0000-0002-8028-1070
Bülent Ahmet BEŞİRBELLİOĞLU3
0000-0003-2172-0616
ABSTRACT
Aim: The aim of this study was to investigate concordance between polymerase chain reaction
(PCR) test results and early thorax computed tomography (CT) findings of the patients in whom coronavirus disease 2019 (COVID-19) was suspected after evaluation of their complaints and physical examination findings.
Material and Methods: One hundred and fourteen patients with suspicion of COVID-19,
evaluated for severe acute respiratory syndrome coronavirus 2 (SARS-CoV-2) existence with PCR test and performed thorax CT in the first 48 hours, between April and July 2020, were enrolled in this study retrospectively. Demographic characteristics, laboratory parameters and thorax CT findings of PCR positive and negative patients were compared. If patients had negative PCR test results, but clinical suspicion for COVID-19 persisted, additional PCR samples were tested at 48-hour intervals.
Results: Interlobular septal thickening was more frequent in PCR positive patients (p=0.043).
There was no significant thorax CT finding in 16 (28.6%) PCR positive and 14 (24.1%) PCR negative patients. Bilateral, peripheral and multilobar ground glass opacifications, consolidation and interlobular septal thickening were the most frequent findings in both groups. Neutrophil (p<0.001) and platelet counts (p=0.038) were significantly lower in PCR positive group.
Conclusion: The thorax CT findings of the patients whose PCR tests were positive or negative
were greatly similar except for interlobular septal thickening, thus thorax CT should not be used alone in the diagnosis of COVID-19 especially in early stages. In decision making, symptoms, laboratory and CT findings and PCR tests of patients must be evaluated all together.
Keywords: COVID-19; ground glass opacity; interlobular septal thickening; thorax computed
tomography; polymerase chain reaction.
ÖZ
Amaç: Bu çalışmanın amacı yakınmaları ve fizik muayene bulgularının değerlendirilmesi
sonrasında koronavirüs hastalığı 2019 (coronavirus disease 2019, COVID-19) ön tanısı konulan hastaların erken dönemde çekilen akciğer bilgisayarlı tomografi (BT) bulguları ile polimeraz zincir reaksiyonu (polymerase chain reaction, PCR) testi sonuçları arasındaki uyumluluğun araştırılmasıdır.
Gereç ve Yöntemler: Nisan ile Temmuz 2020 tarihleri arasında COVID-19 şüphesi olan, PCR
testi ile şiddetli akut solunum yolu sendromu koronavirüsü 2 (severe acute respiratory syndrome coronavirus 2, SARS-CoV-2) varlığı açısından değerlendirilen ve ilk 48 saatte akciğer BT yapılan 114 hasta geriye dönük olarak bu çalışmaya alındı. PCR testi pozitif ve negatif olan hastaların demografik özellikleri, laboratuvar parametreleri ve akciğer BT bulguları karşılaştırıldı. PCR testi negatif saptanıp klinik şüphesi devam eden hastalarda 48 saatlik aralıklar ile yeni PCR örnekleri alındı.
Bulgular: PCR pozitif hastalarda interlobüler septal kalınlaşma daha fazla bulundu (p=0,043).
PCR pozitif olan 16 (%28,6) ve PCR negatif olan 14 (%24,1) hastada tomografide anlamlı bir bulgu saptanmadı. Her iki grupta da en sık bulgular; bilateral, periferal ve multilober yerleşimli buzlu cam görünümü, konsolidasyon ve interlobuler septal kalınlaşma idi. PCR pozitif olan grupta nötrofil (p<0,001) ve trombosit sayısı (p=0,038) anlamlı olarak daha düşük saptandı.
Sonuç: PCR testi pozitif veya negatif saptanan hastaların interlobular septal kalınlaşma
dışındaki akciğer BT bulguları oldukça benzer idi, dolayısıyla COVID-19 tanısında özellikle erken dönemlerde akciğer BT tek başına kullanılmamalıdır. Karar verme esnasında, hastaların semptom, laboratuvar ve BT bulguları ile PCR testi hep birlikte değerlendirilmelidir.
Anahtar kelimeler: COVID-19, buzlu cam görünümü; interlobüler septal kalınlaşma; akciğer
bilgisayarlı tomografi; polimeraz zincir reaksiyonu.
1Lokman Hekim University Faculty of
Medicine Ankara Hospital Department of Internal Medicine, Ankara, Turkey
2Ankara Training and Research
Hospital Department of Radiology, Ankara, Turkey
3Lokman Hekim University Faculty of
Medicine Ankara Hospital Department of Infectious Diseases, Ankara, Turkey
Corresponding Author Sorumlu Yazar
Recep ALANLI [email protected]
Received / Geliş Tarihi : 13.08.2020 Accepted / Kabul Tarihi : 26.10.2020 Available Online /
INTRODUCTION
Coronavirus disease 2019 (COVID-19) is now a global pandemic. Early diagnosis and isolation of infected people are important factors in controlling the spread of the disease (1). Diagnosis of COVID-19 depends on detection of viral ribonucleic acid (RNA) by real time reverse transcriptase polymerase chain reaction (rRT-PCR) test. Polymerase chain reaction (PCR) test requires special equipment and it cannot be performed in every health center, and a relatively long time is needed to get results. There are difficulties in proper sample gathering and transporting specimens to a test laboratory which may cause inaccurate results (2). Symptoms, signs and some laboratory findings in COVID-19 were reported to be associated with thorax computed tomography (CT) findings (3). Poor prognosis for disease may be predicted by thorax CT findings (4). However, many infectious and non-infectious diseases may cause similar findings in thorax CT, thus CT findings may be falsely regarded as positive results. A study reported specificity of thorax CT as low as 25.0% (5).
The most frequent laboratory findings in COVID-19 are lymphocytopenia, thrombocytopenia, elevations in hepatic transaminase levels and inflammatory markers (6). Lymphocyte counts are usually decreased, but neutrophil counts may be varying; some patients may have low and some may have high neutrophil counts (7).
The aim of this study was to evaluate concordance between PCR test results and early thorax CT findings in PCR positive and PCR negative patients.
MATERIAL AND METHODS
This study was conducted in the Lokman Hekim University Hospital as a single center study. Data of participants admitted between April and July 2020 were inspected retrospectively. A hundred and fourteen patients admitted to the hospital with complaints similar to those of COVID-19 patients such as high fever (>38.0 Celsius), sore throat, cough, dyspnea, headache, myalgia, loss of taste or smell senses were enrolled in the study. Severe acute respiratory syndrome coronavirus 2 (SARS-CoV-2) PCR tests were performed in patients who had at least two of these symptoms. Thorax CT was performed to the patients who had presence of newly developed infiltration on chest X-ray and/or new onset of cough and dyspnea and/or changes in breath sounds on physical examination. Patients who had thorax CT performed in the first 48 hours after hospitalization were enrolled in the study. The laboratory parameters and thorax CT findings of PCR positive and negative patients were compared. Patients below 18 years of age and patients in whom thorax CT images could not be examined or patients in whom CT was performed 48 hours after hospitalization were excluded. This study was approved by the Clinical Research Ethics Committee of Lokman Hekim University (27.05.2020, approval no: 2020/038). Informed written consent was obtained from all of the patients participated in the study. Demographic characteristics, accompanying diseases, laboratory findings and thorax CT images of the patients were inspected through hospital computer systems. Whole blood counts (lymphocyte, neutrophil, platelet), alanine aminotransferase (ALT), aspartat aminotransferase (AST), lactate dehydrogenase (LDH), C-reactive protein (CRP), ferritin, D-dimer, prothrombin time, troponin I levels,
creatinine, creatine kinase (CK), procalcitonin, and PCR test results were recorded. PCR samples were obtained at 48-hour intervals when previous tests were negative, but clinical suspicion for COVID-19 persisted. Patients in whom COVID-19 diagnosis was concluded after recurrent PCR analyses were also accepted as COVID-19 positive. Whole blood count tests were measured using the Sysmex XN-1000 analyzer (USA). ALT, AST, creatinine, LDH, CK, D-dimer, CRP tests were performed using the Roche Hitachi Cobas 501 analyzer (Switzerland). Ferritin, troponin I and procalcitonin tests were measured using the Roche Hitachi Cobas 601 analyzer (Switzerland). PT-INR tests were performed using the Tokra Novae analyzer (Turkey). Thorax tomography was performed by a Siemens Emotion 16 Scanner (Siemens Healthineers; Erlangen, Germany, 2010) using the following parameters: 110 kV, 258 mA, a slice thickness of 1.5 mm. All scans were performed without intravenous contrast with the patient in the supine position during end-inspiration. Tomography images were evaluated by a 13-year experienced radiologist. Ground glass opacifications, consolidation, unilateral/bilateral involvement, posterior and multilobar distribution, interlobular septal thickening, pleural thickening, bronchiectasis, pleural effusion, lymph node, cavity, halo sign, nodule and vascular thickness existence were inspected in tomography.
COVID-19 diagnosis was confirmed after the detection of specific viral RNA sequences in rRT-PCR by nucleic acid amplification test (NAAT).
Statistical Analysis
Data were analyzed by SPSS v.25.0 statistical package. Data distributions were evaluated by Shapiro-Wilk test. Data were presented as mean±standard deviation for normal distributed variables, as median, interquartile range, minimum-maximum for non-normal distributed variables. Comparisons between groups in normally distributed variables were done by independent samples t-test and Mann-Whitney U test for not normally distributed variables. Chi-square test was used for the comparison of qualitative data. Fisher's exact test was used when chi-square test cannot be used. A p value below 0.05 was considered significant.
RESULTS
The study was conducted with 114 patients. Fifty-six (49.1%) patients were male and 58 (50.9%) patients were female. The mean age of patients was 47.8±15.8 (45.3±15.0 for males, 50.1±16.0 for females) years. The mean ages of patients in the PCR positive group and PCR negative group were 45.8±16.2 and 49.6±15.4 years, respectively (p=0.205). In the PCR positive group, 27 (48.2%) patients were male, and 29 (51.8%) were female. In the PCR negative group, 29 (50.0%) patients were male, and 29 (50.0%) were female.
Accompanying diseases in PCR positive patients were as follows: hypertension in 13 (23.2%) patients, diabetes mellitus in 6 (10.7%) patients, coronary artery disease in 2 (3.6%) patients, malignancies in 2 (3.6%) patients and chronic pulmonary obstructive disease in 1 (1.8%) patient. When PCR negative patients were inspected, the following accompanying diseases were recorded: hypertension in 11 (19.0%) patients, diabetes mellitus in 10 (17.2%) patients, coronary artery disease in 4 (6.9%) patients, chronic
pulmonary obstructive disease in 4 (6.9%) patients and malignancy in 1 (1.7%) patient.
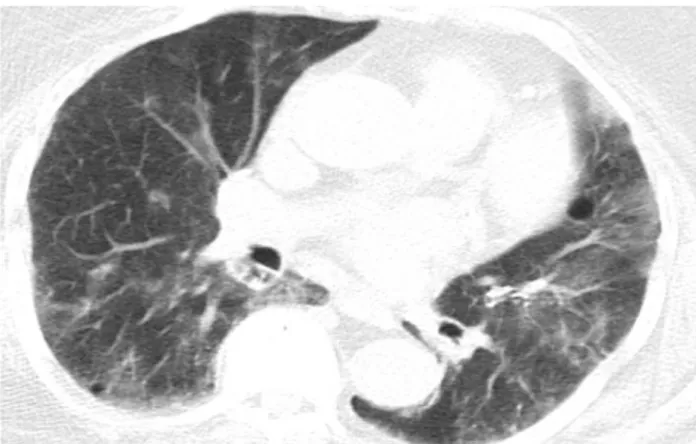
In comparison of the thorax CT findings of PCR positive and negative patients, only interlobular septal thickening was more frequent in PCR positive patients (p=0.043). Other thorax CT findings were similar in both groups. Bilateral, peripheral and multilobar ground glass opacifications, consolidations and interlobular septal thickenings were the most frequent findings in both groups (Figure 1 and 2). Both ground glass opacifications and consolidations were detected in 14 (25.0%) PCR positive patients. There were no pathologic thorax CT findings in 16 (28.6%) PCR positive patients and 14 (24.1%) PCR negative patients. Cavity formation, pleural thickening, halo finding, pleural effusion and vascular thickening were less frequent findings in thorax CT. The pathological findings detected in thorax CT were reported in Table 1.
Table 1. Computed tomography results of PCR positive
and negative patients, n (%)
PCR(+) (n=56)
PCR (-) (n=58) p
Ground glass opacity 34 (60.7) 29 (50.0) 0.250*
Bilateral involvement 26 (46.4) 20 (34.5) 0.194* Unilateral involvement 10 (17.9) 12 (20.7) 0.702* Peripheral involvement 26 (46.4) 22 (37.9) 0.358* Posterior involvement 13 (23.2) 10 (17.2) 0.427* Multilobar involvement 27 (48.2) 20 (34.5) 0.136* Consolidation 21 (37.5) 19 (32.8) 0.596*
Interlobular septal thickening 20 (35.7) 11 (19.0) 0.043* Pleura thickening 1 (1.8) 3 (5.2) 0.619† Bronchiectasis 5 (8.9) 4 (6.9) 0.740† Pleural effusion 2 (3.6) 3 (5.2) 0.999† Lymphadenopathy 2 (3.6) 6 (10.3) 0.272† Halo sign 1 (1.8) 3 (5.2) 0.619† Vascular thickness 3 (5.4) 2 (3.4) 0.676† Nodule formation 7 (12.5) 14 (24.1) 0.109* Cavitation 0 (0.0) 1 (1.7) 0.999†
PCR: polymerase chain reaction, *: Chi-square test, †: Fisher's exact test
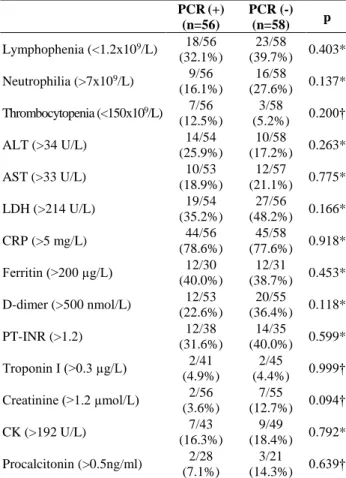
When the laboratory findings in both groups were compared, neutrophil and platelet counts were lower in
PCR positive patients (p<0.001 and p=0.038,
respectively). Other laboratory findings were similar in both groups. The laboratory findings of the patients were reported in Table 2 and the frequency of abnormal laboratory findings was shown in Table 3.
Figure 1. Tomography of 84 years old female patient
whose PCR was negative. Peripheral localized ground glass opacifications in left lung are remarkable
Figure 2. Tomography of 65 years old female patient
whose PCR was positive. Bilateral widespread ground glass opacifications are remarkable
Table 2. Laboratory results of PCR positive and negative patients
PCR (+) (n=56) PCR (-) (n=58)
p
Mean±SD Median (IQR) [min-max] Mean±SD Median (IQR) [min-max]
Lymphocyte (x109/L) 1.6±0.8 1.4 (0.8) [0.4-4.3] 1.5±0.7 1.4 (0.9) [0.5-4.1] 0.709* Neutrophil (x109/L) 4.4±2.9 3.2 (1.0) [0.7-15.0] 6.8±4.2 5.6 (3.0) [2-21] <0.001† Platelet count (x109/L) 227±67 219 (165) [124-375] 258±88 236 (158) [106-545] 0.038* ALT (U/L) 26.1±16.7 22 (27) [8-81] 29.1±30 21 (33) [6-197] 0.798† AST (U/L) 26.8±16.5 22 (53) [8-82] 27.5±21.3 20 (34) [8-123] 0.733† LDH (U/L) 219±108 181 (94) [122-712] 250±117 211 (98) [106-619] 0.066† CRP (mg/L) 39±69 10 (136) [1-135] 61±87 23 (107) [1-462] 0.082† Ferritin (µg/L) 300±350 143 (198) [4-1200] 329±463 120 (841) [13-1737] 0.729† D-dimer (nmol/L) 557±347 311 (1133) [9-5125] 875±709 415 (701) [55-7625] 0.146* PT-INR 1.1±0.4 1.8 (0.3) [0.4-3.2] 1.5±1.6 1.1 (0.2) [0.9-9.0] 0.118* Troponin I (µg/L) 0.2±0.7 0.1 (0.1) [0.1-5.0] 0.1±0.1 0.1 (0.1) [0.1-1.0] 0.741† Creatinine (µmol/L) 0.8±0.2 0.8 (0.2) [0.5-2.3] 0.9±0.3 0.9 (0.1) [0.1-2.3] 0.093† CK (U/L) 202±355 88 (145) [30-1790] 150±198 78 (91) [15-1067] 0.547† Procalcitonin (ng/mL) 0.7±2.9 0.1 (0.2) [0.1-15.0] 1.4±5.2 0.1 (0.2) [0.1-24.0] 0.274†
PCR: polymerase chain reaction, SD: standard deviation, IQR: interquartile range, min-max: minimum-maximum, *: Independent samples t test, †: Mann-Whitney U test, ALT: alanine aminotransferase, AST: aspartate aminotransferase, LDH: lactate dehydrogenase, CRP: C-reactive protein, PT-INR: prothrombin time international normalized ratio, CK: creatine kinase
Table 3. Frequency of abnormal laboratory results of PCR
positive and negative patients, n (%)
PCR(+) (n=56) PCR (-) (n=58) p Lymphophenia (<1.2x10⁹/L) 18/56 (32.1%) 23/58 (39.7%) 0.403* Neutrophilia (>7x10⁹/L) 9/56 (16.1%) 16/58 (27.6%) 0.137* Thrombocytopenia (<150x109/L) 7/56 (12.5%) 3/58 (5.2%) 0.200† ALT (>34 U/L) 14/54 (25.9%) 10/58 (17.2%) 0.263* AST (>33 U/L) 10/53 (18.9%) 12/57 (21.1%) 0.775* LDH (>214 U/L) 19/54 (35.2%) 27/56 (48.2%) 0.166* CRP (>5 mg/L) 44/56 (78.6%) 45/58 (77.6%) 0.918* Ferritin (>200 µg/L) 12/30 (40.0%) 12/31 (38.7%) 0.453* D-dimer (>500 nmol/L) 12/53 (22.6%) 20/55 (36.4%) 0.118* PT-INR (>1.2) 12/38 (31.6%) 14/35 (40.0%) 0.599* Troponin I (>0.3 µg/L) 2/41 (4.9%) 2/45 (4.4%) 0.999† Creatinine (>1.2 µmol/L) 2/56 (3.6%) 7/55 (12.7%) 0.094† CK (>192 U/L) 7/43 (16.3%) 9/49 (18.4%) 0.792* Procalcitonin (>0.5ng/ml) 2/28 (7.1%) 3/21 (14.3%) 0.639†
PCR: polymerase chain reaction, *: Chi-square test, †: Fisher's exact test, ALT: alanine aminotransferase, AST: aspartate aminotransferase, LDH: lactate dehydrogenase, CRP: C-reactive protein, PT-INR: prothrombin time international normalized ratio, CK: creatine kinase
DISCUSSION
The present study reports that only interlobular septal thickening in thorax CT findings was more frequent in PCR positive patients. Neutrophil and platelet counts were lower in PCR positive patients. Other laboratory and tomography findings were similar.
After inoculation of SARS-CoV-2, in the incubation period, there may be no pathologic tomography findings. Thus, tomography performed in the early period of the disease may be reported as normal and with advancing disease, tomography findings may be prominent (8). In a study, the thorax tomographies performed in the first two days of hospitalization were reported to be normal in 56% of the patients. On days 3 to 5, they were normal only in 9% of patients, and on days 6 to 12, the tomography ratio reported to be normal was as low as 4% (9).
In a study from China inspecting 101 COVID-19 patients, it was reported that 82% of patients had bilateral involvement in thorax tomography and the most frequent finding was peripheral ground glass opacifications in lower lobes of lungs (10). Another study reported posteriorly and peripherally localized lesions as the most frequent thorax CT findings. In that study, the most frequent lesions were ground glass opacifications, interlobular septal thickening and consolidations (4). In this reported study, the most frequent thorax CT findings were ground glass opacifications, consolidations and interlobular septal thickening, all localized bilaterally, peripherally and multilobarly. Only interlobular septal
thickening was more frequent in PCR positive patients. Viral infections other than COVID-19, especially influenza pneumonia may frequently result in ground glass opacifications and consolidation findings in thorax CT (11). Pulmonary nodule formation and halo findings are not specific lesions for COVID-19 but they have been reported to exist in thorax CTs of COVID-19 patients (12). In this reported study, both nodule formation and halo findings were rare in the thorax CTs of the patients. In a distinct study, comparing PCR positive and negative patients by thorax tomography, 34 patients were evaluated, and bilateral ground glass opacifications were more frequent findings in PCR positive patients (13). A study from China inspected thorax CT findings of COVID-19 and H1N1 influenza patients, and there were no difference in ground glass opacifications, consolidation, pathologic lymph node and nodule existence and localization of lesions between these groups (14). A normal thorax CT does not rule out COVID-19 diagnosis (13). A study reported normal thorax CT findings in 18% of COVID-19 confirmed patients (15). Chinese radiologists’ expert consensus report emphasized that PCR results may not be concurrent with thorax CT findings (16). In this reported study, 28.6% of all participants had normal thorax CT findings. There were no significant differences between the thorax CT findings in PCR positive and negative patients. There may be some explanations for this situation. Before all, thorax CTs were performed in the early disease period, in the first 48 hours after hospitalization. Therefore, some lesions may not have been detected. Second, patients were younger in age and there were not much accompanying diseases, so they may have a milder course of the disease. Third, false negative PCR results should also be considered.
The most frequently detected thorax tomography findings in PCR negative patients were reported to be ground glass opacifications and co-existence of ground glass opacifications and consolidations in some patients that were peripherally localized (17,18). This study, concordantly, revealed that PCR negative patients had ground glass opacifications and consolidations as the most frequent CT findings which were bilateral and peripherally localized. Ground glass opacifications has been reported to be a frequent finding in tomography, which could be explained as a nonspecific lesion that may be found in many malignant or benign conditions (19).
A meta-analysis, inspecting studies reported from China, evaluated 8697 patients. The most frequently reported laboratory findings were elevations in CRP, hepatic transaminases, D-dimer, erythrocyte sedimentation rate, troponin and CK myocardial band tests and decreases in neutrophil and lymphocyte counts (7). Laboratory findings in COVID-19 disease may be similar to other viral infections. A study comparing patients having COVID-19 and influenza revealed no difference between the groups in leukocyte, lymphocyte and platelet counts, CRP and erythrocyte sedimentation rates (14). In this reported study, neutrophil and platelet counts were lower in PCR positive patients. SARS-CoV-2 infection may be the reason for decreases detected in neutrophil and platelet counts.
In a study reported from USA, the mean age of COVID-19 confirmed patients was 63 (20). In this reported study, the
mean patient age was 47 and mean ages for the PCR positive and negative groups were similar. A study reported 46% of the patients had at least one accompanying disease (21), but in this reported study, accompanying disease rate was 30.4%. Participants in this study were younger and had less accompanying diseases. There are some limitations in this study. This is a retrospective study and thorax CTs were performed in the early period of the disease. Thus, the thorax CT findings may have been changed in the later periods of the disease. For the patients in whom the PCR test was negative, no further etiologic evaluation was performed. But in order to eliminate false negative results, additional PCR tests were performed if clinical suspicion for COVID-19 persisted.
CONCLUSION
In conclusion, the thorax CT findings of COVID-19 positive and negative patients were greatly similar in this study, except for interlobular septal thickening. The benefit of thorax CT in early periods of the disease seems to be limited, for this reason, it should not be performed in the first days after the onset of symptoms. Thus, thorax CT should not be relied alone, in the diagnosis of COVID-19, but symptoms, laboratory findings and PCR tests must be considered all together.
Ethics Committee Approval: The study was approved by
the Ethics Committee of Lokman Hekim University (27.05.2020, 2020/038).
Conflict of Interest: None declared by the authors.
Financial Disclosure: None declared by the authors.
Acknowledgements: Authors of this study thank to
Mr. Fatih AÇIKGÖZ for statistical analysis and advice.
REFERENCES
1. Li B, Li X, Wang Y, Han Y, Wang Y, Wang C, et al. Diagnostic value and key features of computed tomography in Coronavirus Disease 2019. Emerg Microbes Infect. 2020;9(1):787-93.
2. Peiris JS, Chu CM, Cheng VC, Chan KS, Hung IF, Poon LL, et al. Clinical progression and viral load in a community outbreak of coronavirus-associated SARS
pneumonia: a prospective study. Lancet.
2003;361(9371):1767-72.
3. Wu J, Wu X, Zeng W, Guo D, Fang Z, Chen L, et al. Chest CT findings in patients with coronavirus disease 2019 and its relationship with clinical features. Invest Radiol. 2020;55(5):257-61.
4. Song F, Shi N, Shan F, Zhang Z, Shen J, Lu H, et al. Emerging 2019 novel coronavirus (2019-nCoV) pneumonia. Radiology. 2020;295(1):210-7.
5. Ai T, Yang Z, Hou H, Zhan C, Chen C, Lv W, et al. Correlation of chest CT and RT-PCR testing in coronavirus disease 2019 (COVID-19) in China: A report of 1014 cases. Radiology 2020;296(2):E32-40. 6. Goyal P, Choi JJ, Pinheiro LC, Schenck EJ, Chen R,
Jabri A, et al. Clinical characteristics of COVID-19 in New York City. N Engl J Med. 2020;382(24):2372-4.
7. Zhu J, Zhong Z, Ji P, Li H, Li B, Pang J, et al. Clinicopathological characteristics of 8697 patients with COVID-19 in China: A meta-analysis. Fam Med Community Health. 2020;8(2):e000406.
8. Heymann DL. Data sharing and outbreaks: best practice exemplified. Lancet. 2020;395(10223):469-70.
9. Bernheim A, Mei X, Huang M, Yang Y, Fayad ZA, Zhang N, et al. Chest CT findings in coronavirus disease-19 (COVID-19): Relationship to duration of infection. Radiology. 2020;295(3):200463.
10. Zhao W, Zhong Z, Xie X, Yu Q, Liu J. Relation between chest CT findings and clinical conditions of coronavirus disease (COVID-19) pneumonia: A
multicenter study. AJR Am J Roentgenol.
2020;214(5):1072-7.
11. Oikonomou A, Müller NL, Nantel S. Radiographic and high-resolution CT findings of influenza virus pneumonia in patients with hematologic malignancies. AJR Am J Roentgenol. 2003;181(2):507-11.
12. Pinto PS. The CT halo sign. Radiology.
2004;230(1):109-10.
13. Liu T, Huang P, Liu H, Huang L, Lei M, Xu W, et al. Spectrum of chest CT findings in a familial cluster of COVID-19 infection. Radiology: Cardiothoracic Imaging. 2020;2(1):e200025.
14. Yin Z, Kang Z, Yang D, Ding S, Luo H, Xiao E. A comparison of clinical and chest CT findings in patients with influenza A (H1N1) virus infection and coronavirus disease (COVID-19). AJR Am J Roentgenol. 2020;215(5):1065-71.
15. Xu YH, Dong JH, An WM, Lv XY, Yin XP, Zhang JZ, et al. Clinical and computed tomographic imaging features of novel coronavirus pneumonia caused by SARS-CoV-2. J Infect. 2020;80(4):394-400.
16. Chinese Society of Radiology, Chinese Medical Association. Radiological diagnosis of COVID-19: expert recommendation from the Chinese Society of Radiology (First edition). Chin J Radiol. 2020;4(54):279-85. 17. Chen ZH, Li YJ, Wang XJ, Ye YF, Wu BL, Zhang Y,
et al. Chest CT of COVID-19 in patients with a negative first RT-PCR test: Comparison with patients with a positive first RT-PCR test. Medicine (Baltimore). 2020;99(26):e20837.
18. Xie X, Zhong Z, Zhao W, Zheng C, Wang F, Liu J. Chest CT for typical coronavirus disease 2019 (COVID-19) pneumonia: Relationship to negative RT-PCR testing. Radiology. 2020;296(2):E41-5.
19. Gao JW, Rizzo S, Ma LH, Qiu XY, Warth A, Seki N, et al. Pulmonary ground-glass opacity: computed tomography features, histopathology and molecular pathology. Transl Lung Cancer Res. 2017;6(1):68-75. 20. Richardson S, Hirsch JS, Narasimhan M, Crawford
JM, McGinn T, Davidson KW, et al. Presenting characteristics, comorbidities, and outcomes among 5700 patients hospitalized with COVID-19 in the New York City area. JAMA. 2020;323(20):2052-9. 21. Wang D, Hu B, Hu C, Zhu F, Liu X, Zhang J, et al.
Clinical characteristics of 138 hospitalized patients with 2019 novel coronavirus-infected pneumonia in Wuhan, China. JAMA. 2020;323(11):1061-9.