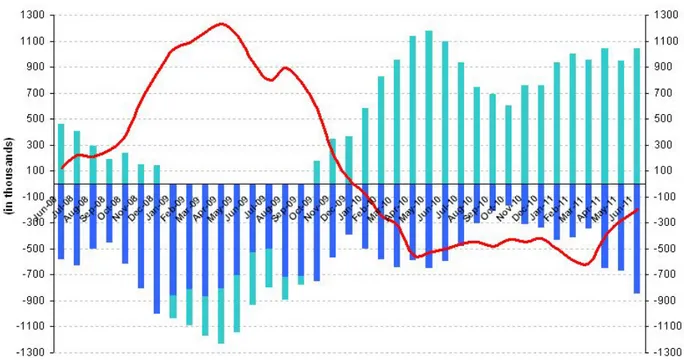
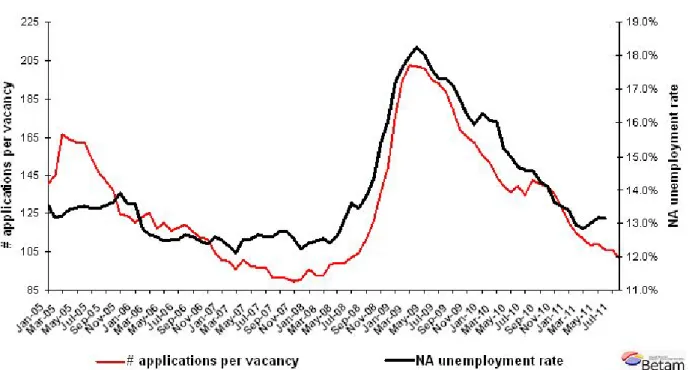
Labor market outlook : September 2011 : non-agricultural unemployment rate has not been decreasing
Tam metin
Şekil

Benzer Belgeler
Şekil-1 İşletme Görevlisinin Eğitim Düzeyine İlişkin Dağılımlar………...72 Şekil-2 İşletmede Çalışan Kişi Sayısına İlişkin Dağılımlar………73 Şekil-3
İletişim farklı yönleriyle tanımlanabilir. Bu iletişimin hangi alan içerisinde incelendiğine bağlı olarak belirlenir. Bir medya uzmanı olan John Fiske,
Bu çalışmanın temel odak noktası, işletmelerin cevap verme, hız, esneklik ve yetkinlik gibi örgütsel çeviklik yeteneklerini edinmelerinde vizyoner liderliğin rolünü
Vizyoner liderliğin alt boyutlarından iletişim, güvenilirlik, risk, saygı ve lider üye etkileşimi ile rekabet performansı arasındaki ilişkiye öneri olarak;
Tablo 13 de gösterildiği gibi yöneticilerin algılarına göre Enneagram Öğretisi Uygulamalarının Yaratıcı Liderlik etki düzeyini ölçmek için yapılan test
Tablo 44'de görüldüğü üzere evde yaşayan yaşlıların beck depresyon ölçeği puanları ile sosyal destek algısı ölçeğinin aile boyutu ve arkadaş boyutu
İlişkin Kalite Algısının Cinsiyete Göre Karşılaştırılması.. HH kalite algısı ortalaması kadın katılımcılarda 3,73 iken erkek katılımcılarda 3,55 olarak
ÜNAL Recep, Medya Ekolojisinde Yeni Hikâye Anlatım Biçimi Olarak Instagram: Bbc News ve Cnntürk Örneği, Anadolu Üniversitesi İletişim Bilimleri Fakültesi Uluslararası
