SHARP DROP IN INVESTMENTS
Zümrüt İmamoğlu* ve Barış Soybilgen†
Executive Summary
In August, exports continued to increase whereas imports continued to decline. We expect that positive contribution of net exports to quarterly GDP will be significantly high. On the other hand, industrial production index decreased back to its June level. According to our analysis, this decrease was mainly caused by the fall in production of investment goods. Our economic indicators show that there is a sharp drop in investments. Consumption indicators are also on a downward trend. Deceleration in the economy manifested itself as the fall in imports and investments. Betam revised down its quarter on quarter growth forecast for the third quarter from 0.8 percent to 0.6 percent. We also expect the change from the same quarter of the previous year to be 7.4 percent. Our estimations showed that current account deficit was less than 4 billion dollars in August. Betam’s current account deficit forecast for the end of third quarter is 9.7 percent of GDP.
* Dr. Zümrüt İmamoğlu, Betam, Uzman Araştırmacı.
Tablo1. Betam’s quarterly and annual growth rate forecasts
Source: Betam *sa: seasonally and calendar day adjusted **ca: calendar day adjusted
Restrained Slowdown
Turkish economy began to show all signs of a slowdown. Imports and investments are decreasing. Trade deficit is improving. Imports of intermediate goods which is an important leading indicator for the Turkish economy have been in a downward trend for the last two quarters. All these data show that in the third and the fourth quarter growth will continue to slow down. We revised down our quarterly growth forecast from 0.8 percent to 0.6 percent for the third quarter. Due to base affect, we expect that year on year growth will be over 7 percent in the third quarter. Our
Third Quarter -
2011 Real GDP growth, %
(quarter on quarter, sa*) 0.6
Real GDP growth, %
(year on year, ca**) 7.4
Current account deficit
(% of GDP, annual) 9.7
Economic Outlook and Forecasts:
October 2011
However, we expect the fourth quarter year on year growth rate to be around 4 percent.
After this point, Turkish central bank should be very careful. On the one hand, CBRT will use expansionary policies in order for the slow down in the economy not to turn into a recession. But on the other hand, CBRT will try to prevent a rise in the current account deficit due to those expansionary policies. Fiscal policy should also be tight because the depreciation of the Turkish Lira due to monetary expansionary policy might cause inflationist pressures. However, it might become harder for the government to keep a tight fiscal stance in the coming year because the fall in imports causes a decrease in taxes.
Consumer confidence is deteriorating
Consumer confidence index that began to deteriorate in July continued its downward rally in August and fell by 3.3 percent. Imports of consumer goods also decreased by 8.4 percent. However, durable and nondurable consumer goods manufacturing increased by 3.9 and 0.8 percent, respectively. In spite of the increase in consumer goods manufacturing, we expect a small decrease in consumption in the third quarter.
High drop in investment goods manufacturing
September. Industrial production index decreased by 2.6 percent in August. This fall mainly caused by the 8.8 percent decrease in investment goods production. However, imports of investment goods increased by 1.6 percent in August after a 14.6 percent fall in July. In general looking at these changes, we expect to see a sharp drop in investment demand in the third quarter.
The engine of third quarter growth: net exports
Figure 2 shows monthly changes of seasonally adjusted import and export volume indices. In August, exports increased by 5.2 percent and imports decreased by 5 percent. For the last two months the increase in exports amounted to 12.6 percent whereas imports decreased 5.6 percent. We expect the contribution of net exports to quarterly GDP growth to be the main driving force of growth in the third quarter.
Current account deficit goes up to 9.7 percent
Due to the surge in exports and the decline in imports in July and August, trade deficit in volume decreased greatly (see Figure 2). Current account deficit also decreased due to high tourism income. According to data released by Turkish Exporters Assembly, exports might decrease in September. However, there will be an increase in the current
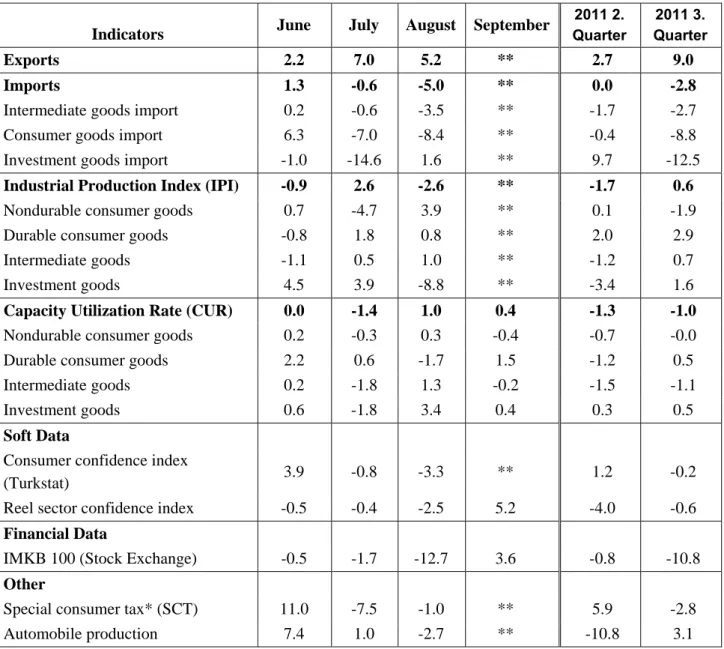
Table 2. Monthly and quarterly changes of Betam’s selected indicators (real and sa)
Indicators June July August September
2011 2. Quarter 2011 3. Quarter Exports 2.2 7.0 5.2 ** 2.7 9.0 Imports 1.3 -0.6 -5.0 ** 0.0 -2.8
Intermediate goods import 0.2 -0.6 -3.5 ** -1.7 -2.7
Consumer goods import 6.3 -7.0 -8.4 ** -0.4 -8.8
Investment goods import -1.0 -14.6 1.6 ** 9.7 -12.5
Industrial Production Index (IPI) -0.9 2.6 -2.6 ** -1.7 0.6
Nondurable consumer goods 0.7 -4.7 3.9 ** 0.1 -1.9
Durable consumer goods -0.8 1.8 0.8 ** 2.0 2.9
Intermediate goods -1.1 0.5 1.0 ** -1.2 0.7
Investment goods 4.5 3.9 -8.8 ** -3.4 1.6
Capacity Utilization Rate (CUR) 0.0 -1.4 1.0 0.4 -1.3 -1.0
Nondurable consumer goods 0.2 -0.3 0.3 -0.4 -0.7 -0.0
Durable consumer goods 2.2 0.6 -1.7 1.5 -1.2 0.5
Intermediate goods 0.2 -1.8 1.3 -0.2 -1.5 -1.1
Investment goods 0.6 -1.8 3.4 0.4 0.3 0.5
Soft Data
Consumer confidence index
(Turkstat) 3.9 -0.8 -3.3 ** 1.2 -0.2
Reel sector confidence index -0.5 -0.4 -2.5 5.2 -4.0 -0.6
Financial Data
IMKB 100 (Stock Exchange) -0.5 -1.7 -12.7 3.6 -0.8 -10.8
Other
Special consumer tax* (SCT) 11.0 -7.5 -1.0 ** 5.9 -2.8
Automobile production 7.4 1.0 -2.7 ** -10.8 3.1
Source: TurkStat. TCMB. Treasury. IMKB. Betam. All series are real (or inflation adjusted) wherever necessary and seasonally adjusted.
*This tax is collected on sales of goods such as gas. fuel oils. alcohol. tobacco products and automobiles. **Data not yet released
Figure 1: Capacity utilization rate and industrial production index (sa. left axis for CUR and right axis for IPI)
60 65 70 75 80 85 Ja n-07 Ap r-07 Ju l-0 7 Oc t-07 Ja n-08 Ap r-08 Ju l-0 8 Oc t-08 Ja n-09 Ap r-09 Ju l-0 9 Oc t-09 Ja n-10 Ap r-10 Ju l-1 0 Oc t-10 Ja n-11 Ap r-11 Ju l-1 1 95 100 105 110 115 120 125 130 CUR IPI
Source : TurkStat. Betam
Figure 2: Volume indices of exports and imports (sa) 120.00 130.00 140.00 150.00 160.00 170.00 180.00 190.00 200.00 210.00 Ja n-07 Ma y-07 S ep-07 Ja n-08 Ma y-08 S ep-08 Ja n-09 Ma y-09 S ep-09 Ja n-10 Ma y-10 S ep-10 Ja n-11 Ma y-11 Export Import
Source : TurkStat. Betam
Figure 3: Ratio of current account deficit to GDP (annual)
Current Account Deficit (% of GDP)
0.0 2.0 4.0 6.0 8.0 10.0 12.0 2008( Q 1) 2008( Q 2) 2008( Q 3) 2008( Q 4) 2009( Q 1) 2009( Q 2) 2009( Q 3) 2009( Q 4) 2010( Q 1) 2010( Q 2) 2010( Q 3) 2010( Q 4) 2011( Q 1) 2011( Q 2) 2011( Q 3)
Figure 4: Monthly changes of manufacturing industry exports (sa)
Source : Turkstat, Betam
August 2011 -15.00% -5.00% 5.00% 15.00% 25.00% 35.00% F ood pr oduc ts and bev erages T abac co produc ts T ex til e goods C lot hi ng goods F urs leat her and pr oduc ts Wood and co rk produc ts P aper and paper pr oduc ts C ok ing c oal , ref ine d pet . C hem ic al s P las tic and r ubber pro duc ts O ther non-m et allic m in er al p ro d. M et al indus tr y M et al produc ts (not m ac h. ) M ac hi nery and e qui pm ent E lec tr ic al m ac hi nary R adi o, t el ev is ion and c om m . M ot or v ehi cl es and t rai le rs F urni tur e and ot her pr oduc ts July 2011 -15.00% -10.00% -5.00% 0.00% 5.00% 10.00% 15.00% 20.00% 25.00% 30.00% F ood produc ts and bev erages T abac co produc ts T ex til e goods C lot hi ng goods F urs leat her and produc ts Wood and c or k produc ts P aper and paper produc ts C ok ing c oal , r ef ined pet . C hem ic al s P las tic
and rubber produc
ts O ther non-m et al lic m iner al prod. M et al indus tr y M et al pr oduc ts ( not m ac h. ) M ac hi nery an d equi pm ent E lec tr ic al m ac hi nary R adi o, t el ev is ion and c om m . M ot or v ehi cl es and t rai le rs F ur ni ture and ot her produc ts