COMPUTER AIDED DETECTION OF PULMONARY EMBOLISM IN
COMPUTED TOMOGRAPHY ANGIOGRAPHY IMAGES
Haydar Özkan
#1Onur Osman*
2Sinan Şahinº
3#
Fatih Sultan Mehmet Vakıf University, Department of Biomedical Engineering, in Istanbul, Turkey
*Arel University, Department of Electrical and Electronics Engineering, in Istanbul, Turkey
ºDr. Siyami Ersek Thoracic and Cardiovascular Surgery Training and Research Hospital, Department of
Radiology
1
[email protected]
2[email protected]
3
[email protected]
ABSTRACT
Pulmonary Embolism (PE), one of the circulatory system problems, is the clinical result at the end of that the lung artery or one or a few branches of them are bunged up by clot of blood. Besides it is a hard disease to diagnose, early diagnosis and treatment of it can save lives. In this study, a new CAD system is proposed for detection of PE in CTA images. Firstly, lung was segmented and Mediastinum Region (MR) was determined. Secondly, lung vessel segmentation was carried out. Lastly, PEs were detected according to region, intensity, and the size of PEs in lung vessel tree. Data set belongs to 15 patients were examined. 210 PEs were determined by the radiologists manually. 181 of them were detected as PE by our CAD system. According to the proposed method, 86.2% of sensitivity with 13.1 false positive per data sets (FP/ds) is obtained.
Index Terms— Computed Tomography Angiography,
Lung Segmentation, Lung Vessel Segmentation, Pulmonary Embolism, Computer Aided Detection
1. INTRODUCTION
PE is a difficult disease to diagnose clinically since many other conditions share the same symptoms [1]. Since PE is a highly encountered disease with a high mortality and morbidity, it desires early and accurate diagnosis [2]. Contrast enhanced pulmonary multidetector Computed Tomography Angiography (CTA) is chosen as the diagnostic imaging method for the detection of PE by most institutions [3–6]. In CTA images, the lung vessels appear to be very bright due to contrast material. The PEs don’t absorb this material, thus it can be distinguished in CTA as dark areas in the lung vessels. However, manual detection of
the dark areas called PE in CTA images is generally described as difficult and time consuming by radiologists [7]. Computer-Aided Diagnosis/Detection (CAD) based on quantitative image analysis is one of the most important and active fields, and is expected to solve these diagnostic problems [8]. Therefore, PE detection in CTA images is found to be an attractive research area by several scientists.
In previous works, two different approaches for the detection of PE are given: the first one performs does not make use of lung vessel segmentation. Such a method based on tobogganing was recently presented by Liang et al. in [9]. In the second method of PE detection, pulmonary vessel tree segmentation is performed. Slebbe et al, Masutani et al., and Pichon et al., recently presented a method based on segmentation of lung vessels to detect PE [10-12]. The most important problem is distinction of PE from the tissues with the same low intensity like them after lung vessel segmentation was carried out. To find discriminating features, a few attempts have been proposed. Masutani et al. recently presented a method for emboli detection based on lung vessel segmentation and proposed to use the volume length, and intensity of a PE [11]. Pichon et al. used the size and intensity to distinguish PE, after lung vessel segmentation [12].
In previous works, PEs with different tissues have been distinguished with the help of properties like intensity, size, and presumed shape of PE. However there is no a constant shape of PEs. It can be anywhere in the vessel tree regionally. The components under a certain size aren’t considered as PE. So In this study, a new CAD system is proposed for detection of PE in CTA images. We detected the beginning of occluded points of the 3D vessel structure due to the PEs to use at the lung vessel segmentation. Through the beginning occluded points, major lung vessel segmentation with PE was achieved in MR. To segment the
peripheral-vessels in lung, threshold images were subtracted from each other. Vessels which progress to the lung from MR were acquired at the end of subtraction. All lung vessel segmentation was carried out by gathering major and peripheral vessels. Lastly PEs were detected according to region, intensity, and the size of PEs in lung vessel tree. We used 15 positive data sets which have 210 PE. Sensitivity and FP/ds of the proposed CAD system were obtained and compared to previous studies.
2. MATERIALS AND METHODS 2.1. Materials
In this work, data sets were collected by Dr. Siyami Ersek thoracic and cardiovascular surgery training and research hospital. All CTA images were performed with 16 detectors CT (Somatom Sensation 16, Siemens, AG, Erlangen, Germany) equipment. Patients were informed about the examination and also for breath holding. Imaging was performed with chase-bolus program. After scenogram, one slice was taken at the level of truncus pulmonalis and bolus tracking is placed at that level. Scan trigger is adjusted to 100 HU (Hounsfield Unit). With an automated syringe (Optistat Contrast Delivery System, Liebel-Flarsheim, USA) 70ml non-ionic contrast agent at the rate of 4mL/sec was given via 18-20G intra venous cannula from antecubital vein. When opacification was reached at the pre-adjusted level, the exam was performed from the supraclavicular region to the diaphragms. Exams were performed with 120 kV, 80- 120 mA, 1 mm slice thickness and 1,0-1,2 pitch. Image reconstructions were performed with 1mm and 5mm thickness, and evaluated at mediastinal window (WW 300, WL 50) with advanced workstation (Wizard, Siemens, AG, Erlangen, Germany) in coronal sagittal and axial planes. Each exam consists of 350-550 images with 512x512 voxels and 0.8 mm resolution. Data set belongs to 15 patients were examined. 8 of them are female and 7 of them are male. Ages of females change between 40 and 70 and ages of males change between 35 and 75.
2.2. Methods
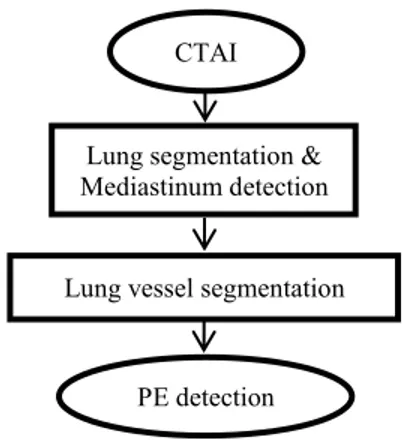
To detect pulmonary emboli, firstly, lung segmentation is performed and MR is determined. Secondly Lung vessels are segmented. Lastly PEs are detected from lung vessel tree. In Fig.1, detailed flow chart of the proposed method can be seen.
Fig. 1. Flow chart of the method
2.2.1. Lung Segmentation and Mediastinum Detection
To segment lung, firstly, each image are threshold and the level of threshold is chosen as -500 HU. So the voxels having less value than the threshold level were removed from the images. The small objects in the lung region are another problem. They were removed by small object removal filters. Lastly, lung regions were segmented with respect to the volumes of the components in the image. After lung segmentation is performed, the region between left and right lungs is determined as MR [13].
2.2.2. Lung Vessel Segmentation
Lung vessel tree are segmented by beginning from the pulmonary trunk to the subsegment vessels. Pulmonary trunk and arteries were segmented with an adapted threshold, because they are brighter than other objects in the CTA images. If there is no PE in lung vessels, the vessels properly continue from the pulmonary trunk forward to the left-right Pulmonary Artery (PA). However, if there is a PE in the lung, vessel structure does not regularly continue due to the low-threshold value of the PE as shown with arrow in Fig.2.
Fig. 2. 2D Image of occluded pulmonary arteries due to PE
In Fig.3, segmented 3D pulmonary trunk, arteries and corrupting structure of them are shown. Also the beginning
CTAI
Lung segmentation & Mediastinum detection
Lung vessel segmentation
PE detection
occluded points of 3D vessel structure are shown with arrows too.
Fig. 3. Segmented 3D pulmonary trunk, arteries and corrupting structure of them.
To segment occluded pulmonary arteries, beginning of occluded points of 3D vessel structure must be detected. To detect these beginning occluded points, number of voxels of each 3D cross section of pulmonary arteries are examined. In Fig.4, some cross sections belong to left and right PAs are shown representatively.
Fig. 4. The imaginative voxels of each 3D cross section of pulmonary arteries, the regions of black color are imaginative PEs
The voxels number whose vessel structure doesn’t continue regularly due to the PE (R4, R5, R6 in right PA; L3, L4 in left PA) is less than whose vessel structure continues regularly (R1, R2, R3 in right PA; L1, L2 in left PA). The beginning points of voxel numbers which decrease are determined as beginning occluded points. The beginning occluded point is R4 for the right PA, the beginning occluded point is L3 for the left PA.
To segment pulmonary trunk and arteries which corrupted by PE, firstly each image has been threshold using 1 HU < Image < 150 HU as the level of threshold. Secondly, all of the components that are in right side of the beginning occluded point of right PA and all of the components that are in left side of the beginning occluded point of left PA are removed from the threshold new image. Lastly, all the pulmonary trunk and arteries segmentation have been achieved by gathering the occluded pulmonary trunk, arteries and continuing PEs by beginning from the occluded
point to the lungs. So lung vessels are segmented in mediastinum region.
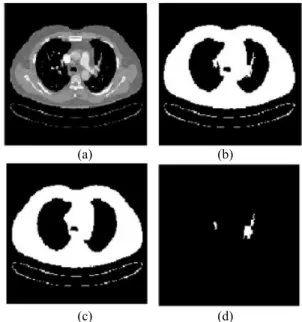
Then, vessels except for MR in lungs are segmented. To segment lobar and segment vessels in lungs, firstly, each image has been threshold using Image >-500 HU as the level of threshold. Then components are labelled by Connected Component Labelling (CCL) as 2D, and in lungs components, whose number of voxels are under 750, are determined as subsegment vessels and saved and were removed from the images to segment lobar segment vessels (Fig. 5b). Secondly, the 2D image in Fig. 5b and the previous one from it (Fig. 5c) are subtracted from each other. Since the lobar or segment vessels haven’t arisen yet in the previous image, difference components (Fig. 5d) have been determined as lobar and segment vessels [14].
(a) (b)
(c) (d)
Fig. 5. (a) Original image, (b) Threshold image, (c) The previous one from b, (d) The differences between b and c images
Lastly pulmonary trunk, arteries, lobar, segment and subsegment vessels have been gathered to achieve the exact lung vessel segmentation.
2.2.3. Pulmonary Emboli Detection
The detected lung vessel tree contains PEs. To detect PE from 3D lung vessel tree, firstly, every 3D lung vessel tree have been threshold using 1 HU < Image < 150 HU as the level of threshold. These disconnected components, between 1 and 150 HU, are the candidates of PE. Then, volume thresholding is applied to the PE candidates. The level of volume threshold is assumed as 16mm3. The small components from the volume threshold value are removed. So the remaining components are determined as PEs. Detected PEs were compared with the PEs determined by the radiologist. Then numbers of True Positive (TP), False Negative (FN) and False Positive (FP) were counted
manually. Then sensitivity and FP/ds is computed and compared with the previous studies.
3. DISCUSSION AND CONCLUSION
The CAD system, which was developed for the detection of PEs, was applied to 15 patients. 210 PEs were determined by the radiologists manually. 181 of them were detected as PE by our CAD system. According to the proposed method, 86.2% of sensitivity with 13.1 FP/ds is obtained. Masutani et al. obtained a high sensitivity as 100% in their work, but they detected only 21 PEs. This number is lower than our study and their number of data sets is 11. So their 7.7 of FP/ds is better than ours [11]. Similar to this, Pichon et al. have detected low number of PEs from only three patients. Nevertheless their sensitivity value is 86% and similar to ours. But their FP/ds value is 6.3 and better than ours [12]. Bouma et al. have higher number of data sets than our work but their number of PEs is lower than ours. Their sensitivity value is 73% and lower than ours. At the same time their FP/ds velue is 15 and higher than ours [15].
Acknowledgement
This work has been supported by Dr. Siyami Ersek Thoracic and Cardiovascular Surgery Training and Research Hospital, Istanbul, Turkey. The authors wish to thank chief of staff in the hospital, Prof. Dr. Ibrahim Yekeler.
4. REFERENCES
[1] D. Manganelli, A. Palla, V. Donnamaria, C. Giuntini, “Clinical features of pulmonary embolism: doubts and certainties” Chest; 107 (1 suppl): pp. 22-32, 1995.
[2] M. Domingo, L. Martí-Bonmatí, R. Dosdá, and Y. Pallardó, “Interobserver agreement in the diagnosis of pulmonary embolism with helical CT” Eur. J. Radiol., vol. 34, pp. 136– 140, 2000.
[3] E. Coche, S. Pawlak, S. Dechambre et al, “Peripheral pulmonary arteries: identification at multi-slice spiral CT with 3D reconstruction” Eur Radiol 13, pp. 815–822, 2003. [4] B. Ghaye, D. Szapiro, I. Mastora et al, “Peripheral pulmonary
arteries: how far in the lung does multi-detector row spiral CT allow analysis” Radiology, 219, pp. 629–636, 2001. [5] M. Remy-Jardin, J. Remy, D. Artaud et al, “Peripheral
pulmonary arteries: optimization of the spiral CT acquisition protocol” Radiology, 204, pp. 157–163, 1997.
[6] U.J. Schoepf, P. Costello, “CT angiography for diagnosis of pulmonary embolism: state of the art” Radiology, 230, pp. 329–337, 2004.
[7] P. Stein et al., “Multidetector computed tomography for acute pulmonary embolism” New Engl. J. Med., vol. 354, no. 22, pp.2317–2327, 2006.
[8] K. Doi, “Computer-Aided Diagnosis and Potential Impact on Diagnostic Radiology” Computer-Aided Diagnosis in Medical Imaging, pp. 11-20, Elsevier 1999.
[9] J. Liang, M. Wolf, and M. Salganicoff. “A fast toboggan-based method for automatic detection and segmentation of pulmonary embolism in CT angiography” In Int. Conf. on Medical Image Computing and Computer Assisted Intervention (MICCAI’05), Palm Springs, USA, October 2005.
[10] R. Sebbe, “Computer-aided Diagnosis of Pulmonary Embolism in Opacified CT Images” PhD thesis, Facult´e Polytechnique de Mons Universit´e d’Orl´eans, November 2006.
[11] Y. Masutani, H. MacMahon, and K. Doi, “Computerized detection of pulmonary embolism in spiral CT angiography based on volumetric image analysis,” IEEE Trans. Med. Imag., vol. 21, no. 12, pp. 1517–1523, Dec. 2002.
[12] E. Pichon, C. L. Novak, A. P. Kiraly, and D. P. Naidich, “A novel method for pulmonary emboli visualization from high-resolution CT images,” in Proc. SPIE Med. Imag., vol. 5367, pp. 161–170. 2004.
[13] H. Özkan, O. Osman, S. Şahin, M. M. Atasoy, H. Barutca, A.F. Boz, A. Olsun, “Lung Segmentation Algorithm for CAD System in CTA Images” World Academy of science Engineering end Technology (ICBCBBE 2011), Paris, July 24- 26, (53) 306-309, 2011.
[14] H.Özkan, “3D Lung vessel segmentation in computed tomography angiography images” Istanbul University–Journal of Electrical & Electronics Engineering, IUJEEE Vol. 12(1), pp. 1437-1443, 2012.
[15] H. Bouma, J.J. Sonnemans, A. Vilanova, F. A. Gerritsen, Automatic Detection of Pulmonary Embolism in CTA Images, IEEE Transactıons on Medical Imaging 28 (8) 1223-1230, 2009.