Commun.Fac.Sci.Univ.Ank.Series A2-A3 Volume 60, Number 1, Pages 41-64(2018) DOI: 10.1501/commua1-2_0000000110 ISSN 1303-6009 E-ISSN 2618-6462
http://communications.science.ankara.edu.tr/index.php?series=A2A3
Received by the editors: June 08, 2018; Accepted: July 24, 2018.
Key word and phrases: Dynamical System, bifurcation analysis, Corticotroph model, bursting and spiking oscillations.
© 2018 Ankara University Communications Faculty of Sciences University of Ankara Series A2-A3: Physical Sciences and Engineering COMPUTATIONAL BIFURCATION ANALYSIS TO FIND DYNAMIC
TRANSITIONS OF THE CORTICOTROPH MODEL
SEVGİ ŞENGÜL AYAN AND AHMET KURT
Abstract. The corticotroph model is a 7th order nonlinear differential equation system derived for representing the action potential dynamics of corticotrophs; one of the endocrine cells that is responsible for stress regulation. Here we use numerical continuation methods to perform bifurcation analysis since controlling bifurcations in the hormonal dynamics may bring some new insights in the treatment of stress related disorders. We study the bifurcation structure of the system as a function of the BK-channel dynamic parameters and the all maximal conductances. We identify the regions of bistability and bifurcations that shape the transitions between resting, bursting and spiking behaviors, and which lead to the appearance of bursting which is directly connected to stress regulation. Furthermore, we find that there are two routes to bursting, one is the experimentally observed BK-channel dynamics and the other is Ca2+ channel conductance only.
Finally, we discuss how some of the described bifurcations affect dynamic behavior and can be tested experimentally.
1. Introduction
Systems of ordinary differential equations (ODEs) have a great impact on understanding the many biological systems, like electrically excitable cells ([1], [2]), growth dynamics [3] or chemical reaction networks [4]. Another approach for such systems is stochastic approach [5] but when it comes to numerical simulations of large nonlinear models and parameter estimation, ODE-based models offer a variety of analysis methods [6]. Another important property of ODE models for biological models are, we can observe very different dynamics for different sets of parameters such as stable/unstable equilibriums, limit cycles, periodic or chaotic orbits. A challenging part in developing and analyzing such models is to understand how parameters of the model affect features of its such dynamics. Numerical solution of
these models with hand tuning of parameters is a first approach to predict the system’s behavior and effects on solutions [7]. But trusting the modeler’s intuition by manual inspection of the equations is not a suitable approach for non–trivial systems. At this point we need a more powerful approach to see the specific behavior, and how this depends on parameter values.
Excitable electric activity is observed to many biological systems; such as some isolated or coupled neurons, hormone secretion, muscle contraction or heart cells. This activity plays an essential role for the function of the cell as well as for its communication with neighboring cells. From a dynamical system point of view, a slight perturbation of the single stable stationary state by changing related parameter would lead to a large and long-lasting shift away from stationary point before the system asymptotically returning to equilibrium. Performing numerical continuation methods to perform bifurcation analysis is often a powerful way to analyses the properties of such systems, since it predicts what kind of behavior occurs where in parameter space ([7], [8]). Bifurcation analysis start with computing all equilibrium and periodic solutions of the system along with information about the stability of these solutions. Bifurcation diagrams are created later from the curves of equilibrium solutions as one of the parameters is varied while all other parameters are held fixed. To generate an entire family of bifurcation diagrams, this procedure can be repeated for all important parameters as a variable.
In this paper we focus on the analysis of CRH/AVP bursting in corticotroph cells of the pituitary using the mathematical model that author defined in the previous work [2]. These cells are responsible for the neuroendocrine response to stress as an integral component of the hypothalamic–pituitary–adrenal (HPA) axis. Corticotrophs display mostly single spike activity under basal conditions that transition to complex bursting behaviors upon stimulation by the CRH and AVP, however the underlying mechanisms controlling bursting in terms of dynamical system viewpoint are unknown. Similar bursting behavior that we describe for corticotrophs is known to occur in a variety of other cell types as well. For instance, Morris and Lecar [9] modeled the complex firing patterns in barnacle giant muscle fibers, for pacemaker neurons burst patterns are shown by Pant and Kim [10], bursting patterns in discharging cold fibers of the cat are investigated by Braun et al.
CORTICOTROPH MODEL
[11]. But biophysical mechanism underlying the bursting behavior vary significantly from cell type to cell type.
To this aim, we use mathematical modeling, numerical simulations and dynamical systems theory approaches to investigate the dynamic behavior of the corticotroph system. Parameter regimes for spiking and bursting activity are not investigated before, a detailed mathematical analysis of the dynamical regimes of the model has not performed yet. We study the bifurcation structure of the system as a function of conductances and parameters responsible for bursting. We identify the bifurcations that shape the transitions between resting, bursting and spiking behaviors which lead to the appearance of bursting after the stimulation with CRH. Insights gained from these analyses helped us to understand how the activity changes arise and whether there is other parameter set that can cause bursting for corticotrophs. These insights will provide us measurable results with experiments. Due to the complexity of the model, a great deal of extra insight can be gained by analyzing how some of the many other parameters shape the dynamical landscape of the model. Traditionally this has been used to isolate computationally important variables, responsible for bursting, given the difficulty of teasing apart the system experimentally.
2. The Corticotroph Model
As the basis for our bifurcation analysis, we will use the following model suggested by the author without the noise term [2];
𝐶𝑚 𝑑𝑉 𝑑𝑡 = −(𝐼𝐶𝑎+ 𝐼𝐾−𝑑𝑟+ 𝐼𝐵𝐾−𝑛𝑒𝑎𝑟+ 𝐼𝐵𝐾−𝑓𝑎𝑟+ 𝐼𝐾−𝑖𝑟+ 𝐼𝑁𝑆) (2.1) 𝐼𝐶𝑎(𝑉) = 𝑔𝐶𝑎𝑚∞(𝑉)(𝑉 − 𝑉𝐶𝑎) (2.2) 𝐼𝐾−𝑑𝑟(𝑉) = 𝑔𝐾𝑛(𝑉 − 𝑉𝐾) (2.3) 𝐼𝐾−𝑖𝑟 (𝑉) = 𝑔𝐾−𝑖𝑟𝑟∞(𝑉)(𝑉 − 𝑉𝐾) (2.4) 𝐼𝐵𝐾−𝑓𝑎𝑟(𝑉, 𝑐) = 𝑔𝐵𝐾−𝑓𝑎𝑟𝑏𝑘𝑓(𝑉 − 𝑉𝐾) (2.5)
𝐼𝐵𝐾−𝑛𝑒𝑎𝑟(𝑉, 𝑐𝑑𝑜𝑚) = 𝑔𝐵𝐾−𝑛𝑒𝑎𝑟𝑏𝑘𝑛(𝑉 − 𝑉𝐾) (2.6) 𝐼𝑁𝑆(𝑉) = 𝑔𝑁𝑆(𝑉 − 𝑉𝑁𝑆) (2.7) 𝑑𝑛 𝑑𝑡 = 𝑛∞(𝑉) − 𝑛 𝜏𝑛 (2.8) 𝑥∞(𝑉) = 1 1 + 𝑒( 𝑣𝑥−𝑉 𝑠𝑥 ) , 𝑥 = 𝑛, 𝑚, 𝑟 (2.9) 𝑑𝑏𝑘𝑛 𝑑𝑡 = 𝑏𝑘𝑛∞(𝑉, 𝑐𝐷𝑂𝑀) − 𝑏𝑘𝑛 𝜏𝑏𝑘𝑛 (2.10) 𝑑𝑏𝑘𝑓 𝑑𝑡 = 𝑏𝑘𝑓∞(𝑉, 𝑐) − 𝑏𝑘𝑓 𝜏𝑏𝑘𝑓 (2.11) 𝑏𝑘𝑛∞(𝑉, 𝑐𝐷𝑂𝑀) = 1 1 + exp−(𝑉 − 𝑉𝑏𝑘−𝑛𝑒𝑎𝑟𝑘 (𝑐𝐷𝑂𝑀)) 𝑏𝑘 (2.12) 𝑏𝑘𝑓∞(𝑉, 𝑐) = 1 1 + exp− (𝑉 − 𝑉𝑘𝑏𝑘−𝑓𝑎𝑟(𝑐)) 𝑏𝑘 (2.13) 𝑉𝐵𝐾−𝑛𝑒𝑎𝑟(𝑐𝐷𝑂𝑀) = 𝑉𝐵𝐾0− 𝑘𝑠ℎ𝑖𝑓𝑡 ln 𝑐𝐷𝑂𝑀 𝑘𝐶𝑎𝐵𝐾−𝑛𝑒𝑎𝑟 (2.14) 𝑉𝐵𝐾−𝑓𝑎𝑟(𝑐) = 𝑉𝐵𝐾0− 𝑘𝑠ℎ𝑖𝑓𝑡ln 𝑐 𝑘𝐶𝑎𝐵𝐾−𝑓𝑎𝑟 (2.15) 𝑐𝐷𝑂𝑀= −𝐴𝐼𝐶𝑎−𝐿(𝑉) (2.16) 𝑑𝑐 𝑑𝑡 = −𝑓(𝛼𝐼𝐶𝑎+ 𝑘𝑐𝑐) (2.17)
CORTICOTROPH MODEL
There are six ionic currents in the model, ICaL is the high voltage activated L-type
Ca2+ current, I
Kdr is the rapidly activated delayed rectifier K+ current, IBK-near is the
large-conductance, voltage and Ca2+-activated K+ channels located near Ca2+
channels and respond to Ca2+ in microdomains. I
BK-far channels are located away from
Ca2+ channels and respond to the mean cytosolic Ca2+ concentration. I
Kir is the inward
rectifier K+ current that activates under hyperpolarization. Also, I
ns in the model is a
current produced by non-selective-cation channels. n is the gating variable for the activation of IKdr current. 𝑥∞(𝑉) shows the steady-state functions.
The gating variables for the near and far populations of BK channels with the equilibrium functions are shown with the bkn and bkf equations. Here Cadom is the
free Ca2+ concentration in a microdomain and c is the mean free cytosolic Ca2+
concentration.
Table 1. Parameter values
Parameters Values Parameter Value
gCa−L 1.8 nS (basal), 2.2 nS (CRH) kCaBK−near 18 μM (basal), 6 μM (CRH) gNS 0.1 nS (basal), 0.2 nS (AVP) kCaBK−far 0.6 μM gK 8.2 nS kbk 1 mV gK−ir 1 nS sm 10 gBK−near 2 nS sn 10 gBK−far 1 nS sr -1 VCa 60 mV VBK0 0.1 mV VNS -10 mV kshift 20 VK -75 mV A 0.15 𝑣r -60 mV 𝑘𝑐 0.12 μM
𝑣m -20 mV f 0.01 𝑣n -5 mV 𝛼 0.0015 τbkn 20 ms (basal), 4 ms (CRH) σN 5 pA τbkf 4 ms Cm 6 nF
Bifurcation and continuation analysis was conducted in PyDSTool, PYTHON based tool for simulating and analyzing dynamical systems. One and two-parameter bifurcation diagrams were constructed using AUTO within PyDSTool [12].
3. Results
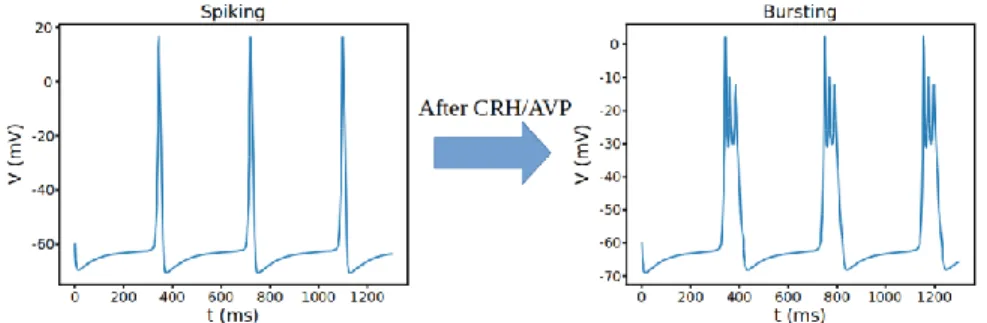
We can apply numerical continuation to each rate constants and dynamic parameters for currents to determine which oscillations appear or disappear and how these transitions between a stable and unstable steady state happens ([13], [14], [15], [16], [17]). But experimentally making these changes mostly impossible. In the original paper [2], authors saw that making the BK-near channels similar to BK-far channels by reducing the time constant and right-shifting its activation curve was sufficient to convert spiking to bursting without the need to make any other changes but how this transition happens is unknown. Also, with the dynamic clamp study, it has been shown that BK-near channel conductance induces bursting in pituitary cells [18]. Given the difficulty of teasing apart the system experimentally, understanding the dynamic mechanisms behind these transitions and responsible parameters are important because this will give us the reason for the changes after stress hormone regulation. These shifts in excitability is regulated by two hormones CRH and AVP that cause corticotrophs to respond differently to various stressors. Figure 1 shows an example of the temporal variations of the voltage 𝑉 as obtained by simulating the cell model under conditions where it exhibits a characteristic spiking (Fig. 1a) and bursting (Fig. 1b) dynamics after the stimulation with CRH/AVP. Understanding the dynamic mechanisms under these shifts between resting, spiking and bursting is important because these results will give us applicable predictions on stress
CORTICOTROPH MODEL
regulation. Therefore, we begin by investigating the changes between spiking and bursting behavior for the experimentally observed parameters in section 3.1 first and then we will analyze the transitions between resting, spiking and possible bursting states in section 3.2 with all conductances using bifurcation analysis.
Figure 1. Spiking and bursting patterns of the corticotroph model respectively. Parameter differences are as follows: Spiking (𝜏𝑏𝑘𝑛 = 20, 𝑔𝑁𝑆= 0.1, 𝑔𝐶𝑎= 1.8, 𝑘𝐶𝑎𝐵𝐾−𝑛𝑒𝑎𝑟 = 18),
Bursting (𝜏𝑏𝑘𝑛 = 4, 𝑔𝑁𝑆= 0.2, 𝑔𝐶𝑎= 2.2, 𝑘𝐶𝑎𝐵𝐾−𝑛𝑒𝑎𝑟= 6).
3.1 Bifurcation analysis for bursting parameters 𝑘𝐶𝑎𝐵𝐾−𝑛𝑒𝑎𝑟 and 𝜏𝑏𝑘𝑛
In order to investigate the contribution of BK-channel dynamics to the overall dynamics and characterize bifurcation types in the model, BK-far and BK-near conductances (𝑔𝐵𝐾−𝑛𝑒𝑎𝑟 and 𝑔𝐵𝐾−𝑓𝑎𝑟)are investigated first but no bifurcation is
observed. That means that BK channel conductances are not responsible for the bursting but the parameters for the channel dynamics are. Moreover, two important parameters responsible for bursting are: time constant of the BK-near channel 𝜏𝑏𝑘𝑛 and activation parameter 𝑘𝐶𝑎𝐵𝐾−𝑛𝑒𝑎𝑟 values, during spiking and bursting regime are
3.1.1 Bifurcation for the BK-channel activation curve parameter ‘𝑘𝐶𝑎
𝐵𝐾−𝑛𝑒𝑎𝑟’ during spiking regime
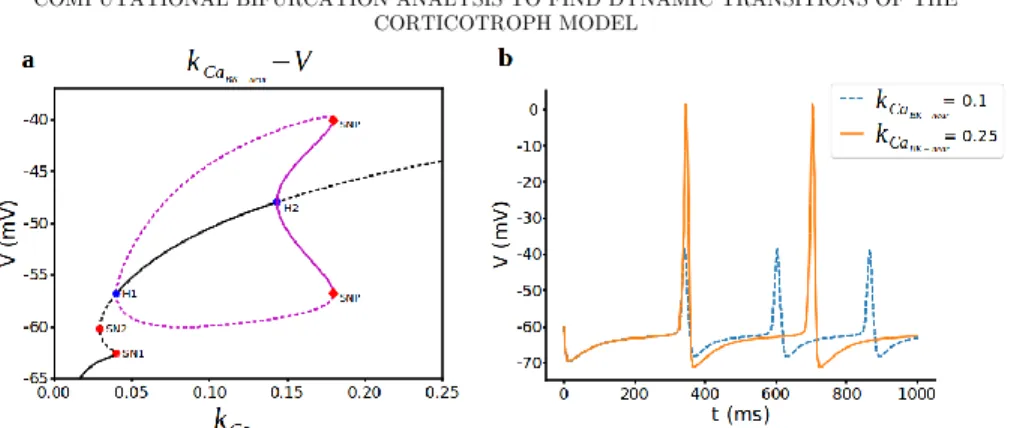
We start our analysis of the bifurcation structure for spiking regime, the parameter values used here are: 𝜏𝑏𝑘
𝑛= 20, 𝑔𝑁𝑆= 0.1, 𝑔𝐶𝑎= 1.8. Fig. 2 shows the bifurcation diagram of the spiking regime (a) and some voltage traces with different values of 𝑘𝐶𝑎𝐵𝐾−𝑛𝑒𝑎𝑟. There are two Hopf bifurcations, two saddle-node bifurcations and one
saddle node on periodic orbit bifurcations as a result of numerical continuation with respect to 𝑘𝐶𝑎𝐵𝐾−𝑛𝑒𝑎𝑟 parameters. For the small values of 𝑘𝐶𝑎𝐵𝐾−𝑛𝑒𝑎𝑟 parameter, the bottom branch of the steady states are stable nodes and the stability lost with the first saddle-bode bifurcation (SN1) at 𝑘𝐶𝑎
𝐵𝐾−𝑛𝑒𝑎𝑟 = 0.039949 leading to a branch of saddles which again turns around at another saddle-node bifurcation (SN2) 𝑘𝐶𝑎𝐵𝐾−𝑛𝑒𝑎𝑟 = 0.03, before regaining stability again via a subcritical Hopf
bifurcation. Subthreshold oscillations (Fig. 2b blue dashed line) start at subcritical Hopf point H1 at 𝑘𝐶𝑎𝐵𝐾−𝑛𝑒𝑎𝑟 = 0.39944 where unstable steady states turn into stable ones with the rise of unstable periodic branch and ends with supercritical Hopf bifurcation point H2 at 𝑘𝐶𝑎
𝐵𝐾−𝑛𝑒𝑎𝑟 = 0.1434 where these stable steady states lost their stability. Here at saddle-node bifurcation of periodic solutions (SNP) at 𝑘𝐶𝑎𝐵𝐾−𝑛𝑒𝑎𝑟 = 0.179, unstable periodic orbits also become stable ones. Here the
branch of stable periodic spiking solutions emanating from the H2 grows in amplitude and period with increasing 𝑘𝐶𝑎𝐵𝐾−𝑛𝑒𝑎𝑟 parameter. Subthreshold
oscillations grow in amplitude and become regular spiking that can be seen in Fig. 2b (orange line). This suggests that for the slow activation of 𝑏𝑘𝑛𝑒𝑎𝑟 channels (𝜏𝑏𝑘𝑛 = 20), shifting activation curve right or left by changing 𝑘𝐶𝑎𝐵𝐾−𝑛𝑒𝑎𝑟 does not
have any physiological role as promoting bursting, instead it only increases the frequency of spiking.
CORTICOTROPH MODEL
Figure 2. Bifurcation analysis for BKnear-activation curve parameter kCaBK−near during spiking regime. a) Bifurcation diagram with kCaBK−near as the bifurcation parameter. Stable
nodes (black line), unstable nodes or saddles (black dashed line), stable periodic orbit (magenta line), unstable periodic orbit (magenta dashed line), bifurcation points (red and blue dots). SN1 saddle node bifurcation 1, SN2 saddle node bifurcation 2, H1 subcritical hopf bifurcation, H2 supercritical hopf bifurcation, SNP saddle-node on periodics bifurcation. b) Representative traces of voltage at different values of kCaBK−near.
3.1.2 Bursting regime and bifurcation for the BK-channel activation curve parameter ‘𝑘𝐶𝑎𝐵𝐾−𝑛𝑒𝑎𝑟’
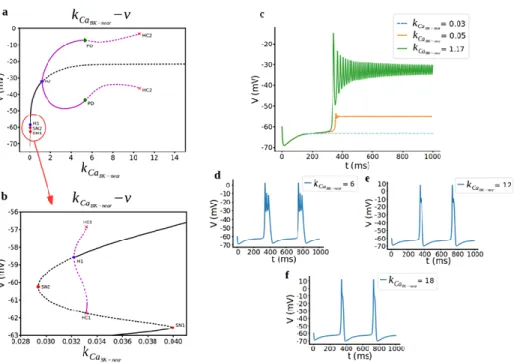
The bifurcation diagram, when 𝜏𝑏𝑘𝑛 = 4 and using 𝑘𝐶𝑎𝐵𝐾−𝑛𝑒𝑎𝑟 again as the bifurcation parameter, is qualitatively different than when 𝜏𝑏𝑘𝑛= 20 (Fig. 3). Saddle-node bifurcations appear the same way and H1 point still rise a subcritical hopf bifurcation but there is a homoclinic bifurcation (HC) now just after the hopf point (Fig. 3b). Oscillations starting here ends with hyperpolarized resting state and with increasing 𝑘𝐶𝑎𝐵𝐾−𝑛𝑒𝑎𝑟 parameter means that shifting the half activation of BK-near channel to the right makes hyperpolarized state rises to higher voltages (Fig. 3c). At H2, supercritical hopf bifurcation starts with periodic branches open to right now and stable periodic branches turn to unstable periodic branches at period doubling bifurcation (PD) (Fig. 3a). There is a fast spiking between this area (Fig. 3c). For further increasing 𝑘𝐶𝑎𝐵𝐾−𝑛𝑒𝑎𝑟, spike doubling behaviour transitions to
bursting as a result of CRH effect as in original model (Fig. 3d). Firstly, number of spikes per burst decreases (Fig. 3e,f) and then the bursting dynamics ends in a
different type of process, referred to as a homoclinic bifurcation. Finally, the periodic solutions disappear via a homoclinic bifurcation (HC) at 𝑘𝐶𝑎𝐵𝐾−𝑛𝑒𝑎𝑟 = 10.612 which the period is infinitely large. In the interval of coexisting stable solutions, the stable manifold of the saddle point defines the boundary of the basins of attraction for the stable node and limit cycle solutions. The basin of attraction for a stable solution represents the set of initial conditions from which trajectories asymptotically approach the solution. When the limit cycle for increasing values of 𝑘𝐶𝑎𝐵𝐾−𝑛𝑒𝑎𝑟 hits its basin of attraction, another limit cycle appears through period doubling bifurcation. The characteristic slowing down of the spiking dynamics as the system approaches the end of the bursting phase observed as in Fig. 3e. The coordinates (𝑘𝐶𝑎𝐵𝐾−𝑛𝑒𝑎𝑟, V) of the bifurcation points are as follows: H1 (0.032, -58.57), SN1 (0.04, -62.5), SN2 (0.03, -60.2), HC1 (0.03, [-56.84, -61,75]), H2 (1.16, -32.26), PD (5.33, [-7.07, -43.72]), HC2 (10.6, [-3.19, -36.3]). As can be seen here, bursting arises due to the rapid rate of BK channel activation since we decrease the 𝜏𝑏𝑘𝑛 from 20 to 4 and our bifurcation analysis shows that this transition is happening with the period doubling bifurcation.
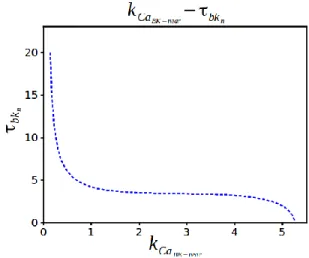
3.1.3 Varying 𝑘𝐶𝑎𝐵𝐾−𝑛𝑒𝑎𝑟 and 𝜏𝑏𝑘𝑛 simultaneously: codimension-2 analysis
As stated while 𝑘𝐶𝑎𝐵𝐾−𝑛𝑒𝑎𝑟 can induce bursting itself, 𝜏𝑏𝑘𝑛 may not be able to induce
bursting by itself. The natural cause of action is thus to investigate what happens as these 2 parameters are varied simultaneously. Due to the complexity of the system, an analytic codimension analysis is impossible. Therefore, a numerical codimension 2 analysis will be enough to see the dynamics once we change both parameters simultaneously. If we vary two parameters, the curves of Hopf bifurcation is given below. We can see there is no oscillatory region between the Hopf points. Bursting regime stays after H2 point and Hopf points getting away from each other with increasing 𝑘𝐶𝑎𝐵𝐾−𝑛𝑒𝑎𝑟. In Fig. 4 we can see clearly that time dependency of the
activation of BK channel alone cannot induce bursting and Hopf bifurcation is not responsible for characterizing the route to bursting.
CORTICOTROPH MODEL
Figure 3. Bifurcation analysis for BKnear-activation curve parameter kCaBK−near during
bursting regime. a,b) Bifurcation diagram with kCaBK−near as the bifurcation parameter.
Stable nodes (black line), unstable nodes or saddles (black dashed line), stable periodic orbit (magenta line), unstable periodic orbit (magenta dashed line), bifurcation points (red and blue dots). SN1 saddle node bifurcation 1, SN2 saddle node bifurcation 2, H1 subcritical hopf bifurcation, H2 supercritical hopf bifurcation, HC1 homoclinic bifurcation 1, HC2 homoclinic bifurcation 2 and PD period doubling bifurcation. c,d,e,f) Representative traces of voltage at different values of kCaBK−near.
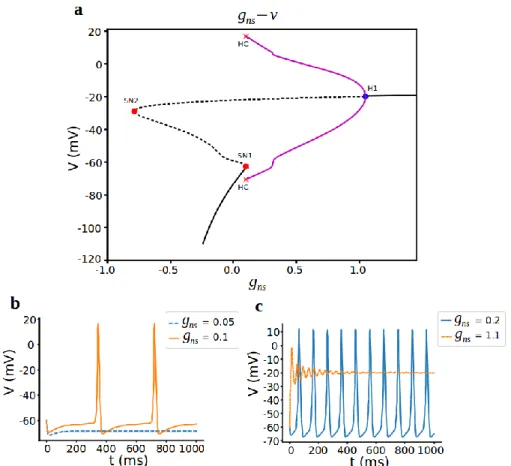
3.2 Dependence of model cell behavior on conductances 3.2.1 Non-selective cation conductance 𝒈𝒏𝒔
Duncan et al. [2] showed that increasing the non-selective cation channel conductance (𝑔𝑛𝑠) only increases spike frequency as a result of AHP effect. Here we examine the bifurcation diagram with respect to 𝑔𝑛𝑠 to see how cell is differing
stabilities according to changing non-selective cation current. Also, it is known that 𝐶𝑎2+ dependent non-selective cation channel may induce bursting in different cells ([19], [20]). The bifurcation diagram using 𝑔𝑛𝑠 as the initial bifurcation parameter is
formed an s-shaped curve of steady states and a curve of periodic orbits (Fig. 5a).
Figure 4. Two-parameter bifurcation diagram for 𝜏𝑏𝑘𝑛 vs. 𝑘𝐶𝑎𝐵𝐾−𝑛𝑒𝑎𝑟.
The lower branch of the s-curve consists of stable nodes which correspond to the hyperpolarized resting state of the cell. Stability is lost via saddle-node bifurcation at (𝑔𝑛𝑠,V) = (0.099, -62.652), and gives rise to a branch of saddles, which forms the
middle and part of the upper branches of the s-curve. From the Fig. 5a, the periodic solutions appearing for low 𝑔𝑛𝑠 via a saddle-node on an invariant circle (SNIC) bifurcation and cell shows regular spiking here (Fig. 5b orange line). The saddle-node bifurcation of equilibrium solutions corresponding to this value of 𝑔𝑛𝑠 is that saddle-node point. This branch of saddles is regaining stability at the supercritical hopf bifurcation at (𝑔𝑛𝑠, V) = (1.047, -19.97). Here, periodic branches disappear and
for increasing 𝑔𝑛𝑠 there remains a branch of stable nodes, corresponding to a depolarized resting state at around -20mV (Fig. 5c orange dashed line).
Indeed, increasing the maximal conductance of non-selective cation channel only increases frequency first (Fig. 5c blue line), then regular spikes turns to subthreshold oscillations and does not induce bursting and cell is either hyperpolarized or
CORTICOTROPH MODEL
depolarized state otherwise. As a result, increasing the non-selective cation conductance did not initiate that transition to bursting for corticotroph cells, but increased burst frequency and decrease amplitude.
Figure 5. Bifurcation analysis for non-selective cation conductance gns. a) Bifurcation diagram with gns as the bifurcation parameter. Stable nodes (black line), unstable nodes or saddles (black dashed line), stable periodic orbit (magenta line), unstable periodic orbit (magenta dashed line), bifurcation points (red and blue dots). SN1 saddle node bifurcation 1, SN2 saddle node bifurcation 2, H1 supercritical hopf bifurcation, HC homoclinic bifurcation. b,c) Representative traces of voltage at different values of gns.
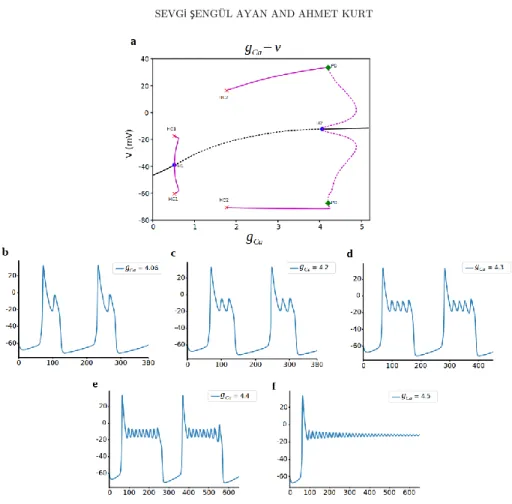
Figure 6. Bifurcation analysis for L-type Ca current conductance 𝑔𝐶𝑎. a) Bifurcation diagram with 𝑔𝐶𝑎 as the bifurcation parameter. Stable nodes (black line), unstable nodes or saddles (black dashed line), stable periodic orbit (magenta line), unstable periodic orbit (magenta dashed line), bifurcation points (red and blue dots). H1 supercritical hopf bifurcation, H2 subcritical hopf bifurcation, HC1 homoclinic bifurcation 1, HC2 homoclinic bifurcation 2, PD period doubling bifurcation. b,c,d,e,f) Representative traces of voltage at different values of 𝑔𝐶𝑎.
3.2.2 L-Type Ca2+-current conductance 𝑔
𝐶𝑎
The possibility of other ionic current to generate the bursting activity is examined by changing the L-type 𝐶𝑎2+ current conductance 𝑔
CORTICOTROPH MODEL
bifurcation diagram where 𝑔𝐶𝑎 is the bifurcation parameter. For the lower values of 𝑔𝐶𝑎, only one stable equilibrium point corresponding to the resting potential exists.
When 𝑔𝐶𝑎 is increased to 0.519, stability is lost via supercritical hopf bifurcation (H1) and stable periodic orbits decreases the hyperpolarized resting state with increasing 𝑔𝐶𝑎. Spiking starts with a creation of periodic orbits at homoclinic
bifurcation (HC2) at 𝑔𝐶𝑎= 1.77 before regaining stability at the subcritical hopf
bifurcation (H2) at 𝑔𝐶𝑎 = 4.06 and switch spiking to bursting activity at this point. Bursting due to the 𝐶𝑎2+ channel was the unexpected and unseen results from the
experiments. Our bifurcation analysis revealed another link to bursting for corticotroph cells that can be tested experimentally. Also, we observe another nice dynamic here. A period doubling bifurcation is associated with the loss of stability of these periodic solutions. In addition, we observe spike adding cascade at this point. As the bifurcation parameter 𝑔𝐶𝑎 increase, the number of spikes per burst grows incrementally until bursting transforms into depolarized state (Fig. 6bcdef). For increasing 𝑔𝐶𝑎 there remains a branch of stable nodes, corresponding to a depolarized resting state of around -10mV. The 𝑔𝐶𝑎 values of the bifurcation points are as follows: H1 (0.519), HC1 (0.52), HC2 (1.77), H2 (4.065), PD (4.21).
Here when we look at the voltage traces, spiking starts at the homoclinic point around 𝑔𝐶𝑎 = 1.8, and before that it is in hyperpolarized state around -65mV. The periodic
branches that starts from H1 only decreases the resting state from -40mV to -65mV.
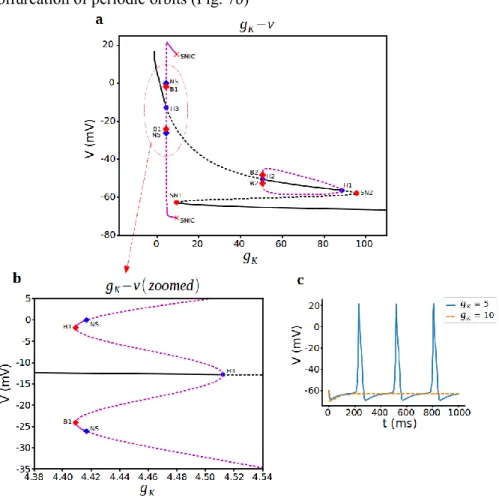
3.2.3 Delayed-rectifier potassium conductance 𝑔𝐾
The potential role of delayed rectifier K+ channels in electrical activity was examined
in various pituitary cells. In GH3 cells, inhibition of this channel increases the
duration of the AP [21] and the amplitude of the spontaneous [Ca2+] transients [22]
but in frog melanotrophs, the delayed rectifier K+ conductance, leads to inhibition of
electrical activity [23]. In rat lactotrophs, on the other hand, does not alter the pattern of AP firing [21]. For the corticotrophs, we examine here with the bifurcation analysis using 𝑔𝐾 as the initial bifurcation parameter with different steady states and a curve of periodic orbits. When we look at the z-shaped curve in Fig. 7a, the lower
values of 𝑔𝐾 consists of stable nodes which correspond to the depolarized resting state of the cell. Stability is lost via a subcritical hopf bifurcation (H3) at (𝑔𝐾,V) =
(4.512, -12.810) and cell starts to spike at this point (Fig. 7c). Unstable periodic orbits of subcritical hopf bifurcation gains stability with bautin bifurcation also known as degenerate hopf bifurcation at B1 point that corresponds to saddle-node bifurcation of periodic orbits (Fig. 7b)
Figure 7: Bifurcation analysis for delayed rectifier K+ current conductance 𝑔
𝐾. a) Bifurcation diagram with 𝑔𝐾 as the bifurcation parameter. Stable nodes (black line), unstable nodes or saddles (black dashed line), stable periodic orbit (magenta line), unstable periodic orbit (magenta dashed line), bifurcation points (red and blue dots). SN1 saddle node bifurcation 1, SN2 saddle node bifurcation 2, H1 subcritical hopf bifurcation 1, H2 supercritical hopf bifurcation 2, H3 subcritical hopf bifurcation 3, HC1 homoclinic bifurcation 1, HC2
CORTICOTROPH MODEL
homoclinic bifurcation 2, B1 Bautin bifurcation 1, B2 Bautin bifurcation 2, NS Neimark-Sacker bifurcation. b,c) Representative traces of voltage at different values of 𝑔𝐾.
In neural networks, bursting can be observed near bautin bifurcation [24] but in our system parameter region is small and this branch of stable orbits lost stability around at another bifurcation point, neimark-sacker bifurcation just after B1. For increasing 𝑔𝐾, there remains a branch of stable nodes corresponding to a spiking state until it
vanishes with SNIC bifurcation at around 𝑔𝐾= 9.455. From the Fig. 7a, the periodic solutions disappearing via a saddle-node on an invariant circle (SNIC) bifurcation. The saddle-node bifurcation of equilibrium solutions corresponding to this value of 𝑔𝐾 is that saddle-node point and cell goes in to hyperpolarized state after this point
(Fig. 7c orange dashed line).
The z-shaped curve of steady-states create different periodic orbits here. The lower branch of the z-curve consists of stable nodes which correspond to the hyperpolarized resting state of the cell and middle unstable steady states turns to stable ones with the creation of unstable periodic orbits with 2 more hopf bifurcations, with one supercritical and the other is subcritical ones. Stable periodic orbits here lost their stability with another bautin bifurcation at B2 just after H2 point. Here again parameter region is so small between H2 and B2 and K+ conductance
values are so big for real cell. As a result, cell stays in hyperpolarized state in that region.
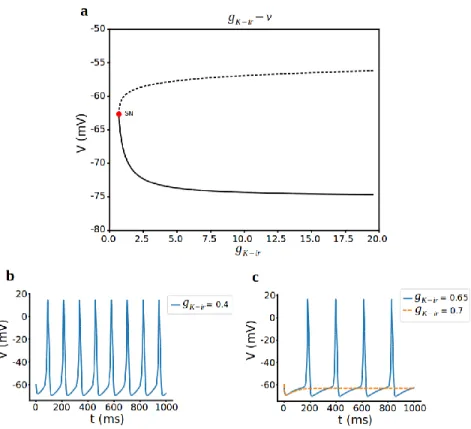
3.2.4 Inward-rectifier Potassium conductance 𝑔𝐾−𝑖𝑟
To complete the full bifurcation analysis in terms of the conductances, lastly, we change inward-rectifier potassium current conductance 𝑔𝐾−𝑖𝑟 while others are intact. We know that 𝐾𝑖𝑟 channels play important roles in the control of resting membrane potential and inhibition of spontaneous electrical activity in pituitary cells [25]. The bifurcation diagram, using 𝑔𝐾−𝑖𝑟 as the bifurcation parameter, is shown in Fig. 8a. The bottom branch of this curve consists of stable nodes, representing the hyperpolarized resting state. There is a saddle-node bifurcation at 𝑔𝐾−𝑖𝑟 = 0.694 and regular spiking occurs before this point (Fig. 8b). For further increasing 𝑔𝐾−𝑖𝑟, firstly spiking slows down (Fig. 8c blue line) and cell turns into hyperpolarized
resting state (Fig. 8c orange dashed line) means that it does not have enough 𝐶𝑎2+
to fire the action potential anymore. As we can see here, inward rectifier K+ channel
does not promote bursting for corticotroph cells instead decrease in frequency of spiking and spiking to resting state transfer can be achieved with 𝐾 − 𝑖𝑟 channel.
Figure 8. Bifurcation analysis for inward rectifier K+ current conductance 𝑔𝐾−𝑖𝑟. a) Bifurcation diagram with 𝑔𝐾−𝑖𝑟 as the bifurcation parameter. Stable nodes (black line), unstable nodes or saddles (black dashed line), SN saddle node bifurcation. b,c) Representative traces of voltage at different values of 𝑔𝐾−𝑖𝑟.
CORTICOTROPH MODEL
4. Discussion
4.1 Spiking Dynamics
The corticotroph model that the author defined in the previous work is used for the numerical bifurcation analysis to understand the dynamics under the transition between resting, spiking and bursting behavior. We show that corticotroph cells turn from silent phase to spiking phase with different bifurcation structures with the dynamic parameters of BK-channel dynamics (𝑘𝐶𝑎𝐵𝐾−𝑛𝑒𝑎𝑟) that is experimentally observed before and conductances. As 𝑘𝐶𝑎𝐵𝐾−𝑛𝑒𝑎𝑟 is increased subthreshold
oscillations emerge in the model at subcritical Hopf point. Subthreshold oscillations grow in amplitude and become regular spiking through saddle-node bifurcation of periodic solutions bifurcation. We observe that cell does not turn back to resting with the activation parameter of BK-channels.
The analysis shows that increasing 𝑔𝑛𝑠, 𝑔𝐾 and 𝑔𝐾−𝑖𝑟 channel conductances shifts cell from resting to spiking through hopf bifurcations and rheobases are formed from saddle-node bifurcations. Here while increasing 𝑔𝑛𝑠 turns the cell into depolarized state, increasing 𝑔𝐾 and 𝑔𝐾−𝑖𝑟 conductances shift the cell into hyperpolarized state. As a result of our bifurcation analysis with L-type Ca2+ current conductance 𝑔
𝐶𝑎,
spiking starts with a creation of periodic orbits at homoclinic bifurcation, not hopf bifurcation as the other conductances. But the most important result was this spiking phase does not turn to resting instead we observe bursting behavior as explained in 4.2.
4.2 Bursting Dynamics
Given the importance of bursting activity in excitable cells, it is important to identify the key mechanisms underlying it. Experimental findings have shown that the intrinsic bursting of corticotroph cells is driven by BK- channels. But what kind of dynamic changes happens during the bursting was unknown. In this study we observed that BK channel conductances does not promote any dynamic changes for
the cell instead shifting activation curve by 𝑘𝐶𝑎
𝐵𝐾−𝑛𝑒𝑎𝑟 parameter was responsible together with activation time parameter 𝜏𝑏𝑘𝑛 when BK-near channel dynamics was fast. During the slow activation of BK-near channels (𝜏𝑏𝑘𝑛 = 20), shifting activation curve right or left by changing 𝑘𝐶𝑎𝐵𝐾−𝑛𝑒𝑎𝑟 does not have any physiological role as promoting bursting, instead it only increases the frequency of spiking.
As can be seen here, first bursting arises due to the rapid rate of BK channel activation since we decrease the 𝜏𝑏𝑘𝑛 from 20 to 4 and transition is happening with the period doubling bifurcation and ends with homoclinic bifurcation. So, in our system the Hopf bifurcation is not relevant for characterizing the route to bursting but period doubling and homoclinic bifurcations are. Period-doubling bifurcation to chaos were discovered in spontaneous firings of Onchidium pacemaker neurons [26] before. In our system, the actual route depends on the relative location of the full-system’s fixed point with respect to a homoclinic bifurcation. Stress regulation due to BK-channel is also observed experimentally [2] and in our study, we showed how this transition happens. But unexpected result is observed with L-type Ca2+ current.
Hopf bifurcation that turns cell into spiking for other conductances in the model, for increasing 𝑔𝐶𝑎 turns the cell into bursting phase this time. The bifurcation analysis conducted here revealed another link to stress regulation through Ca2+ channel alone
and this can give us an experimentally tested prediction from the model [27,28] and computational analysis.
5. Conclusion
Bifurcation analysis with numerical continuation algorithm is applied to the considered model in order to examine its dynamical states. Characterizing the bifurcation structure for BK-channel parameters and conductances in corticotroph model to investigate the spiking and bursting regime in the system provides insight about the parameter dependence of the model dynamics. We have identified various routes from resting to spiking to bursting including Hopf bifurcations, SNIC or homoclinic bifurcations, period doubling and spike adding cascades. Also, our work shows that dynamical systems theory provides an efficient tool for examination of
CORTICOTROPH MODEL
self-regulation of a full model of the neuroendocrine system. The results of our computational investigations may be used as a lead for designing experiments.
References
[1] Hodgkin, A. L., Huxley, A. F., “A quantitative description of membrane current and its application to conduction and excitation in nerve”, Journal of Physiology, 117(4) (1952) 500–544.
[2] Duncan, P. J., Sengul, S., Tabak, J., Ruth, P., Bertram, R., Shipston, M. J., “Large conductance Ca2+-activated K+ channels (BK) promote secretagogue-induced transition from spiking to bursting in murine anterior pituitary corticotrophs”, Journal of Physiology, 593(5) (2015) 1197–1211.
[3] Murphy, H., Jaafari, H., Dobrovolny, H. M., “Differences in predictions of ODE models of tumor growth: a cautionary example”, BMC Cancer, 16 (2016) 163. [4] Mary Celin Sharmila, D., Praveen, T., Rajendran, L., “Mathematical Modeling and Analysis of Nonlinear Enzyme Catalyzed Reaction Processes”, Journal of Theoretical Chemistry, (2013) 2013:7.
[5] Schaff, J. C., Gao, F., Li, Y., Novak, I. L., Slepchenko, B. M., “Numerical Approach to Spatial Deterministic-Stochastic Models Arising in Cell Biology”, PLoS Comput Biol., 12(12) (2016) e1005236.
[6] Rinzel, J., A Formal Classification of Bursting Mechanisms in Excitable Systems, Springer Berlin Heidelberg, 1987.
[7] Sherman, A., “Dynamical systems theory in physiology”, The Journal of General Physiology, 138(1) (2011) 13–19.
[8] Strogatz, S. H., Nonlinear Dynamics and Chaos, Addison-Wesley Publishing Company, 2001.
[9] Morris, C., Lecar, H., “Voltage oscillations in the barnacle giant muscle fiber”, Biophys J., 35(1) (1981) 193–213.
[10] Plant, R. E., Kim, M., “Mathematical descriptions of a bursting pacemaker neuron by a modification of the Hodgkin-Huxley equations”, Biophys. J., 16(3) (1976) 227–244.
[11] Braun, H. A., Bade, H., Hensel, H., “Static and dynamic discharge patterns of bursting cold fibers related to hypothetical receptor mechanisms”, Pflügers Arch., 386(1) (1980) 1–9.
[12] Clewley, R. H., Sherwood, W. E., Lamar, M. D., Guckenheimer, J. M., “PyDSTool, a software environment for dynamical systems modeling, URL=http://pydstool.sourceforge.net”, (2007).
[13] Atherton, L. A., Prince, L. Y., Tsaneva-Atanasova, K., “Bifurcation analysis of a two-compartment hippocampal pyramidal cell model”, J Comput Neuroscience, 41 (2016) 91–106.
[14] Ananthkrishnan, N., Gupta, N. K., Sinha, N. K., “Computational Bifurcation Analysis of Multiparameter Dynamical Systems”, Journal of Guidance Control and Dynamics, 32(5) (2009) 1651-1653.
[15] Tsaneva-Atanasova, K., Osinga, H. M., Rieb, T., Sherman, A., “Full System Bifurcation Analysis of Endocrine Bursting Models”, J Theor Biol., 264(4) (2010) 1133–1146.
[16] Čupić, Z., Marković, V. M., Maćešić, S., Stanojević, A., Damjanović, S., Vukojević, V., Kolar-Anić, L., “Dynamic transitions in a model of the hypothalamic-pituitary-adrenal axis”, Chaos, 26(3) (2016) 033111.
[17] Takahashi, A., Kitajima H., Yazawa, T., “Bifurcation Analysis for Early Afterdepolarization in Shannon Model”, International Symposium on Nonlinear Theory and Its Applications, NOLTA2016, Yugawara, Japan, (2016).
[18] Tabak, J., Tomaiuolo, M., Gonzalez-Iglesias, A. E., Milescu, L. S., Bertram, R., “Fast activating voltage- and calcium-dependent potassium (BK) conductance promotes bursting in pituitary cells: a dynamic clamp study”, J Neurosci, 31(46) (2011) 16855–16863.
[19] Mrejeru, A., Wei, A., Ramirez, J. M., “Calcium-activated non-selective cation currents are involved in generation of tonic and bursting activity in dopamine neurons of the substantia nigra pars compacta”, J Physiol, 589(Pt 10): (2011) 2497–2514.
[20] Partridge, L. D., Müller, T. H., Swandulla, D., “Calcium-activated non-selective channels in the nervous system”, Brain Research Reviews, 19(3) (1994) 319-325.
CORTICOTROPH MODEL
[21] Sankaranarayanan, S., Simasko, S. M., “Potassium channel blockers have minimal effect on repolarization of spontaneous action potentials in rat pituitary lactotropes”, Neuroendocrinology, 68 (1998) 297–311.
[22] Charles, A. C., Piros, E. T., Evans, C. J., Hales, T. G., “L-type Ca2+ channels and K+ channels specifically modulate the frequency and amplitude of spontaneous Ca2+ oscillations and have distinct roles in prolactin release in GH3 cells”, J Biol Chem., 274(11) (1999) 7508–7515.
[23] Mei, Y. A., Soriani, O., Castel, H., Vaudry, H., Cazin, L., “Adenosine potentiates the delayed-rectifier potassium conductance but has no effect on the hyperpolarization-activated Ih current in frog melanotrophs”, Brain Res, 793(1-2) (1998) 271–278.
[24] Song, Z., Xu, J., “Bursting near bautin bifurcation in a neural network with delay coupling”, Int. J. Neur. Syst., 19(5) (2009) 359-373.
[25] Stojilkovic, S. S., “Pituitary cell type-specific electrical activity, calcium signaling and secretion”, Biol Res., 39(3) (2006) 403-423.
[26] Jia, B., Gu, H., Li, L., Zhao, X., “Dynamics of period-doubling bifurcation to chaos in the spontaneous neural firing patterns”, Cogn Neurodyn, 6(1) (2012) 89-106.
[27] Zemkova, H., Tomić, M., Kucka, M., Aguilera, G.,Stojilkovic, S.S., “Spontaneous and CRH-induced excitability and calcium signaling in mice corticotrophs involves sodium, calcium, and cation-conducting channels”, Endocrinology, 157(4) (2016) 1576–1589.
[28] Shipston, M., “Control of anterior pituitary cell excitability by
calcium-activated potassium channels”,Mol Cell Endocrinol., 463 (2018) 37-48.
Current Address: Sevgi ŞENGÜL AYAN: Antalya Bilim University, Antalya TURKEY
E-mail Address: [email protected] ORCID: https://orcid.org/0000-0003-0083-4446
Current Address: Ahmet KURT: Antalya Bilim University, Antalya TURKEY E-mail Address: [email protected]