http://journals.tubitak.gov.tr/biology/ © TÜBİTAK
doi:10.3906/biy-1712-46
Comparison of a ceramidase inhibitor (ceranib-2) with C2 ceramide and cisplatin on
cytotoxicity and apoptosis of glioma cells
Gökhan KUŞ1,*, Mete ÖZKURT2, Pınar ÖZTOPCU VATAN3, Nilüfer ERKASAP2, Ruhi UYAR2, Selda KABADERE2
1Department of Health Programs, Open Education Faculty, Anadolu University, Eskişehir, Turkey 2Department of Physiology, Faculty of Medicine, Eskişehir Osmangazi University, Eskişehir, Turkey 3Department of Biology, Faculty of Arts and Sciences, Eskişehir Osmangazi University, Eskişehir, Turkey
1. Introduction
Grade IV astrocytoma or glioblastoma multiforme (GBM) is an aggressive brain tumor. Although important improvements furthered the conventional treatment of GBM in recent decades, median survival of GBM patients is still approximately 2 years (Jemal et al., 2009). Sphingolipids are a major group of membrane lipids that have important functions in a variety of cellular processes including proliferation, growth, or cell death. The level of such metabolites of sphingomyelin, a kind of sphingolipid in cell membranes, is changed by a large number of factors including chemotherapy, genotoxic stress, radiation, growth factors, environmental stress, hormones, and cytokines. Ceramide, sphingosine, sphingosine-1-phosphate (S1P), and dihydroceramide are important members of those bioactive sphingolipids. Most of these metabolites contribute to signal transduction pathways that regulate cell growth, differentiation, death, and apoptosis (Viani et al., 2003; Oskouian et al., 2010). Besides controlling sphingolipid signaling, ceramidase enzyme lowers the level of ceramide and concomitantly
increases S1P and other bioactive metabolites (Realini et al., 2016). Thus, ceramidase inhibitors that stop ceramide catabolism or its conversion to other molecules have been developed as cancer therapeutics. For example, levels of ceramidase were found to be high in different cancer types (Seelan et al., 2000; Strelow et al., 2000; Osawa et al., 2005; Xu et al., 2006; Proksch et al., 2011). As a key regulator, the equilibrium between S1P and ceramide levels can regulate growth, differentiation, cell division, and apoptosis in different cancer cell types (Oskouian et al., 2010). Therefore, loss of balance between S1P and ceramide might be very important in the determination of cell fate. Based on this, we previously demonstrated that prostate cancer cells were inclined to apoptosis and cell death occurred when they were treated with a ceramidase inhibitor, namely ceranib-2 (Kus et al., 2015). For these reasons, we aimed to examine the possible role of ceranib-2 on growth and apoptosis of a normal glia cell line and three glioma cell lines, and also to compare the outcomes with the effects of C2 ceramide and cisplatin, a conventional anticancer drug.
Abstract: Inhibiting ceramidase activity in cancer cells has been identified as a promising target for cancer therapy in recent studies. Thus, we examined the possible role of ceranib-2, a novel ceramidase inhibitor, on growth and apoptotic mechanisms of the human normal glia cell line (HNA), human glioma cell lines (T-98G and U-87MG), and a rat glioma cell line (C6). We also compared the results with the effects of C2 ceramide and cisplatin. We determined the in vitro survival rate with MTT assay, apoptosis with flow cytometry, gene expressions with qRT-PCR, and statistical significance by one-way analysis of variance together with Tukey’s test. Calculated from MTT outcomes, the inhibitory ranking was as follows: T-98G > U-87MG > C6 > HNA. Ceranib-2 had the most growth-suppressive activity on human T-98G cells with an IC50 of 7 µM for 24 h and 0.9 µM for 48 h. Only the 25 µM dose of ceranib-2 induced apoptosis of human T-98G and U-87MG cells after 24 h of treatment; however, it increased apoptosis of C6 cells dose- and time-dependently. Ceranib-2 increased the cytochrome c gene expression level during 24 h in T-98G cells. Ceranib-2 had cytotoxic and apoptotic effects on glioma cells but the cytotoxic effect was weaker on normal glia cells. This cytotoxicity was stronger than that of C2 ceramide and cisplatin.
Key words: Ceranib-2, C2 ceramide, cisplatin, apoptosis, glioma
Received: 18.12.2017 Accepted/Published Online: 24.04.2018 Final Version: 13.06.2018 Research Article
2. Materials and methods 2.1. Cell culture
Human glioma cell lines (T-98G, CRL-1690, up to 5 passages; U-87MG, HTB-14, up to 5 passages) and a rat glioma cell line (C6, CCL-107, up to 5 passages) were bought from the American Type Culture Collection. Normal human astrocytes (NHAs, CC-2565, up to 3 passages) were purchased from Lonza. The cells were grown in a complete medium recommended by the supplier in a humidified incubator containing 5% CO2 at 37 °C. Ceranib-2, C2 ceramide (Cayman), and cisplatin (Sigma) were dissolved in dimethyl sulphoxide (DMSO, Sigma) and diluted in Dulbecco’s modified Eagle’s medium (DMEM). The final concentrations of each drug ranged from 0.1 to 50 µM. C2 ceramide and cisplatin were used as positive controls.
2.2. Experimental groups
Control: Had only complete medium containing DMEM supplemented with 10% fetal calf serum (Sigma) and 1% penicillin-streptomycin solution (Sigma).
DMSO group: Final 0.1% DMSO (solvent) in complete medium.
Cisplatin group: Treated with 0.1, 1, 5, 10, 25, and 50 µM cisplatin for 24 or 48 h.
C2 ceramide group: C2 ceramide at the doses of 0.1, 1, 5, 10, 25, and 50 µM applied for 24 or 48 h.
Ceranib-2 group: Treated with 0.1, 1, 5, 10, 25, and 50 µM ceranib-2 for 24 or 48 h.
2.3. MTT assay
Cytotoxic effects of the drugs were evaluated by using the 3-(4,5-dimethylthiazol-2-yl)-2,5-diphenyltetrazolium bromide thiazolyl blue (MTT) colorimetric method (Mosmann, 1983; Oztopçu et al., 2004). Briefly, cells were inoculated into 96-well plates with 1 × 10⁴ cells
per well and exposed continuously to the above range of concentrations of the drugs for 24 and 48 h. Each well was then treated with 1:10 MTT solution (5 mg/mL) and the culture plates were incubated further for at least 3 h. The medium in each well was then changed with 100 µL of DMSO and mixed thoroughly for 5–10 min at room temperature. The quantity of purple formazan, which is produced by metabolically active cells and represents the number of viable cells, was measured by using a plate-reading spectrophotometer (BioTek).
2.4. Apoptosis assay
Various methods have been developed to differentiate live cells from early and late apoptotic cells and necrotic cells. By using an apoptosis assay kit (Invitrogen), the cells (T-98G, U-87MG, and C6) were first double-stained with annexin V/FITC plus propidium iodide (PI) and then the percentage of dead cells was determined with a flow cytometer. Flow cytometric analysis was done with a
FACSCalibur equipped with CellQuest Pro software (Park et al., 2015).
2.5. Quantitative real-time polymerase chain reaction (q-RT PCR) assay
After collecting the cells, the High Pure RNA Isolation Kit (Roche Diagnostics) was used for total RNA isolation. RNA was collected in elution buffer of the same kit and stored at –80 °C until analysis. The optical density at 260 nm (NanoDrop 1000, Thermo Scientific) was measured for analyzing the concentration of total RNA. cDNA was synthesized with 1000 ng of total RNA from each sample by using a reverse transcriptase cDNA synthesis kit (Roche Diagnostics). Using beta-actin (forward: CAACCGTGAGAAGATGACTCAGA, reverse: CCCAGAGTCCATGACAATACCA) as a reference gene, the abundance of cytochrome c (forward: ACATCGTGCGAGCTAGGC, reverse: CTCGCAGTAGCCCGTGAG) mRNA was determined. FAM-labeled primers/probes of the reference gene and the target genes’ probes were amplified in 0.2-mL PCR tubes containing 1 µL of primer, 10 µL of master mix, 4 µL of RNAse-free water, and 5 µL of cDNA sample. Amplification was determined using Dual Label TaqMan probes and the measurements were done with a Roche Nano LightCycler. Data were analyzed by relative quantification method with 2–ΔΔct calculations.
2.6. Statistical analysis
First one-way analysis of variance and then Tukey’s multiple comparison tests were applied for statistical significance. P < 0.05 was considered as significant. The MTT data and apoptotic values were expressed as percentage of cells. At least three independent experiments were carried out for each group.
3. Results 3.1. MTT results
Cisplatin at concentrations of 0.1, 1, 5, and 10 µM did not change the survival rates of T-98G cells after 24 or 48 h of incubation, but with 25 and 50 µM doses, the rates of dead T-98G cells versus control were about 28% and 29% after 24 h and 34% and 40% after 48 h, respectively (Table 1). At lower concentrations, 0.1 and 1 µM cisplatin did not change the survival rates of U-87MG after 24 or 48 h of incubation. However, treatment of U-87MG cells with 5, 10, 25, and 50 µM cisplatin diminished the cell survival rate versus the control at 22% (P < 0.05), 46%, 54%, and 60% (P < 0.001) after 24 h and at 30%, 54%, 58%, and 61% (P < 0.001) after 48 h, respectively (Table 1). Similarly, 0.1, 1, and 5 µM cisplatin did not affect the survival rates of C6 cells after 24 or 48 h of incubation and 10, 25, and 50 µM cisplatin killed C6 cells compared to the control by 8% (P < 0.05), 30%, and 36% for 24 h and 17%, 65%, and 71%
for 48 h, respectively (Table 1). At 0.1, 1, 5, and 10 µM, C2 ceramide did not show any significant activity on survival of T-98G cells after 24 or 48 h of incubation, but 25 and 50 µM ceramide diminished the living cell numbers by 21% and 58% (P < 0.001), respectively, for 24 h. After 48 h of incubation, C2 ceramide at 25 and 50 µM diminished the cell number of T-98G glioma by 26% and 75% (P < 0.001), respectively (Table 1). C2 ceramide at the doses of 0.1 and 1 µM did not cause any significant change in the survival rate of U-87MG cells after 24 and 48 h of incubation. After applying C2 ceramide at 5, 10, 25, and 50 µM, the viability of U-87MG was lessened by 14%, 22%, 36%, and 86% for 24 h and by 10%, 31%, 34%, and 95% for 48 h, respectively (Table 1). Treatments with 0.1, 1, 5, and 10 µM C2 ceramide did not change the survival of C6 cells; however, at 25 and 50 µM C2 ceramide decreased survival rates by 11% and 47% after 24 h, respectively. After 48 h of treatment, with
all doses of C2 ceramide the corresponding percentages of dead C6 cells were 15%, 17%, 17%, 20%, 27%, and 88% (P < 0.001 for all), respectively. At the end of 48 h of incubation, C2 ceramide induced a clear time- and dose-dependent survival reduction effect on C6 cells. We used human normal glia cell line (HNA) cells as untransformed control cells. Treatments with 0.1, 1, and 5 µM ceranib-2 did not change the viability of HNA cells significantly, but after addition of 10, 25, and 50 µM ceranib-2 to the culture medium, the percentages of dead HNA cells versus the control were 20%, 22%, and 28% after 24 h (Table 1), respectively. Applications of the same six doses of ceranib-2 after 24 h decreased the number of viable T-98G cells by 9% (P > 0.05), 38%, 48%, 53%, 54%, and 61% (P < 0.001); that of U-87MG cells by 2%, 4%, 11%, 59%, 80%, and 82%; and that of C6 cells by 7% (P > 0.05), 15%, 27%, 30%, 31%, and 40% (P < 0.001). Extending the duration of incubation Table 1. Effects of cisplatin, C2 ceramide, and ceranib-2 doses and DMSO (vehicle) on T-98G, U-87MG, and C6 cell survival during 24 or 48 h of treatment. The table also shows 24 h of application of ceranib-2 on HNA cells. *: P < 0.05, **: P < 0.01, ***: P < 0.001.
Applied T-98G cells (%) U-87MG cells (%) C6 cells (%) HNA cells (%) concentrations (µM) 24 h 48 h 24 h 48 h 24 h 48 h 24 h Control 100 100 100 100 100 100 DMSO (vehicle) 100 101 96 99 98 100 0.1 µM cisplatin 101 102 99 94 100 99 1 µM cisplatin 100 100 96 94 99 99 5 µM cisplatin 99 98 78 * 70 *** 99 98 10 µM cisplatin 94 80 54 *** 46 *** 92 * 83 * 25 µM cisplatin 72 ** 66 ** 46*** 42 *** 70 *** 35 *** 50 µM cisplatin 71 ** 60 ** 40 *** 39 *** 64 *** 29 *** Control 100 100 100 100 100 100 DMSO (vehicle) 100 95 97 98 98 95 0.1 µM C2 ceramide 101 102 96 98 101 85 *** 1 µM C2 ceramide 102 101 91 100 101 83 *** 5 µM C2 ceramide 102 100 86 *** 90 *** 99 83 *** 10 µM C2 ceramide 102 102 78 *** 69*** 97 80 *** 25 µM C2 ceramide 79 *** 74 *** 64 *** 66 *** 89 *** 73 *** 50 µM C2 ceramide 42*** 25 *** 14 *** 5 *** 53 *** 12 *** Control 100 100 100 100 100 100 100 DMSO (vehicle) 97 95 97 98 97 95 99 0.1 µM ceranib-2 91 90 98 93 93 93 101 1 µM ceranib-2 62 *** 47 *** 96 90 85 *** 85 *** 99 5 µM ceranib-2 52 *** 40 *** 89 * 85 * 73 *** 70 *** 96 10 µM ceranib-2 47 *** 38 *** 41 *** 38*** 70 *** 61 *** 80 ** 25 µM ceranib-2 46 *** 36 *** 20 *** 17 *** 69 *** 60 *** 78 ** 50 µM ceranib-2 39 *** 30 *** 18 *** 4 *** 60 *** 36 *** 72 ***
of these cells to 48 h further diminished the numbers of T-98G cells by 10% (P > 0.05), 53%, 60%, 62%, 64%, and 70% (P < 0.001); those of U-87MG by 7%, 10%, 15%, 62%, 83%, and 96%; and those of C6 by 7% (P > 0.05), 15%, 30%, 39%, 40%, and 64% (P < 0.001), respectively. Compared to cisplatin and C2 ceramide, ceranib-2 showed survival reduction activity with all six doses used. Ceranib-2 was also less active on HNA cells than all glioma cells (Table 1). 3.2. Apoptotic results
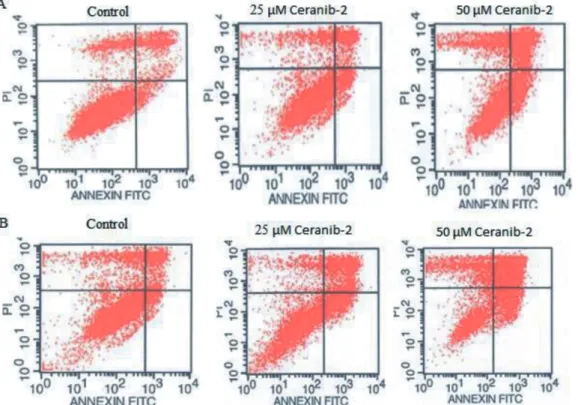
Used as a positive control, C2 ceramide inhibited the viability of all three glioma cell lines (Table 1 and 2) but induced apoptosis only in C6 cells. C2 ceramide at the doses of 25 and 50 µM added to C6 cells for both durations of time caused early apoptotic rates of 15% and 36% and of 12% and 56%, respectively (Table 2). The rates of early apoptotic T-98G cells were about 18% and 21% after applications of 10 and 25 µM ceranib-2 after 24 h (control: 7%), and 18% and 13% for 48 h (control: 6%; Table 3; Figure 1), respectively. Exposed to 10 and 25 µM ceranib-2, early apoptotic results of U-87MG cells were 16% and 37% for 24 h (control: 4%) and 18% and 7% for 48 h (Table 3). According to our MTT results, since ceranib-2 at higher concentrations was cytotoxic to C6 cells, we chose only 25 and 50 µM ceranib-2
doses for the apoptosis assay. After applications of 25 and 50 µM ceranib-2, early apoptotic results of C6 were 8% and 24% (control: 1%) for 24 h and 13% and 52% for 48 h (against a control value of 3%; Table 3).
3.3. PCR results
The gene expression analysis of the effect of 10 and 25 µM ceranib-2 was performed only on T-98G cells. Our PCR results for T-98G cells demonstrated that 10 and 25 µM ceranib-2 induced a small increase of cytochrome c gene expression during 24 h of treatment (P > 0.05, Figure 2). 4. Discussion
In the present study, we used two human glioma cell lines (T-98G and U-87MG), one rat glioma cell line (C6), and one human normal astrocyte cell line (HNA) to determine the cytotoxic and apoptotic roles of ceranib-2 compared to cisplatin and C2 ceramide. Ceranib-2 had the most growth-suppressive activity on T-98G cells with an IC50 of 7 µM for 24 h and 0.9 µM for 48 h. Calculated from MTT results, the inhibitory effects of ceranib-2 were in order of T-98G > U-87MG > C6 > HNA. Interestingly, HNA cells were less susceptible to ceranib-2. Inhibiting ceramidase enzyme, the ceramide level may be increased. Table 2. The influence of C2 ceramide on apoptosis of T-98G, U-87MG, and C6 cells (%) by using annexin V-FITC/PI after 24 or 48 h.
T-98G cells Time (h) Control (%) 10 µM C2 ceramide (%) 25 µM C2 ceramide (%) 50 µM C2 ceramide (%)
Viable cells 24 88 ± 3.2 84 ± 4.6 81 ± 3.2 70 ± 3.3
48 86 ± 4.1 76 ± 5 56 ± 4.9 50 ± 5
Early apoptotic cells 24 5.5 ± 2.1 6 ± 1.7 3 ± 1.7 4 ± 1.8
48 2 ± 1.6 5 ± 1.6 7 ± 1.4 9 ± 1.5
Late apoptotic/necrotic cells 24 6 ± 2.4 12 ± 2.1 13 ± 2.3 20 ± 2.4
48 10 ± 4.3 13 ± 2.4 17 ± 2.5 18 ± 2.5
U-87MG cells Time (h) Control (%) 10 µM C2 ceramide (%) 25 µM C2 ceramide (%) 50 µM C2 ceramide (%)
Viable cells 24 89 ± 4.3 - 88 ± 3.2 88 ± 3.2
48 82 ± 3.2 - 82 ± 4.2 78 ± 4.1
Early apoptotic cells 24 2 ± 1.1 - 2 ± 1.2 2 ± 1.08
48 4 ± 1.9 - 5 ± 1.1 7 ± 2.3
Late apoptotic/necrotic cells 24 5 ± 2 - 5 ± 1 6 ± 1.9
48 9 ± 2.6 - 8 ± 2.2 7 ± 2.3
C6 cells Time (h) control (%) 10 µM C2 ceramide (%) 25 µM C2 ceramide (%) 50 µM C2 ceramide (%)
Viable cells 24 90 ± 5 - 58 ± 4.9 27 ± 2.85
48 88 ± 3.6 - 73 ± 2.5 20 ± 2.3
Early apoptotic cells 24 4 ± 2.1 - 15 ± 2.14 36 ± 4.45
48 5 ± 2.3 - 12 ± 1.68 56 ± 0.47
Late apoptotic/necrotic cells 24 3 ± 2 - 27 ± 3.8 28 ± 4.8
As a result, we detected more cell death with ceranib-2 than even after addition of extra C2 ceramide directly to the culture medium. Therefore, it is clear that ceranib-2 has a stronger growth inhibitory action than not only ceramide but also cisplatin. In this regard, it was reported that ceranib-2 caused reductions in ceramidase activity and survival of ovarian adenocarcinoma cells (SKOV3) (Draper et al., 2011). The same study found that ceranib-2 produced a dose-dependent suppression in tumor growth during in vivo experiments. Similarly, the cytotoxic activity of ceranib-2 on transformed fibroblast cells (5RP7) was detected with an IC50 of 3 µM and these effects were accomplished with indicators of apoptosis such as fragmented nuclei, chromatin condensations, membrane shrinkage, dilated Golgi organelles, lipid accumulation, and extreme mitochondrial degradation (Vejselova et al., 2014). In addition, ceranib-2 and C2 ceramide caused reductions in the viability of LNCaP and DU145 prostate cancer cells (Kus et al., 2015). Interestingly, the same study found that ceranib-2 had more killing potential than additional ceramide in these cell lines. It has been recently indicated in another study that ceranib-2 decreases cell
survival of erythrocytes by triggering cell membrane scrambling and then causing apoptosis (Signoretto et al., 2016).
Apoptosis is the one of the most common ways of physiological cell death in multicellular organisms. Signal molecules require cooperation with a number of proteins, including receptors, enzymes, and gene regulatory proteins. Molecules that induce mitochondrial outer membrane permeabilization and mitochondrial network breakdown, both resulting in cytochrome c release, cause apoptosis-dependent caspase activation (Gorojod et al., 2017). C2 ceramide did not show any apoptotic effect on T-98G and U-87MG cells, but it had an apoptotic effect on rat glioma cells (C6, 56% after 48 h, Table 2). Supporting our results on C6 cells, according to Sawada (2000), exogenous C2 and C6 ceramide stimulated apoptosis of C6 cells, which also augmented the Bax/Bcl-2 and next stimulated caspase-9 and -3 activation followed by cytochrome c release. On the contrary, Kim et al. (2005) mentioned that ceramide stimulated cell death, except apoptosis, and this death was related to accumulation of reactive oxygen species and lipid peroxidation in a different glioma line (A172). They Table 3. The activity of 10, 25, and 50 µM ceranib-2 on apoptosis of T-98G, U-87MG, and C6 cells by using annexin V-FITC/PI after 24 or 48 h.
T-98G cells Time (h) Control (%) 10 µM ceranib-2 (%) 25 µMceranib-2 (%) 50 µMceranib-2 (%)
Viable cells 24 84 ± 5 58 ± 2.4 66 ± 3.1
-48 86 ± 4.3 36 ± 2.8 61 ± 4.2
-Early apoptotic cells 24 7 ± 2.08 18 ± 2.7 21 ± 2.6
-48 6 ± 1.6 18 ± 1.6 13 ± 2.4
-Late apoptotic/necrotic cells 24 9 ± 2.2 12 ± 2.2 9 ± 1.4
-48 12 ± 2.8 38 ± 2.5 21 ± 2.5
-U-87MG cells Time (h) Control (%) 10 µM ceranib-2 (%) 25 µM ceranib-2 (%) 50 µM ceranib-2 (%)
Viable cells 24 86 ± 4.8 50 ± 2.1 30 ± 3.4
-48 83 ± 2.1 50 ± 2.8 10 ± 1.5
-Early apoptotic cells 24 4 ± 1.5 16 ± 1.4 37 ± 2.5
-48 3 ± 1.8 18 ± 2.6 7 ± 1.2
-Late apoptotic/necrotic cells 24 6 ± 2.1 26 ± 3.5 33 ± 2.3
-48 2 ± 0.9 29 ± 2.9 86 ± 3.4
-C6 cells Time (h) Control (%) 10 µM ceranib-2 (%) 25 µM ceranib-2 (%) 50 µM ceranib-2 (%)
Viable cells 24 95 ± 4.9 - 75 ± 3.4 61 ± 3.2
48 87 ± 3.6 - 70 ± 3.2 22 ± 2.8
Early apoptotic cells 24 1 ± 0.5 - 8 ± 2.06 24 ± 3.6
48 3 ± 1.5 - 13 ± 2.4 52 ± 4.1
Late apoptotic/necrotic cells 24 3 ± 1.9 - 17 ± 2.5 10 ± 4.3
also indicated that apoptotic morphological changes could not be determined by the TUNEL immunohistochemical method, DNA staining with Hoechst 33258, or flow cytometric analysis. After comparison to the control, we found that 10 and 25 µM ceranib-2 increased the early apoptotic rate in T-98G and U-87MG cells. This effect was stronger on U-87MG cells. Ceranib-2 at the doses of 25 and 50 µM also induced a dose-dependent early apoptosis of C6 cells, at 52% for 48 h (Table 1). PCR data of the current study indicated that cytochrome c mRNA expression level was slightly raised by both 10 and 25 µM concentrations for T-98G during 24 h, but this change was not significant. The increasing of apoptosis of glioma cells, and especially T-98G cells, after treatment with ceranib-2 may be due to the cytochrome c level rising. Similar to our ceranib-2 results, cytotoxic effects, apoptotic properties (fragmented nuclei, condensed chromatin, late apoptotic bodies, cell shrinkage), and an increased number of annexin V-positive cells were observed in ceranib-2-treated MCF7 and MDA MB 231 cell lines (Vethakanraj et al., 2015). Similarly, it was recently indicated in another study that after 24 h of incubation ceranib-2 clearly diminished the number of MCF7 cells, causing apoptosis by diminishing the mitochondrial membrane potential. In addition, cell
morphology and ultrastructure changed significantly, which indicated apoptotic cell death after exposure to ceranib-2 (Vejselova et al., 2016). In conclusion, ceranib-2 had stronger cytotoxic and apoptotic effects on some glioma cells (T-98G, U-87MG, C6) than C2 ceramide and cisplatin. Moreover, ceranib-2 was less toxic to normal
control relative expression 10 25 0 1 2 3
Figure 1. T-98G cells, treated or nontreated with 25 or 50 µM ceranib-2 for 24 (A) or 48 (B) h, then stained with FITC annexin V apoptosis assay kit with PI (Invitrogen). Lower left sections: annexin V/PI ( − ), living cells; lower right sections: annexin V ( + )/PI ( − ), early apoptotic cells; upper left sections: annexin ( − )/PI ( + ), necrotic cells; upper right sections: annexin ( + )/PI ( + ), late stages of apoptosis and secondary necrosis. Results of only one independent experiment out of 3 are depicted.
Figure 2. Relative gene expression changes in cytochrome c enzyme level after application of 10 and 25 µM doses of ceranib-2 to T-98G cells after 24 h (P > 0.05).
human astrocyte cells (NHAs). Our results may promote new insights for glioma treatment with ceranib-2.
Acknowledgements
This study was presented at the Joint Meeting of the Federation of European Physiological Societies and the
Baltic Physiological Societies (FEPS), Kaunas, Lithuania on 26–29 August 2015, and in National Application Congress of Biological Sciences, 26–29 December 2016, Konya, Turkey. This study was funded by the Eskişehir Osmangazi University Scientific Research Projects Committee (grant number 2012/11032).
References
Draper JM, Xia Z, Smith RA, Zhuang Y, Wang W, Smith CD (2011). Discovery and evaluation of inhibitors of human ceramidase. Mol Cancer Ther 10: 2052-2061.
Jemal A, Siegel R, Ward E, Hao Y, Xu J, Thun MJ (2009). Cancer statistics, 2009. CA Cancer J Clin 59: 225-249.
Gorojod RM, Alaimo A, Alcon SP, Saravia F, Kotler M L (2017). Interplay between lysosomal, mitochondrial and death receptor pathways during manganese-induced apoptosis in glial cells. Arc Toxicol 91: 3065-3078.
Kim WH, Choi CH, Kang SK, Kwon CH, Kim YK (2005). Ceramide induces non-apoptotic cell death in human glioma cells. Neurochem Res 30: 969-979.
Kus G, Kabadere S, Uyar R, Kutlu HM (2015). Induction of apoptosis in prostate cancer cells by the novel ceramidase inhibitor ceranib-2. In Vitro Cell & Dev Biol-An 51: 1056-1063. Mosmann T (1983). Rapid colorimetric assay for cellular growth and
survival: application to proliferation and cytotoxicity assays. J Immunol Methods 65: 55-63.
Osawa Y, Uchinami H, Bielawski J, Schwabe RF, Hannun YA, Brenner DA (2005). Roles for C16-ceramide and sphingosine 1-phosphate in regulating hepatocyte apoptosis in response to tumor necrosis factor-α. J Biol Chem 280: 27879-27887. Oskouian B, Saba JD (2010). Cancer treatment strategies targeting
sphingolipid metabolism. Adv Exp Med Biol 688: 185-205. Oztopçu P, Kabadere S, Mercangöz A, Uyar R (2004). Comparison
of vitamins K1, K2 and K3 effects on growth of rat glioma and human glioblastoma multiforme cells in vitro. Acta Neurol Belg 104: 106-110.
Park JB, Kim YB, Park EY (2015). Synergistic effect of nerve growth factor and insulin-like growth factor-1 on providing a pro-survival, anti-apoptotic benefit and increased extracellular matrix synthesis in stressed rat intervertebral disc cells. J Neurol Sci Turk 32: 728-737.
Proksch D, Klein JJ, Arenz C (2011). Potent inhibition of acid ceramidase by novel B-13 analogues. J Lipids 2011: 971618. Realini N, Palese F, Pizzirani D, Pontis S, Basit A, Bach A, Ganesan A,
Piomelli D (2016). Acid ceramidase in melanoma expression, localization, and effects of pharmacological inhibition. J Biol Chem 291: 2422-2434.
Sawada M, Nakashima S, Banno Y, Yamakawa H, Hayashi K, Takenaka K, Nishimura Y, Sakai N, Nozawa Y (2000). Ordering of ceramide formation, caspase activation and Bax/Bcl-2 expression during etoposide-induced apoptosis in C6 glioma cells. Cell Death Differ 7: 761-772.
Seelan RS, Qian C, Yokomizo A, Bostwick DG, Smith DI, Liu W (2000). Human acid ceramidase is overexpressed but not mutated in prostate cancer. Gene Chromosome Canc 29: 137-146.
Signoretto E, Zierle J, Bhuyan AAM, Castagna M, Lang F (2016). Ceranib‐2‐induced suicidal erythrocyte death. Cell Biochem Funct 34: 359-366.
Strelow A, Bernardo K, Adam-Klages S, Linke T, Sandhoff K, Krönke M, Adam D (2000). Overexpression of acid ceramidase protects from tumor necrosis factor–induced cell death. J Exp Med 192: 601-612.
Vejselova D, Kutlu HM, Kus G (2016). Examining impacts of ceranib-2 on the proliferation, morphology and ultrastructure of human breast cancer cells. Cytotechnology 68: 2721–2728. Vejselova D, Kutlu HM, Kuş G, Kabadere S, Uyar R (2014). Cytotoxic
and apoptotic effects of ceranib-2 offering potential for a new antineoplastic agent in the treatment of cancer cells. Turk J Biol 38: 916-921.
Vethakanraj HS, Babu TA, Sudarsanan GB, Duraisamy PK, Kumar SA (2015). Targeting ceramide metabolic pathway induces apoptosis in human breast cancer cell lines. Biochem Bioph Res Co 464: 833-839.
Viani P, Giussani P, Brioschi L, Bassi R, Anelli V, Tettemani G, Riboni L (2003). Ceramide in nitric oxide inhibition of glioma cell growth. Evidence for the involvement of ceramide traffic. J Biol Chem 278: 9592-9601.
Xu R, Jin J, Hu W, Sun W, Bielawski J, Szulch Z, Taha T, Obeid LM, Mao C (2006). Golgi alkaline ceramidase regulates cell proliferation and survival by controlling levels of sphingosine and S1P. FASEB J 20: 1813-1825.