A Study on Kazakh Academicians’
Information Technology Acceptance
Ertuğrul Tarcan
Ergin Sait Varol
Kemal Kantarcı
Talat Fırlar
Abstract
Information technologies (ITs), which have become one of the key enablers of success in educational competitiveness, have made the understanding of user technology acceptance crucial. The failures of IT investment and implementation lead to unwanted organizational outputs. A better under-standing of the contributions of the factors determining the individual’s intention to use (IU) IT during the acceptance process will help to prevent probable visible and invisible loss-es. This research attempts to validate a new technology ac-ceptance model (TAM) version extended with the constructs of Subjective Norm (SN) and Facilitating Conditions (FC) in the context of Kazakh Academicians. The results indicate that this variant of extended TAM will be able to facilitate manag-ers to appropriately employ their strategic decisions on the in-vestments and implementations of IT in educational settings while contributing to the technology acceptance research field. On the other hand, the model is open to development for a higher predictive value.
Keywords
Kazakhstan, subjective norm, facilitating conditions, academi-cians, extended technology acceptance model
_____________
Prof. Dr., Istanbul University, The Institute of Marine Sciences and Business Administration– Istanbul / Turkey [email protected]
Prof. Dr., Istanbul University, Vocational School of Technical Sciences - Istanbul / Turkey [email protected]
Assoc. Prof. Dr., Akdeniz University, Alanya Faculty of Business - Antalya / Turkey [email protected]
Assist. Prof. Dr., Beykent University, Vocational School - Istanbul / Turkey [email protected]
1. Introduction
We have seen the unexampled growth of the internet and an ensuing transformation in the educational system since last two decades. The ac-ceptation of a wide range of web-based tools has given rise to the trend of information technology (IT) in higher education globe. The significantly increased role of IT in education has made user acceptance an increasingly critical issue. Meanwhile the increasing availability of mobile (Petrova 2007) and wireless (Choi et al. 2007) technology makes e-learning even more pervasive and present everywhere (Yuen and Ma 2008).
According to Davis (1989: 319, 1993: 475) an individual’s technology acceptance is a crucial factor in determining the success or failure of a computer systems project. Given that the academician is the key to effec-tive use of ITs in the university educational system, it is important to un-derstand academicians’ IU towards IT and the factors that influence these intentions.
A number of previous studies have indicated that teachers’ attitudes as well as knowledge and skills in using computers are major factors affecting their initial acceptance of computer technology and acceptance towards technology (Koohang 1989, Kluever et al. 1994). However recent studies suggest that further research design should extend beyond the technology-based tools, for example, to include a broader range of social factors (Bielaczyc 2006: 301-303, 324, Selwyn 2007: 84, 89-91). And also cul-tural environment and educational ideologies do have a significant impact on technology acceptance (Kiraz et al. 2006: 160-164, Arslan 2009: 1127-1129). Therefore in order to understand academicians’ technology ac-ceptance a new framework is needed. In universities, the successful usage of ITs among academicians will depend mainly on subjective norm (SN) and facilitating conditions (FC) and academician’s willingness to accept the technology. Investigating SN and FC of academicians could answer some questions relating to acceptance and usage of technology in teaching, learning and their academic studies.
The area of this research was Kazakhstan. Kazakhstan, which is one of the Central Asia (CA) Countries, has great potential for the investors of IT. Kazakhstan’s estimated reserves of natural resources such as oil, natural gas, uranium, gold, copper and etc., and its tourism opportunities are expected to significantly raise its gross national product (GNP) figure through the upcoming years. Overall economic indicators have already shown the substantial signals in the direction of these expectations. Alt-hough its GNP per capita (according to the atlas methodology) of $1,520
in 2002 placed this country among the poorest in the developing coun-tries, this value has increased to $6920 in 2009 (Kantarci 2006: 59, Li-brary 2006: 6-7, Uysal and Kantarci 2006: 139, Kantarci 2007a: 822, Kantarci 2007b: 310, The World Bank 2010: 2). The usage rate of IT in Kazakhstan, as it is in the other countries in CA, is relatively low; by 2007 the rate of the population using internet in these countries is less than %20. In the period of 2006-2008, in Kazakhstan, the rate of internet us-age has increased from %15 to %19 while this value for mobile phone usage has reached to %67 (the World Economic 2009: 318, Putnam and Kolko 2010: 3). On the other hand National Program of Kazakhstan up to 2010 on intensive development of education has firstly based on use of IT (Ministry of Education 2004: 28-29) and its approximately literacy rate of %97.5, facilitating the diffusion and acceptance of IT, also can support the realisation of this program (Library 2006: 13, Putnam and Kolko 2010: 2). This country is in the initial phase of IT diffusion and the con-ditions sign to an intensive diffusion of IT for forthcoming years. This situation increases the importance of being understood the process of technology acceptance. That’s why Kazakhstan was chosen for this study. In this study, the expressions of technology, IT, and information and communication technology (ICT) are used in the same meaning.
2. Literature Review
2.1. Factors affecting IT usage
There is a growing trend of academic research examining the factors or conditions that could facilitate technology integration into businesses. There has been enormous investment in building IT infrastructure. But the only availability of infrastructure is not meaning to guarantee actual usage in daily routines. To understand key motivational variables in IT use of front line individuals is must be very crucial. At present more studies propose that further research design should extend beyond the technology-based tools as to include a broader range of social factors (Bielaczyc 2006, Selwyn 2007). Thus, in order to predict academicians’ technology use and acceptance a well- defined framework is necessary.
The technology acceptance model (TAM) is one of the most widely used models in technology acceptance studies. Perceived usefulness (PU) and perceived ease of use (PEOU) are hypothesized to be the fundamental determinants of user acceptance (Davis 1989: 320, 331-332). Legris et al (2003: 191, 200-202) state that TAM is a useful model, but has to be integrated into a broader one which would include variables related to
both human and social change processes and to the adoption of the inno-vation model. Therefore we looked for appropriate human and social con-structs to be put into the framework in order to provide a better under-standing to the exploration of IT acceptance amongst academicians since we took TAM as the core framework in our study. As a consequence rele-vant literature review reveals that FC of the users and SN of the users’ workplace are appropriate constructs to be considered in formulating the composite framework.
2.2. Technology acceptance model
Several intention-based theories have been used to explain the relationship between user attitudes, perceptions, beliefs, and final system use. These contain three of main theory named, the theory of reasoned action (TRA) (Ajzen and Fishbein 1980), the theory of planned behavior (TPB) (Ajzen and Madden 1986), and TAM. Among these models, the most popular is TAM; Davis (1989: 332-334) adapted from the theory of reasoned actions and particularly designed for explaining individual technology acceptance decisions. PU and PEOU are hypothesized to be the fundamental deter-minants of user acceptance (Davis 1989: 330).
PU is the degree to which a person believes that using a particular system enhances his or her job performance. PEOU is the degree to which a per-son believes that using a particular system will be free of effort. These factors are common in technology usage settings and can be widely ap-plied to solve the acceptance problem (Taylor and Todd 1995: 168-170). Attitude of a particular person is hypothesized to influence the behavioural IU a technology, eventually relating to actual use. From the beginning, TAM deviated from Theory of Reasoned Action (TRA) by leaving SN out of the model. Additionally the mediating role of attitude was uncertain. Researchers related to information systems have investigated the TAM, and found it to be valid in predicting the individual’s acceptance of corpo-rate IT systems (Segars and Grover 1993: 521-523, Chin and Todd 1995: 244, Doll et al. 1998: 855). In addition to this, increasingly key motiva-tional determinants were found, the mediating effect of attitude towards behavioural intention to computer technology use reduced.
Venkatesh and Davis (2000: 197) In the follow-up model recommended an extension called extended TAM (TAM2), which consisted of social influence processes and cognitive instrumental processes, but it deleted attitude to use because of weak predictors of behavioural IU.
TAM and TAM2 have been executed in different shapes to explain tech-nology adoption in a wide variety of contexts, ranging from consumer to intra-organizational technology acceptance. On the other hand, there have been other proposed models as well. Venkatesh et al. (2003: 447) repre-sented Unified Theory of Acceptance and Use of Technology (UTAUT) includes integrated eight most prominent models of technology ac-ceptance in 2003. UTAUT represents a significant step forward in the technology acceptance literature. UTAUT suggests four core constructs to explain and predict user acceptance of a new technology. These constructs are performance expectancy, effort expectancy, FC and social influence. According to Venkatesh et al. (2003: 425, 436, 439) their model explains up to seventy percent of the variance in IU technology, outperforming previous models. However in current study, UTAUT is not taken as the basis for research model. First of all, especially for FC and social influence, the researchers found the grouping and labelling of items and constructs were causing trouble. Considering these difficulties of UTAUT, the re-searchers choose to rely on the more traditional and verified TAM2 as the basis for the research conceptual model. In general, the TAM suggests that two factors PEOU and PU are the two main factors have constituted a significant influence on an individual’s IU a technology or system (Ma and Liu 2004; Schepers et al. 2007). The mediating role of attitude be-tween these perceptions has been doubtful from the start of TAM research and was therefore not considered in later assessments of the model (Ven-katesh & Davis 2000: 197).This means the researchers include SN, but exclude attitude.
2.3. Facilitating conditions
Venkatesh et al. (2003: 453) define FC as “the degree to which an indi-vidual believes that an organizational and technical infrastructure exists to support use of the system”. FC in the technology environment can affect IU technology and make a job easy to perform.
In the previous research or models, FC construct have been used as behav-ioral controller perception, facilitating condition and compatibility (Thompson et al. 1991: 126-129). Previous studies indicate that FC in-cludes the factors such as training, education, and administrative and technical support which will be used in producing an affirmative envi-ronment for technology acceptance (Groves and Zemel 2000: 57; Fram-bach and Schillewaert 2002: 167; Schillewaert et al. 2005: 325). In some other studies, four factors of FC are suggested as availability of resource, level of knowledge to use the technology, similarity or dissimilarity to the
system which have been used and availability of help for resolving tech-nology problems (Anderson and Schwager 2004: 42, Teo et al. 2008: 131-132). In the Daughtery and Funke’s study (1998: 37-38), 76 faculty members responded to barriers included lack of technical support, lack of adequate equipment/software, lack of faculty/ administrative support that they confronted when incorporating distance education. Also the study of Farquhar and Surry (1994: 22) suggested organizational factors with the adopter’s individual factors as influential factors which affect the adoption and utilization of the instructional product. They separated organizational factors into two categories as physical environment and support environ-ment, and placed more emphasis on the support environment that in-cludes the resources and services needed to install and maintain an instruc-tional innovation. Lim and Khine’s study (2006: 97, 120) reinforced the importance of the support environment. The teachers in their study refer-enced to ICTs integration to be the lack of access to computers, inade-quate technical support and lack of support from peers and inadeinade-quate numbers of computers. Training, education and technical support can affect the way an individual applies a technology in a useful way and/or finds it easy to use (Venkatesh 1999: 253). Venkatesh’ another study (2000: 197) indicated that perceptions of external control such as FC had a significant impact on PEOU. These studies focusing on FC being per-formed in the area of technology acceptance, are still limited and it needs new research.
2.4. Subjective norm
TAM, which was a functional model, should include new variables related social change process (compliance, identification and internalization) such as SN (Legris et al. 2003: 191, 200-202, Schepers et al. 2007: 99). Taylor et al. (1995: 163-164) indicated that SN is important in an organizational setting. Fishbein et al. (1975: 16, 301) defined SN as a person’s percep-tion that most people who are important to that person think whether the behaviour in question should or should not be performed by the person. In an organizational setting, it is possible to trace back the concept of ‘im-portant people’ to the supervisor and the referent group. In other words, SN is the degree to which an individual perceives the demands of others on that individual’s behaviour. In the area of technology acceptance, this argument was implicitly assumed by Venkatesh et al. (2000: 197) who argued that when a co-worker thought that the system was useful, a person tended to have the same idea. Individuals can choose to perform a specific behaviour even if they are not positive towards the behaviour or its conse-quences. Also they suggested that SN had an impact on behavioral
inten-tion.Such correlation supported in the literature by a number of studies. In another study explained that SN had a larger impact on behavioral intention in Western studies than non-Western (Schepers et al. 2007: 98). SN has been empirically tested and has had a significant direct (Ajzen 1988:142-144, Mathieson 1991: 185, Taylor and Todd 1995: 163-164) or indirect effect (Venkatesh and Davis 2000: 195) in predicting an indi-vidual’s IU computer technology. Within the school environment, Ballone and Czerniak (2001: 24) reported students’ positive opinions of the in-structor increased in proportion to the use of the computers in the class-room. A study that directly examined the influence of SN on computer use was conducted by Marcinkiewicz and Regstad (1996: 27) who report-ed that SN is most prreport-edictive of computer use, alongside self-competence, perceived relevance and innovativeness. Lucas and Spitler (1999: 291, 304) and Venkatesh and Davis (2000: 197) also reported that organiza-tional variables such as social norms are more important than user's per-ceptions of IT in predicting system usage and acceptance. On the other hand some of other studies indicated that SN had no significant effect on the variables of extended TAM. The structural equation modeling (SEM), which shows spurious effects and indirect effects, may be helpful for re-solving this type inconsistency (Lewis et al. 2003, Ndubisi 2006).
3. Research Model and Hypotheses
Kazakhstan, as it has been mentioned above, has great need, intention and potential sources for the IT investments and development. Hence the understanding of the acceptance process of IT will be a valuable tool in the strategic management for the efficient and effective usage of ITs for a country which is in the early stage of IT diffusion (the World Economic 2009). In the current research, after a pre-study in Kazakhstan, it has been decided to use the extended TAM model of the study performed in Turk-ish Academicians context which had relatively achieved a noteworthy pre-dictive power with the value of 0.80 in order to revalidate the model (Tar-can and et al. 2010b: 804).
TAM was used as the core framework for analysis while additional con-structs were added in order to find a better model to understand academi-cians’ acceptance of IT. We measured user acceptance using behavioral intention. According to our model an academician’s decision to accept or not to accept a technology is directly affected by his or her perception of the technology’s usefulness and ease of use as well as SN and FC. While taking TAM as the core model, SN and FC were introduced to form a composite model to explore academicians’ acceptance of IT. The direct
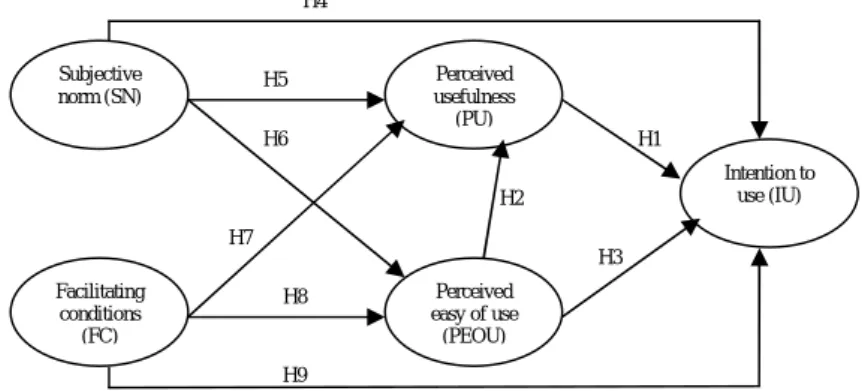
and indirect effects of each construct constituted the hypotheses (Figure 1) and were tested through empirical data. Devising of each hypothesis is described as follows.
3.1. Traditional TAM hypotheses
Based on the previous study on TAM, as mentioned above at the literature section, following hypotheses were suggested:
H1: An academician’s PU of IT would positively influence his or her IU IT. H2: An academician’s PEOU of IT would positively influence his or her PU of IT.
H3: An academician’s PEOU of IT would positively influence his or her IU IT.
3.2. The influence of subjective norm
According to the previous research on SN as mentioned above at the liter-ature section, those hypotheses were proposed:
H4: An academician’s SN perception related to IT use would positively influence his or her IU IT.
H5: An academician’s SN perception related to IT use would positively influence his or her PU of IT.
H6: An academician’s perception on SN has a positive effect on his or her PEOU about IT H1 H2 H3 H5 H6 H7 H8 H9 H4
Figure 1. Research Model Subjective norm (SN) Facilitating conditions (FC) Perceived easy of use (PEOU) Perceived usefulness (PU) Intention to use (IU) H2
3.3. The influence of facilitating conditions
Based on previous studies on FC, as mentioned above at the literature part, three relevant hypotheses were further suggested for the study: H7. An academician’s perception of FC related to IT use would positively influence his or her PU of IT.
H8. An academician’s perception of FC related to IT use would positively influence on his or her PEOU of IT.
H9: An academician’s perception of FC related to IT use would positively influence his or her IU toward IT.
4. Methodology 4.1. Sampling
To examine the academicians’ acceptance of IT using TAM extended with the constructs of SN and FC, four of 53 universities and institutes in Ka-zakhstan was chosen: after pre study, the questionnaires, instead of a web page link based survey, were distributed by the help of the top manage-ment and the heads of programs to 250 academicians of totally 2985 working for these universities and institutes chosen intentionally according to their departments (programs) criteria. 136 valid returns were obtained giving a response rate of 54.4 per cent. The academicians who completed the questionnaires did so voluntarily, with no compelling for their partici-pation.
4.2. Questionnaire
After being adapted to Russian, a self-administered questionnaire includ-ing 17 items related to TAM constructs and 6 questions of demographic data (age, gender, academic title, academic unit, field, experience year in education) were used. The questionnaire also contained a short description of the sphere of the study. A scale from negative to affirmative and suitable to the Likert scale, was arranged for measuring the five factors of the mod-el specified in Figure 1.
PU was measured using 5 questions developed by Davis (1989: 331) and Chin and Todd (1995: 244-245).
Four questions in PEOU construct were taken from Davis (1989: 331), and Adams et al. (1992: 237). Three questions in IU factor were taken from Ajzen and Fishbein (1980: 42, 104). Two items in SN scale were taken from Taylor and Todd (1995: 174). Three items in FC construct were taken from Thompson et al. (1991: 132) (see Table 1).
Table 1
Constructs, items and sources Perceived usefulness (PU)
PU1. Using technology increases my productivity. PU2. Using technology improves my job performance. PU3. Using technology enhances my effectiveness on the job. PU4. Using technology makes it easier to do my job.
PU5. Overall, I find technology useful in my job. (Davis 1989: 331, Chin and Todd 1995: 244-245).
Perceived ease of use (PEOU)
PEOU1. Learning to operate technology is easy for me.
PEOU2. I find it easy to get the technology to do what I want it to do. PEOU3. My interaction with the technology is clear and understandable. PEOU4. Overall, I find the technology easy to use.
(Davis 1989: 331, Adams et al. 1992: 237).
Intention to use (IU)
IU1. I intend to use technology in my job when it becomes available to me. IU2. I intend to use technology for my customers as often as needed.
IU3. To the extent possible, I would use technology with my customers and man-agement frequently.
(Ajzen and Fishbein 1980: 42, 104).
Subjective norm (SN)
SN1. People whose opinions I value will encourage me to use Communication Technologies.
SN2. People who are important to me will support me to use Communication Tech-nologies.
(Taylor and Todd 1995: 174).
Facilitating conditions (FC)
FC1. When I need help to use Communication Technologies, guidance is available to me.
FC2. When I need help to use Communication Technologies, specialized instruction is available to help me.
FC3. When I need help to use Communication Technologies, a specific person is available to provide assistance.
(Thompson et al. 1991: 132). 4.3. Participants
Demographic statistics indicated that 39.5% of the academicians were male, 60.5% female;
28.7% were between the ages of 18 and 30 years, 47.8% between 31 and 40, 12.5% between 41 and 50, 7.3% between 51-60 and 3.7% 61 and up; 6% were Professor Dr., 27%.6 Associate
Table 2: Demographic Valid Percents (N: valid number)
Gender
N=129 AgeN=136 Academic TitleN=134 Academic UnitsN=130
female 60.5 30 andbelow 28.7 Professor Dr. 6.0 Institutes 11.5 male 39.5 31-40 47.8 AssociateProf. Dr. 27.6 Faculties 68.4 41-50 12.5 AssistantProf. Dr 54.5 Schools 3.1 51-60 7.3 Instructor 5.2 Vocationalschools 0.8 61 and
up 3.7 Lecturer 6.7 Researchcentres 13.1
Others 3.1
Total 100 100 100 100
Prof. Dr., 54.5% Assistant Prof. Dr., 5.2% Instructors and 6.7% Lectur-ers; 11.5% were from institutes, %68.4 faculties, 3.1% schools, 0.8% vocational schools, 13.1% research centres and 3.1% others (See Table 2).
4.4. Research Analyses
For sampling adequacy, Kaiser-Meyer-Olkin (KMO), Barlett’s test of sphericity and Measures of Sampling Adequacy (MSA) tests were per-formed with SPSS. Maximum Likelihood and Direct Oblimin Rotation Methods were used for factor analysis. For the internal consistency values for each of the constructs in the research model, Cronbach’s alpha reliabil-ity and ‘if item deleted’ analysis methods were performed. After these analyses, for the test of measurement model, Confirmatory Factor Analysis (CFA) was performed with Lisrel. Structural Equation Modelling was used to test assumed hypotheses and to determine the relationships among SN, FC, PU, PEOU, and IU constructs.
5. Results
The results of the analysis showed that the values of the sampling adequa-cy for SN, FC, PU, PEOU, and IU were consistent. Kaiser-Meyer- Olkin (KMO) test output was appropriate with the value of 0.837 and Barlett’s test of sphericity indicated a significant value (p = 0.00).
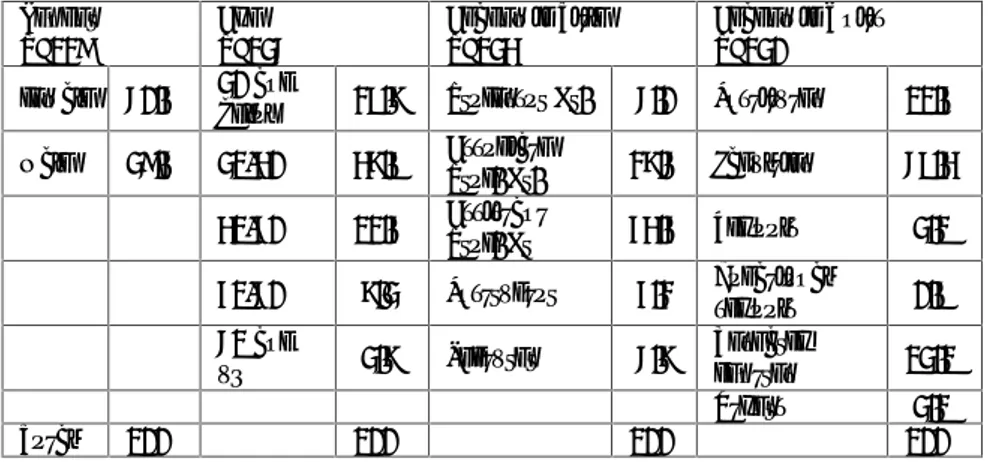
Table 3: Reliabilities, scales means, standard deviations and spearman correlations Construct [number of items] Croanba ch’s Alpha** Mean SD 1 2 3 4 5 1. Perceived usefulness (PU) [5] 0.86 4.04 0.64 1
2. Perceived ease of use
(PEOU) [4] 0.86 3.59 0.78 0.538* 1 3. Intention to use (IU) [3] 0.84 4.01 0.71 0.541* 0.332* 1 4. Subjective norm (SN) [2] 0.86 3.76 0.80 0.399* 0.391* 0.345* 1 5. Facilitating Conditions (FC) [3] 0.85 3.74 0.69 0.367* 0.484 0.259 0.505* 1
*p<0.01 **Value with only 2 items represents correlation; values with more than 2 items represent Cronbach’s alphas.
Measures of Sampling Adequacy (MSA) values ranged from 0.775 to 0.931. The results of the factor analysis with Maximum Likelihood and Direct Oblimin Rotation Methods approved the research data and factors. As shown in Table 3, Cronbach’s alpha analysis confirmed the the reliabil-ity of the latent variables with the significantly larger calculation values than the acceptable limit (Cronbach’s alpha ≥ 0.84). After these analyses, all data values of results were determined suitable for, and included into, the further tests. Table 3 displays the reliabilities, means, standard devia-tions and spearman correlation coefficients for the scales.
5.1. Measurement Model
After exploratory data analyses, overall measurement quality of the re-search model was assessed using confirmatory factor analysis (CFA) with Lisrel 8.54. The outputs of CFA confirmed reliability analyses’. The measurement model had a Chi-square of 191.38 (p = 0.000) with 108 Degrees of Freedom (df). The ratio of chi-square/df was 1.77, which is below the suggested value of 3.0, indicating a good fit (Reisinger and Ma-vondo 2006: 56, 57). The Root Mean Square Error of Approximation (RMSEA) for the measurement model was 0.076, and the Root Mean Square Residual (RMSR) was 0.044, which indicates adequate fit (Hooper et al. 2008: 53-56). Overall, the measurement model indicated an ac-ceptable fit with a Normed Fit Index (NFI) of 0.93, and a Comparative Fit Index (CFI) of 0.96 (Hu and Bentler 1999: 27,28). The Goodness-of-Fit Index (GFI) is 0.86, the Adjusted Goodness-of-Goodness-of-Fit Index
(AGFI) is 0.80, and the Parsimony Nor Med Fit Index (PNFI) is 0.73. All of the CFA results confirmed the overall measurement quality of the research model (Anderson and Gerbing 1988, Gerbin and Anderson 1988: 187).
5.2. Structural Equation Model
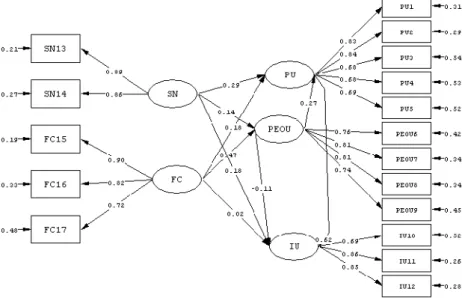
The results of the structural model component of SEM are displayed in Figures 2 and 3: The value of Chi-square is 216.71 with 109 degrees of freedom (Chi-square/df = 1.99, p< 0.001,
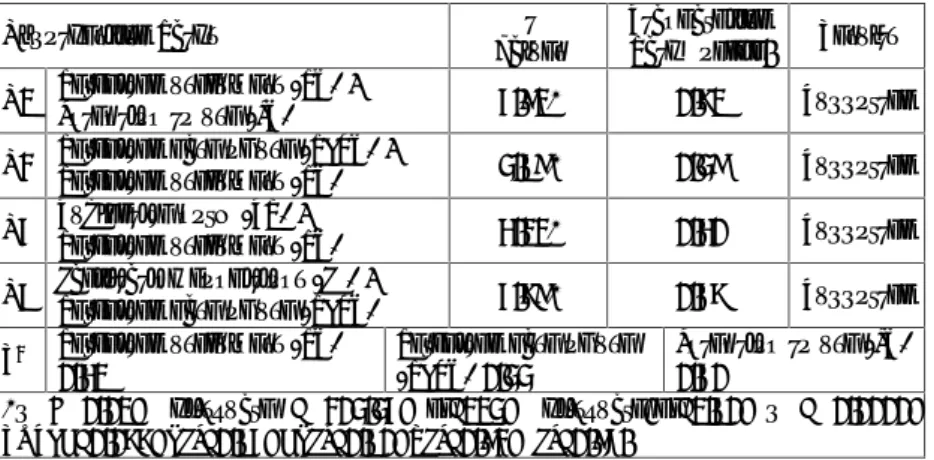
Table 4: Results of hypothesis tests
Hypothesized Paths tValues StandardizedPath Coeffic. Results
H1 Perceived usefulness (PU) -Intention to use (IU) 4.95* 0.62 Supported H2 Perceived ease of use (PEOU) -Perceived usefulness (PU) 2.52** 0.27 Supported H3 Perceived ease of use (PEOU) -Intention to use (IU) -1.04 -0.11 Not Supported H4 Subjective norm (SN) -Intention to use (IU) 1.68 0.18 Not Supported H5 Subjective norm (SN) -Perceived usefulness (PU) 2.66* 0.29 Supported H6 Subjective norm (SN) -Perceived ease of use (PEOU) 1.28 0.14 Not Supported H7 Facilitating conditions (FC) -Perceived usefulness (PU) 1.56 0.18 Not supported H8 Facilitating conditions (FC) -Perceived ease of use (PEOU) 4.07* 0.47 Supported H9 Facilitating conditions (FC) -Intention to use (IU) 0.16 0.02 Not supported *p < 0.01; **p < 0.05; Chi-square=216.71; df =109; Chi-square/df=1.99; p =0.0000; RMSEA=0.086; GFI=0.84; AGFI=0.78; NFI=0.92; CFI=0.95.
RMSEA= 0.086, GFI = 0.84, AGFI = 0.78, NFI=0.92, CFI=0.95) (Hooper et al. 2008: 53-56). The standardised path coefficients and their corresponding t-values and the test results of the hypotheses are displayed in Table 4 (also see Figures 2 and 3). Only 4 of the 9 hypotheses were statistically significant (p < 0.01 and p < 0.05) (See Figure 2 and Table 4).
Figure 2. Structural Equational Model
Figure 3. Initial structural model test results
SN PU PEOU IU FC H1; r =.62* H2; r =.27** H3; r =-.11 H5; r =.29* H6; r =.14 H4; r =.18 H7; r =.0.18 H8; r =.47* H9; r =.02 *p< 0.01, **p< 0.05; Chi-square=216.71; df =109; Chi-square/df=1.99;p =0.0000; RMSEA=0.086; GFI=0.84; AGFI=0.78; NFI=0.92; CFI=0.95.
Hypothesis H1 predicted that PU has a positive affect on IU. As expected, path coefficient for IU was statistically significant (p< 0.01) and this hy-pothesis was accepted (See Figure 2 and 3 and Table 4).
H2 suggested that PEOU has a positive impact on PU. Since the path coefficient between PEOU and PU constructs was statistically significant (p< 0.05), H2 hypothesis was accepted.
H3 suggests that PEOU has an influence on IU. Path coefficient for H3 was not significant (p>0.05), and this suggestion was rejected.
Hypotheses, H4, H5 and H6, suggest that SN affects IU, PU and PEOU. As not expected, path coefficients for IU (p>0.05) and PEOU (p>0.05) were not statistically significant, and H4 and H6 were rejected. Path coef-ficient for PU was statistically significant (p< 0.01) and H5 was accepted (See Figure 2 and 3 and Table 4).
Hypotheses, H7, H8 and H9, predict that FC influences PU, PEOU and IU. The path coefficients related to H7 and H9 suggestions were not sta-tistically significant (p> 0.05), and these hypotheses of H7 and H9 were rejected while H8 was accepted with the positive impact on PEOU (p< 0.01) (See Figure 2 and 3 and Table 4).
5.3. Modified Structural Equation Model
The hypothesized research model was modified for further analysis: the rejected paths of the hypothesized research model were deleted. After modification, the new analysis results for the
Table 5: The results of the analysis of the modified model
Hypothesized Paths Valuest StandardizedPath Coeffic. Results
H1 Perceived usefulness (PU) -Intention to use (IU) 5.91* 0.71 Supported H2 Perceived ease of use (PEOU) -Perceived usefulness (PU) 3.89* 0.39 Supported H5 Subjective norm (SN) -Perceived usefulness (PU) 4.11* 0.40 Supported H8 Facilitating conditions (FC) -Perceived ease of use (PEOU) 5.79* 0.57 Supported
R2 Perceived usefulness (PU)
0.41 Perceived ease of use(PEOU) 0.33 Intention to use (IU)0.50
*p < 0.01; Chi-square = 203.35; df=113; Chi-square/df=1.80; p = 0.0000; RMSEA=0.077; GFI=0.85; AGFI=0.80; NFI=0.92; CFI=0.96.
modified model showed an acceptable fit of data - the resulting Chi-square of 203.35 with 113 degrees of freedom (Chi-square/df = 1.80, p< 0.001, RMSEA= 0.077, GFI = 0.85, AGFI = 0.80, NFI=0.92, CFI=0.96) (See Table 5 and Figure 4 and 5).
Figure 4. Modified Structural Equational Model
Figure 5. The modified model test results
SN IU R2=.5 0 PU R2=.4 1 PEOU R2=.3 3 FC H8; r =.57* H1; r =.71* H2; r = .39* H5; r =.40* *p<0.01;Chi-square= 203.35; df=113;Chi-square/df=1.80; p = 0.0000; RMSEA=0.077; GFI=0.85; AGFI=0.80; NFI=0.92; CFI=0.96.
The results showed that all of the path coefficients of the modified model were statistically significant (*p< 0.01). The results indicated that 33% of the variance of PEOU was explained by FC. 41% of PU’s variance was explained by SN and PEOU. 50% of the variance of IU was explained by PU. SN through PU and FC through PEOU had a mediating effect on IU. FC, SN and PEOU did not have any direct impacts on IU but medi-ating effects.
6. Discussion and Conclusions
The current study intended to enlarge our understanding of the formation of the acceptance of IT by academicians in a different cultural environ-ment context by impleenviron-menting TAM extended by FC and SN. It was examined the relationships among TAM, FC and SN constructs. And also, the impacts of FC and SN on TAM constructs (PEOU, PU and IU) and their roles in building academicians’ IU IT were empirically explained by using the structural equation model.
The study results indicated that the core TAM relations except the direct impact of PEOU on IU resulted in just as well in a Kazakhstan environ-ment as they did in Western countries and Turkey; PEOU did not show a direct influence on IU. PU explained 50% of the variance of the academi-cians’ IU towards IT systems. This direct relationship between PU and IU was consistent to the previous studies (Ma et al. 2004: 407, Schepers et al. 2007: 91, 92, 98). The findings of this study pointed out that FC and SN didn’t have significantly influence in the explaining of IU of the academi-cians but mediating effect: FC through PEOU and SN through PU. And also PEOU had a mediating effect on IU through PU: This result is in the same direction to the findings of the study performed by Davis et al. (1992: 330), Agarwal and Prasad (1997: 572-576), Shang et al. (2005: 407, 408) and Burton-Jones and Hubona (2006: 712).
41% of the variance of PU was explained by SN and PEOU. These results were consistent to the previous studies (Ajzen 1988: 142-144, Mathieson 1991: 185, Taylor and Todd 1995: 162, 163, Venkatesh and Davis 2000: 197) in predicting an academician’s IU IT systems.
FC explained 33% of the variance of PEOU. This results support the previous studies related to FC, PEOU and IU (Frambach and Schillewaert 2002: 167, Groves and Zemel 2000: 57, Schillewaert et al. 2005: 325, Venkatesh 1999: 253). As not expected, SN had no direct influence on PEOU and IU, and FC did not any impact on PU and IU. These results were inconsistent to many of the prior studies on the subject of the FC,
SN and TAM constructs (Ajzen 1988: 142-144, Mathieson 1991: 185, Taylor and Todd 1995: 163, 164, 168-170, Groves and Zemel, 2000: 57, Venkatesh and Davis 2000: 195, 197, Daughtery and Funke 1998: 37, 38, Farquhar and Surry, 1994: 22, Lim and Khine 2006: 120) while they are consistent to some studies (Lewis et al. 2003: 657). This inconsistency may be come out because of the different social and cultural context. The explanation power of the model of this study with the rate of 50% for IU supports the metaanalyse study of Legris et al. investigating 22 articles (2003: 191, 200-202) and the study of Burton-Jones et al. (2006: 711-713) showing that the TAM and its variations have been empirically prov-en successful up to 40% in predicting IU for the differprov-ent contexts. On the other hand, the findings of this study confirm that TAM extended by FC and SN is useable to be able to better understand technology ac-ceptance process in explaining and managing the academicians’ IU IT related to the field of education. But, if the predicting power rate of 50% of this research model is compared with the value of 80% of another study performed with the same extended TAM model in Turkish Academicians context (Tarcan and et al. 2010b: 810), this model has resulted in a rela-tively lower value of explaining power for IU. And also, the rates of vari-ance unexplained of PU and PEOU are still high with the values of 59% and 67% respectively. The outcomes indicate that academicians which have higher levels of FC and SN will have higher levels of PEOU and PU, and this situation results in higher IT acceptance levels. Therefore, in the other societies context, especially in the Kazakh context, it seems that new variables such as demographic factors (Tarcan et al. 2010a: 140, 141, Put-nam and Kolko 2010: 6, 10), organizational innovativeness and personal innovativeness (Varol et al. 2009: 130) should be added to the model in order to increase the rate of predicting power for IU.
The greater knowledge related to the IT acceptance indicators will help to prevent the problems of acceptance and usage of these systems in future. The existing of IT systems does not guaranty organisational aims without the acceptance of these systems by stakeholders (managers, investors, IT systems producers and designers, academicians, students and etc.). This model can be used as a tool in order to meet the expectations of the stake-holders during the processes of pre-implementation, implementation and redesigning. While the outcomes indicate that Kazakh Academicians have relatively high means of IU and PU (Xmean=4.01 and 4.04 respectively); the
means of PEOU, SN and FC with 3.59, 3.76 and 3.74 respectively are relatively weaker. These consequences may direct the Kazakh Managers to
find out the additional ways in order to increase the PEOU levels of the academicians and other potential IT users by means of SN and FC. For example, the managers of educational institutions are able to plan the levels and contents of training programs for users according to the data results obtained using this TAM.
This study proposes and confirms that the factors of the extended TAM can be used by the educational managers as a valuable instrument in pre-dicting and explaining the acceptance of the educational IT systems. Since there has been limited research investigating IU ITs in Kazakhstan, the results of the research represent a valuable contribution to the strategic management of educational IT systems. On the other hand, it is possible to say that this research has few limitations, which may prevent the gener-alizability of the outputs. It can be said that the sample size of the research is small for the entire Kazakhstan. The research in future should also take into account the effects of the other stakeholders beside the academicians in order to be able to understand and explain the acceptance of IT systems at the higher levels. The new external factors such as demographic charac-teristics, organizational and personal innovativeness can be added to the model to increase the explained level of IU.
References
Adams, Dennis et al. (1992). “Perceived Usefulness, Ease of Use, And Usage of Information Technology: A Replication”. MIS Quarterly 16 (2): 227–247.
Agarwal, Ritu and Jayesh Prasad (1997). “The Role of Innovation Charac-teristics and Perceived Voluntariness in The Acceptance of Infor-mation Technologies". Decision Sciences 28 (3): 557-582.
Ajzen, Icek and Martin Fishbein (1980). Understanding Attitudes and Pre-dicting Social Behavior. Englewood Cliffs: Prentice Hall.
Ajzen, Icek, Thomas J. Madden (1986). “Prediction Of Goal-Directed Behavior: Attitudes, İntentions, And Perceived Behavioral Con-trol”. Journal of Experimental Social Psychology 22: 453–474.
Ajzen, Icek (1988). “Attitudes, Personality, and Behavior”. Chicago. IL.: Dorsey Press.
Anderson, James. C. and David W. Gerbing (1988). “Structural Modeling In Practice: A Review And Recommended Two Step Approach”. Psychological Bulletin 103 (3): 411–423.
Anderson, John. E., and Paul H. Schwager. (2004). “SME Adoption of Wireless LAN Technology: Applying The UTAUT Model”. Pro-ceeding of the 7 th Annual Conference of the Southern Association for Information Systems. 39-43.
Arslan, Aykut (2009). “Cross-Cultural Analysis of European E-Government Adoption”. World Applied Sciences Journal 7 (9): 1124-1130.
Ballone, Lena M. and Charlene M. Czerniak (2001). “Teacher’s Beliefs About Accommodating Students’ Learning Styles In Science Clas-ses”. Journal of Science Education 6 (2): 1-40.
Bielaczyc, Katerine (2006). “Designing Social Infrastructure: Critical Is-sues in Creating Learning Environments With Technology”. Jour-nal of the Learning Sciences 15 (3): 301–329.
Burton-Jones, Andrew and Hubona Geoffrey S. (2006). “The Mediation Of External Variables In The Technology Acceptance Mode”. In-formation & Management 43 (6): 706–717.
Chin, Wynne W., and Peter A. Todd (1995). “On The Use, Usefulness, And Ease Of Use Of Structural Equation Modelling In MIS Re-search: A Note Of Caution”. MIS Quarterly 19 (2): 237–246. Choi, Young et al. (2007). “Toward A Future Wireless Classroom
Para-digm”. International Journal of Innovation and Learning 4 (1): 14–25. Daughtery Martha and Barbara L. Funke (1998). “University Faculty and
Student Perceptions Of Web-Based Instruction”. Journal of Dis-tance Education 13 (1): 21–39.
Davis, Fred D. (1989). “Perceived Usefulness, Perceived Ease Of Use, And User Acceptance Of Information Technology”. MIS Quarterly 13 (3): 319–340.
_____, (1993). “User Acceptance of Information Technology: System Characteristics, User Perceptions And Behavioral Impacts”. Interna-tional Journal of Man-Machine Studies 38 (3): 475-487.
Doll, William J, Anthony Hendrickson and Xiaodong Deng (1998). “Us-ing Davis’s Perceived Usefulness And Ease-Of-Use Instruments For Decision Making: A Confirmatory And Multi-Group Invariance Analysis”. Decision Sciences 29 (4): 839-869.
Farquhar, John D. and Daniel W. Surry (1994). “Adoption Analysis: An Additional Tool for Instructional Developers”. Education and Training Technology International 31 (1): 19–25.
Fishbein, Martin and Icek Ajzen (1975). Belief, Attitude, Intention, and Behavior: An Introduction To Theory And Research. Addison-Wesley: Reading. Boston.
Frambach, Ruud T. and Niels Schillewaert, N. (2002). “Organizational Innovation Adoption: A Multi-Level Framework of Determinants and Opportunities For Future Research”. Journal of Business Re-search 55 (2): 163-76.
Gerbing, David W. and James C. Anderson (1988). “An Updated Para-digm For Scale Development Incorporating Unidimensionality And Its Assessment”. Journal of Marketing Research 25 (2): 186–192. Groves Melissa.M. and Paula C. Zemel (2000). “Instructional Technology
Adoption In Higher Education: An Action Research Case Study”. International Journal of Instructional Media 27 (1): 57–65.
Hooper, Daire, Joseph Coughlan and Michael R. Mullen (2008). “Struc-tural Equation Modelling: Guidelines for Determining Model Fit”. The Electronic Journal of Business Research Methods 6 (1): 53 - 60, available online at www.ejbrm.com
Hu, Li-tze and Peter M. Bentler (1999). “Cutoff Criteria For Fit Indexes In Covariance Structure Analysis: Conventional Criteria Versus New Alternatives”. Structural Equation Modeling 6 (1): 1–55. Kantarci, Kemal (2006). “Perceptions of Central Asia Travel Conditions:
Kyrgyzstan, Kazakhstan, Uzbekistan, and Turkmenistan”. Journal of Hospitality & Leisure Marketing 15 (2): 55-71.
_____, (2007a). “Perceptions of foreign investors on the tourism market in central Asia including Kyrgyzstan, Kazakhstan, Uzbekistan, Turkmenistan”. Tourism Management 28: 820–829.
_____, (2007b). “The Image Of Central Asıa Countries: Kyrgyzstan, Ka-zakhstan, Uzbekistan, And Turkmenistan”. Tourism Analysis 12: 307–318.
Kiraz, Ercan and Devrim Ozdemir (2006). “The Relationship between Educational Ideologies and Technology Acceptance in Preservice Teachers”. Educational Technology & Society 9 (2): 152-165.
Kluever, Raymond et al. (1994). “The Computer Attitude Scale: Assessing Changes In Teachers’ Attitudes Toward Computers”. Journal of Educational Computing Research 11 (3): 251–256.
Koohang, Alex A. (1989). “A Study Of Attitudes Toward Computers: Anxiety, Confidence, Liking And Perception Of Usefulness”. Jour-nal of Research on Computing in Education 22 (2): 137–150.
Legris Paul, John Ingham and Pierre Collerette ( 2003). “Why do people use information technology? A critical review of the technology ac-ceptance model”. Information and Management 40 (3): 191– 204. Lewis, William, Ritu Agarwal and V. Sambamurthy. (2003). “Sources of
influence on beliefs about information technology use: an empirical study of knowledge workers”. MIS Quarterly 27 (4): 657–678. Library of Congress (December 2006). “Country Profile: Kazakhstan”.
Federal Research Division. 1-20. http://memory.loc.gov/frd/ cs/profiles/Kazakhstan.pdf (3.12.2010)
Lim, Cher Ping and Khine Myint (2006). “Managing Teachers’ Barriers To ICT Integration In Singapore Schools”. Journal of Technology and Teacher Education 14 (1): 97–125.
Lucas, Henry C. Jr and Valerie Spitler (1999). “Technology Use And Performance: A Field Study Of Broker Workstations”. Decisions Sciences 30 (2): 291–311.
Ma, Qingxiong and Liping Liu (2004). “The Technology Acceptance Model: A Meta-Analysis Of Empirical Findings”. Journal of Organ-izational and End User Computing 16 (1): 59–72.
Marcinkiewicz, Henryk R. and Neil G. Regstad (1996). “Using Subjective Norms To Predict Teachers' Computer Use”. Journal of Computing in Teacher Education 13 (1): 27–33.
Mathieson, Kieran (1991). “Predicting User Intentions: Comparing The Technology Acceptance Model With The Theory Of Planned Be-haviour”. Information Systems Research 2(3): 173–191
Ministry of Education and Science of the Republic of Kazakhstan (2004). “National Program on Development of Education in the Republic of Kazakhstan till 2010”. 1-42. http://planipolis.iiep.unesco.org /upload/Kazakhstan/Kazakhstan%20Draft%20National%20Progra m%20on%20Education.pdf (3.12.2010).
Ndubisi, Neil. O. (2006). “Factors of online learning adoption: A com-parative juxtaposition of the theory of planned behavior and the technology acceptance model”. International Journal on E-Learning 5 (4): 571–591.
Petrova, Krassie (2007). Mobile learning as a mobile business application. International Journal of Innovation and Learning, 4(1): 1–13. Putnam, Cynthia and Beth Kolko (2010). “The Social Meaning of ICTs:
Patterns of Technology Adoption and Usage in Context”. 1-10. http://www.cyputnam.com/papers/PutnamKolko_ICTD2010.pdf (03.12.2010).
Reisinger, Yvette and Felix Mavondo (2006). “Structural Equation Mod-eling: Critical Issues and New Developments”. Journal of Travel & Tourism Marketing. 21(4): 41-71.
Schepers, Jeroen and Martin Wetzels (2007). “A Meta-Analysis Of The Technology Acceptance Model: Investigating Subjective Norm And Moderation Effects”. Information & Management 44 (1): 90-103. Schillewaert, Niels et al. (2005). “The Adoption of Information
Technol-ogy in the Sales Force”. Industrial Marketing Management 34 (4): 323–336.
Segars, Albert H. and Varun Grover (1993). “Re-Examining PEOU and Useful-ness: A Confirmatory Factor Analysis”. MIS Quarterly 17 (4): 517-525. Selwyn, Neil. (2007). “The Use Of Computer Technology In University
Teaching And Learning: A Critical Perspective”. Journal of Comput-er Assisted Learning 23(2): 83–94.
Shang, Rong-An And Yu-Chen Chen and Lysander Shen (2005). “Extrin-sic Versus Intrin“Extrin-sic Motivations for Consumers to Shop On-Line”. Information & Management 42 (3): 401–413.
Tarcan, Ertugrul and Ergin Sait Varol (2010a). "Role Of The Demo-graphic Factors In The Process Of Hotel Information Systems Adoption”. An International Interdisciplinary Journal TOURISM 58 (2): 127-144.
Tarcan, Ertugrul, Ergin Sait Varol and Boran Toker (2010b), "A Study On The Acceptance Of Information Technologies From The Per-spectives Of The Academicians In Turkey “. Ege Akademik Bakıs / Ege Academic Review 10 (3): 791-812.
Taylor, Shirley and Peter A., Todd (1995). “Understanding Information Technology Usage: A Test Of Competing Models”. Information Systems Research 6 (2): l44–l76.
Teo, Timoty, Chwee Beng Lee and Ching Sing Chai (2008). “Under-standing Pre-Service Teachers’ Computer Attitudes: Applying And Extending The Technology Acceptance Model”. Journal of Comput-er Assisted Learning 24 (2): 128–143.
The World Bank, 2010. http://www.worldbank.org.kz/WBSITE /EXTERNAL/COUNTRIES/ECAEXT/KAZAKHSTANEXTN/0, ,contentMDK:20212143~menuPK:361895~pagePK:1497618~piP K:217854~theSitePK:361869,00.html (24.12.2010).
The World Economic Forum and INSEAD (2009). “The Global Infor-mation Technology Report 2008–2009”. World Economic Forum. Geneva. 1-406.
Thompson, Ronald L., Christopher A. Higgins and Jane M. Howell (1991). “Personal Computing: Toward A Conceptual Model Of Utilization”. MIS Quarterly 15 (1):124–143.
Uysal, Muzaffer and Kemal Kantarci (2006). “An Integrative Approach To Image, Investment And Travel Conditions In Central Asia Countries (Kazakhstan, Kyrgyzstan, Uzbekistan, Turkmenistan)” Turk-Kazakh International Tourism Conference. 138-146. Alanya-Turkey. 20-26 November.
Varol, Ergin Sait and Ertugrul Tarcan (2009). “An Emprical Study On The User Acceptance Of Hotel Information Systems”. An Interna-tional Interdisciplinary Journal TOURISM 58 (2): 115-133.
Venkatesh, Viswanath (1999). “Creation of Favourable User Perceptions: Exploring The Role Of Intrinsic Motivation”. MIS Quarterly 23 (2): 239-241.
Venkatesh, Viswanath and Fred D. Davis (2000). “A Theoretical Exten-sion Of The Technology Acceptance Model: Four Longitudinal Field Studies”. Management Science 46 (2): 186–204.
Venkatesh, Viswanath et al. (2003). “User Acceptance of Information Tech-nology: Toward A Unified View”. MIS Quarterly 27 (3): 425-478. Yuen, Allan H. K. and Ma, Will W. K. (2008). “Exploring Teacher
Ac-ceptance of E-Learning Technology”. Asia-Pacific Journal of Teacher Education 36 (3): 229 – 243.
Kazak Akademisyenlerin Bilgi Teknolojilerini
Kabulü Üzerine Bir Araştırma
Ertuğrul Tarcan
Ergin Sait Varol
Kemal Kantarcı
Talat Fırlar
Özet
Eğitim ile ilgili rekabet üstünlüğünde başarının temel araçla-rından biri haline gelen “bilgi teknoloji (IT)” leri, kullanıcı teknoloji kabulünün anlaşılmasını önemli hale getirmiştir.. IT yatırımı ve uygulamalarında yapılan hatalar istenmeyen örgüt-sel çıktılara yol açmaktadır. Bireyin kabul sürecinde IT’lerini kullanma eğilimini etkileyen faktörlerin etki derecelerinin da-ha iyi anlaşılması muhtemel görünen ve görünmeyen kayıpla-rın önlenmesine yardımcı olabilecektir. Bu araştırma “Subjek-tif Norm (SN)” ve “Kolaylaştırıcı Şartlar (FC)” değişkenleriyle genişletilmiş TAM’ın yeni bir versiyonunun Kazak Akademis-yenler bağlamında geçerliliğini onaylamaya çalışmıştır. Sonuç-lar, TAM’ın genişletilmiş bu yeni versiyonunun, teknoloji ka-bulü araştırma alanına katkıda bulunurken, yöneticilerin eği-timle ilgili IT yatırım ve uygulamaları konusundaki stratejik kararlarını uygun bir şekilde yürürlüğe sokmalarını kolaylaştı-rabileceğini göstermektedir. Diğer yandan model daha yüksek bir tahmin gücüne ulaşmak için geliştirilmeye açıktır.
Anahtar Kelimeler
Kazakistan, subjektif norm, kolaylaştırıcı faktörler, akademis-yenler, genişletilmiş teknoloji kabul modeli
_____________
Prof. Dr., İstanbul Üniversitesi, Deniz Bilimleri ve İşletmeciliği Enstitüsü - İstanbul / Türkiye [email protected]
Prof. Dr., İstanbul Üniversitesi, Teknik Bilimler Meslek Yüksek Okulu - İstanbul / Türkiye [email protected]
Doç. Dr., Akdeniz Üniversitesi, Alanya İșletme Fakültesi - Antalya / Türkiye [email protected]
Yrd. Doç. Dr., Beykent Üniversitesi, Meslek Yüksek Okulu - İstanbul / Türkiye [email protected]
![Table 3: Reliabilities, scales means, standard deviations and spearman correlations Construct [number of items] Croanbach’s Alpha** Mean SD 1 2 3 4 5 1](https://thumb-eu.123doks.com/thumbv2/9libnet/3998075.54379/12.658.81.599.153.391/reliabilities-standard-deviations-spearman-correlations-construct-croanbach-alpha.webp)