Estimation of live weights at the beginning and the end of grazing
season in Tuj lambs via scores of factor analysis
Kadir ÖNK
1, Mehmet SARI
2, İsmayil Safa GÜRCAN
31Kafkas University, Faculty of Veterinary Medicine, Department of Animal Science, Kars; 2Ahi Evran University, Faculty of Agriculture, Department of Animal Science, Kırşehir; 3Ankara University, Faculty of Veterinary Medicine, Department of
Biostatistics, Ankara, Turkey.
Summary: This study was conducted in order to eliminate multicollinearity between body measurements of Tuj lambs and to estimate their live weights in the beginning and the end of grazing season (GS) using factor analysis scores, which were determined by calculating some body measurements, in multiple regression model. For this purpose, the material of the study consisted of 297 Tuj lambs born between 2009 and 2013. Live weights (LW) of lambs in the beginning and at the end of GS and body length (BL), withers height (WH), chest girth (CG), chest depth (CD), circumferences of cannon forelimb (CCF) and circumferences cannon hindlimb (CCH) measurements were analyzed in the study. Factor analysis were used to determine the estimated equation between the characteristics. It was determined that there was a multicollinearity between, CCF and CCH measured at the beginning of GS. Problem of multicollinearity between independent variables was eliminated by using factor scores (FS) determined by factor analysis in multiple regression models. Consequently, two factors were detected from results of factor analysis applied to body measurements to determine live weights of Tuj lambs in the beginning and at the end of GS. These factors for LW in the beginning and at the end of GS were found to explain 84.8% and 78.9% of total variance, respectively. Thereby, it was revealed that more accurate estimations could be made by using factor analysis scores in estimating live weights of Tuj lambs at the beginning and the end of GS. In addition, it was concluded that applying factor analysis scores derived from independent variables decreased mistake in the model according to least squares method.
Keywords: Factor analysis, live weight, Tuj lamb.
Tuj kuzularında mera sezonu başlangıcı ve sezon sonu canlı ağırlıklarının faktör analizi skorları ile
tahmin edilmesi
Özet: Bu araştırma Tuj kuzularında vücut ölçüleri arasındaki çoklu bağlantıyı elimine etmek ve bazı vücut ölçülerinin hesaplanmasıyla belirlenen faktör analizi skorlarını, çoklu regresyon modelinde kullanarak, mera sezonu başı ve sezon sonu canlı ağırlıklarını tahmin etmek amacıyla yapılmıştır. Bu amaçla, araştırmanın materyalini 2009-2013 yılları arasında doğan 297 Tuj ırkı kuzu oluşturmuştur. Araştırmada kuzuların mera başı ve mera sonu döneminde alınan canlı ağırlıkları ile vücut uzunluğu, cidago yüksekliği, göğüs çevresi, göğüs derinliği, ön incik çevresi ve arka incik çevresi ölçülerinden yararlanılmıştır. Özellikler arasındaki tahmini denklemi belirlemek için faktör analizi skorlarından yararlanılmıştır. Mera sezonu başı döneminde ölçülen ön incik çevresi ve arka incik çevresi arasında çoklu bağlantının olduğu belirlenmiştir. Çoklu regresyon modelinde faktör analizi ile belirlenen faktör skorlarının kullanılması ile bağımsız değişkenler arasındaki çoklu bağlantı probleminin giderildiği tespit edilmiştir. Sonuç olarak Tuj kuzularında mera sezonu başı ve mera sezonu sonundaki canlı ağırlıklarını belirlemek için vücut ölçülerine uygulanan faktör analizi sonuçlarında iki faktör tespit edilmiştir. Sezon başı ve sonundaki bu faktörler, toplam varyansın sırasıyla %84.8'ini ve %78.9'unu belirlemiştir. Böylelikle Tuj kuzularının mera sezonu başı ve sezon sonu dönemindeki canlı ağırlıklarının tahmininde faktör analizi skorlarının uygulanmasının modeldeki yanılgıyı daha doğru olarak ortaya çıkarmıştır. Ayrıca bağımsız değişkenlerden üretilen faktör analizi skorlarının uygulanması sonucunda modeldeki yanılgıyı en küçük kareler yöntemine göre azalttığı kanaatine varılmıştır.
Anahtar sözcükler: Canlı ağırlık, faktör analizi, Tuj kuzusu.
Introduction
The breed originated from the Tushin found in Georgia. Tuj sheep is breed throughout the north-east of Turkey and, a well adopted raise for the geography and climate of the highlands. Tuj has been used more commonly in the region. Tuj breed are kept for their carpet
wool, meat and milk. Generally, Tuj lambs are reared for meat and some are sold at the end of the grazing season.
The breed is white, sometimes with dark marks around the eyes and on the feet. The males are horned and the females are polled. They are either short fat tailed or fat rumped (18, 20).
Body measurements give information about morphological structure of the animals and they are also important in terms of being directly associated with live weights. Body measurements taken in certain periods after birth of lambs are used to determine their growth and developmental performances breed characteristics, to help for selecting animals with superior yield traits in a flock and to estimate live weight without using the weighing machine (1, 13). Knowing live weights of animals, on the other hand, provides convenience for flock management programs such as follow up of growth, use of drugs at appropriate doses, determination of daily amount of feed, and marketing weight (6, 17).
Appropriate statistical methods need to be used for estimation of live weight. In practice, Pearson’s correlation and simple regression model is used to linearly determine the relationship between live weight and body measurements (7) and multiple regression models is the most common prediction model. This model is obtained based on least squares method (LSM). In LSM, equations of estimation are provided without considering internal correlations between independent variables (5, 7, 19, 22). In case that significant multicollinearity is present between examined independent variables, there are inconveniencies that it may cause mistakes in statistical interpretation of coefficients of regression parameters estimated by using LSM method. One of the methods developed to eliminate these inconveniencies is the factor analysis. Problem of multicollinearity between independent variables (body measurements) would be dissolved by using factor scores in factor analysis for regression analysis (12, 26).
This study was conducted to reveal practicability of factor analysis scores to estimate live weights at the beginning and the end of grazing season through multiple regression analysis by using some body measurements in Tuj lambs.
Materials and Methods
The data used in this study were obtained from 297 Tuj lambs born between 2009 and 2013 in Sheep Breeding Unit, Faculty of Veterinary Science, Kafkas University. Lambing occurred in a building with littered floor which had ambient temperature. Routine lamb management such as iodine treatment of the navel, ear tagging was practiced. The lambs remained with their dams for three days after birth. The lambs were allowed to suckle their mothers continuously. The newborn lambs and their dams’ identities date of birth, gender, type of birth and birth weights were recorded (within 24 h of lambing). Lambs’ body measurements (BL, WH, CG, CD, CCF and CCH) and LW at the beginning and the end of GS were taken. LW of lambs were recorded in morning hours and on an empty stomach. When taking the body measurements;
length, height and depth measurements were taken using a measuring stick; chest girth and cannon bone circumference measurements were taken using a tape measure (2). The birth weights of the lambs were weighed with scale sensitive to 0.01 g.
LW was recorded by a weighing scale at the same time of the day. BL was distance from the most cranial point of the sternum to the most caudal point of the pin bone. CG was measured just behind the forearms. WH was measured vertically from the thoracic vertebrae to the ground. CD was measured from the spinous process to the xiphoid process of the sternum. CCF was smallest circumference of the cannon bone of the forelimb. CCH was smallest circumference of the cannon bone of the hindlimb.
Mean birth month of lambs is about March 15. Live weights of lambs in the beginning of grazing season (60th day) and at the end of grazing season (160th day) and body measurements were obtained by using interpolation method. Bartlett test and Kaiser-Meyer-Olkin (KMO) test were applied for sphericity in order to control separability of correlation matrix into factors. If value obtained as a result of KMO test is below 0.5, it indicates that correlations between pairs of variables could not be explained by other variables; in this case, factor analysis is not continued. If estimated KMO value is about 0.60 in separability of correlation matrix, KMO is average; if about 0.70, good; if about 0.80, very good; if about 0.90, it is perfect (11).
While independent variable group consisted of body measurements taken at the beginning and at the end of grazing season, dependent variable group consisted of live weights. For this reason, factor analysis (with VARIMAX rotation) was used in multiple regression models (21, 31). T test was used in determining statistical significance of regression coefficients estimated in multiple regression analysis. To obtain eigenvalues in factor analysis, correlation matrix was used. Factor coefficients were used to obtain factor scores (12). In the study, the number of factors in multiple regression models generally equals to the number of eigenvalues, obtained from correlation matrix, which are greater than 1 (25, 28).
All statistical procedures used to determine estimations of body measurements and live weights at the beginning and the end of grazing season in Tuj lambs in the study were carried out with MINITAB 16 and SPSS 16.0 statistical packaged software.
Results
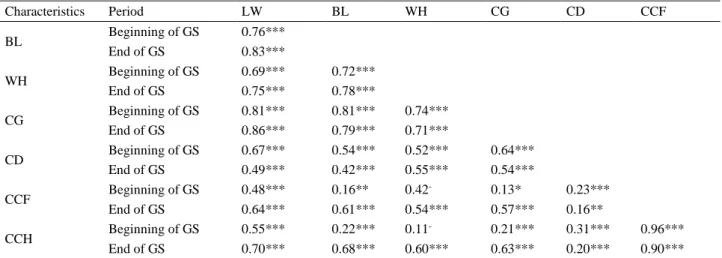
Table 1 shows phenotypic correlation coefficients between examined characteristics and results of significance. Maximum correlation in Tuj lambs were determined to be 0.81 (P<0.001) between live weight at the beginning of grazing season and chest girth at the
beginning of grazing season and 0.86 (P<0.001) between live weight at the end of grazing season and chest girth at the end of grazing season.
As seen in circumferences of cannon forelimb and cannon hindlimb at the beginning of grazing season, increased magnitude of correlations between independent variables indicated that there was multicollinearity. This may decrease consistency of results obtained via LSM. Therefore, Table 2 shows regression analysis results of examined characteristics according to least squares
method. According to Table 2, chest depth and circumferences of cannon forelimb and cannon hindlimb at the end of grazing season among body measurements used for estimation of live weight were determined to be statistically insignificant. It was detected there was a multicollinearity problem (VIF=Variance Inflation Factor>10) between circumference of cannon forelimb and circumference of cannon hindlimb at the beginning of grazing season from independent variables.
Table 1. Phenotypic correlation coefficients between examined characteristics and results of significance. Tablo 1. İncelenen özellikler arasındaki fenotipik korelasyon katsayıları ve önem sonuçları.
Characteristics Period LW BL WH CG CD CCF BL Beginning of GS 0.76*** End of GS 0.83*** WH Beginning of GS 0.69*** 0.72*** End of GS 0.75*** 0.78*** CG Beginning of GS 0.81*** 0.81*** 0.74*** End of GS 0.86*** 0.79*** 0.71*** CD Beginning of GS 0.67*** 0.54*** 0.52*** 0.64*** End of GS 0.49*** 0.42*** 0.55*** 0.54*** CCF Beginning of GS 0.48*** 0.16** 0.42 - 0.13* 0.23*** End of GS 0.64*** 0.61*** 0.54*** 0.57*** 0.16** CCH Beginning of GS 0.55*** 0.22*** 0.11 - 0.21*** 0.31*** 0.96*** End of GS 0.70*** 0.68*** 0.60*** 0.63*** 0.20*** 0.90*** GS: Grazing Season; LW: Live Weight; BL: Body Length; WH: Withers Height; CG: Chest Girth; CD: Chest Depth; CCF: Circumference of Cannon Forelimb; CCH: Circumference of Cannon Hindlimb.
-: P>0.05 statistically not significant; *: P<0.05, **: P<0.01, ***: P<0.001 statistically significant.
Table 2. Results of regression analysis of the examined characteristics according to least squares method. Tablo 2. İncelenen özelliklerin en küçük kareler yöntemine göre regresyon analizi sonuçları.
Characteristics
Period Coefficients
Standard
Error t - Value P VIF
Constant (b0) Beginning of GS -26.36 1.102 -23.94 <0.001 End of GS -51.59 2.886 -17.87 <0.001 BL Beginning of GS 0.10 0.029 3.53 <0.001 3.33 End of GS 0.32 0.063 5.07 <0.001 3.99 WH Beginning of GS 0.15 0.031 4.98 <0.001 2.48 End of GS 0.15 0.067 2.29 0.023 3.21 CG Beginning of GS 0.25 0.026 9.57 <0.001 3.93 End of GS 0.42 0.045 9.46 <0.001 3.38 CD Beginning of GS 0.19 0.046 4.15 <0.001 1.81 End of GS 0.18 0.096 1.87 0.063 1.75 CCF Beginning of GS 0.82 0.320 2.55 0.011 12.38 End of GS 0.92 0.622 1.48 0.141 5.08 CCH Beginning of GS 0.74 0.335 2.21 0.028 12.91 End of GS 1.11 0.671 1.65 0.100 6.07
GS: Grazing Season; LW: Live Weight; BL: Body Length; WH: Withers Height; CG: Chest Girth; CD: Chest Depth; CCF: Circumference of Cannon Forelimb; CCH: Circumference of Cannon Hindlimb.
Beginning of GS: R2=85.4%, R2 (corrected)=85.1% End of GS: R2=81.7%, R2 (corrected)=81.3% VIF: Variance Inflation Factor.
Table 3. Factor analysis results of examined characteristics at the beginning and the end of grazing season. Tablo 3. İncelenen özelliklerin mera sezonu başı ve mera sezonu sonundaki faktör analizi sonuçları.
Characteristics Coefficients of Factor Score Factor Loads
Communality Beginning of GS FS1 FS2 F1 F2 BL 0.304 -0.029 0.924 0.077 0.809 WH 0.309 -0.093 0.895 0.092 0.769 CG 0.316 -0.039 0.876 -0.033 0.860 CD 0.236 0.063 0.736 0.242 0.600 CCF -0.066 0.509 0.053 0.985 0.972 CCH -0.035 0.498 0.141 0.978 0.976 Variance 2.986 2.000 4.986 Variance % 49.775 33.327 83.102 End of GS FS1 FS2 FS1 FS2 Communality BL 0.153 0.171 0.940 0.178 0.804 WH 0.042 0.294 0.936 0.108 0.792 CG 0.071 0.264 0.672 0.594 0.800 CD -0.321 0.617 -0.041 0.918 0.844 CCF 0.448 -0.235 0.533 0.713 0.888 CCH 0.427 -0.190 0.573 0.687 0.915 Variance 2.826 2.218 5.044 Variance % 47.092 36.960 84.051
GS: Grazing Season; FS: Factor Score; BL: Body Length; WH: Withers Height; CG: Chest Girth; CD: Chest Depth; CCF: Circumference of Cannon Forelimb; CCH: Circumference of Cannon Hindlimb.
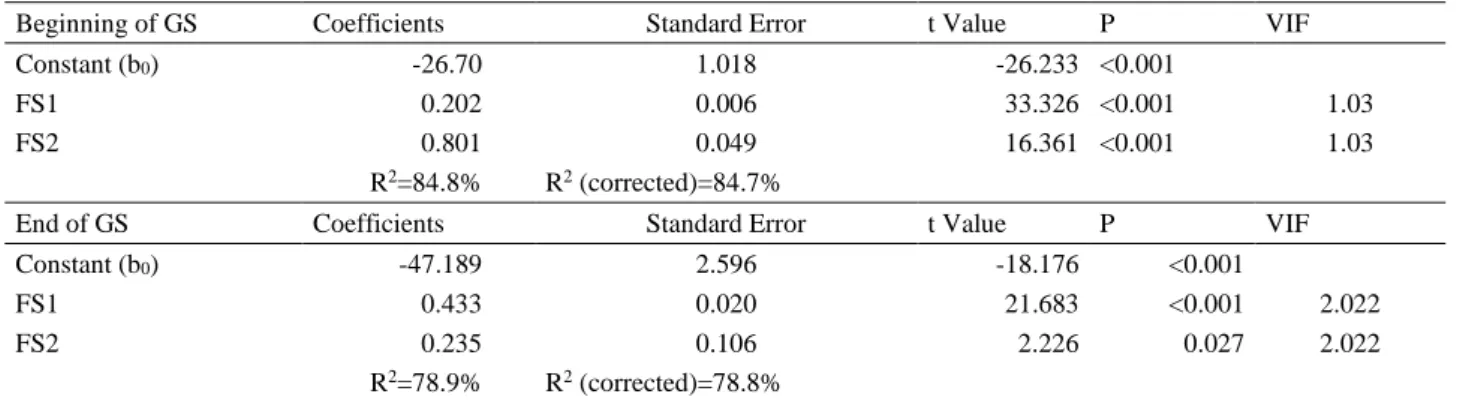
Table 4. Results of regression analysis according to factor analysis scores of Tuj lambs. Tablo 4. Tuj kuzularında faktör analizi skorlarına göre regresyon analizi sonuçları.
Beginning of GS Coefficients Standard Error t Value P VIF
Constant (b0) -26.70 1.018 -26.233 <0.001
FS1 0.202 0.006 33.326 <0.001 1.03
FS2 0.801 0.049 16.361 <0.001 1.03
R2=84.8% R2 (corrected)=84.7%
End of GS Coefficients Standard Error t Value P VIF
Constant (b0) -47.189 2.596 -18.176 <0.001
FS1 0.433 0.020 21.683 <0.001 2.022
FS2 0.235 0.106 2.226 0.027 2.022
R2=78.9% R2 (corrected)=78.8% GS: Grazing Season; VIF: Variance Inflation Factor; FS: Factor Scores.
Result of Bartlett’s test, which was performed for sphericity to check separability of correlation matrix into factors, was found as 1501 for the beginning of grazing season and 1415 for the end of grazing season (P<0.001). This indicated that there was a high correlation between variables and the data came from multiple normal distribution. Because estimated KOM coefficient was 0.707 for the beginning of grazing season and 0.792 for the end of grazing season, sample size of the study was fine and sufficient.
Table 3 shows factor analysis results at the beginning and the end of grazing season for the examined characteristics. According to the table, the correlation between independent variables and factors are reflected by
factor loads. Maximum correlations for the beginning of grazing season were estimated between BL, WH, CG, CD and factor 1 (0.924, 0.895, 0.876 and 0.736); CCF, CCH and factor 2 (0.985 and 0.978). Maximum correlations for the end of grazing season were estimated between BL, WH, CG and factor 1 (0.940, 0.936 and 0.672); CD, CCF, CCH and factor 2 (0.918, 0.713 and 0.687). According to Table 3, high communality was an indicator for that variance of independent variables was reflected efficiently.
Table 4 shows regression analysis results based on factor analysis. It was determined according to results of multiple regression analysis performed based on factor analysis scores that the effect of factor 2 used as
independent variable for estimating live weights of Tuj lambs at the beginning and the end of grazing season was statistically significant (P<0.001). While equation for live weight at the beginning of grazing season was LW=0.202 FS1+0.801 FS2; equation for live weight at the end of grazing season: LW=0.433 FS1+0.235 FS2. Coefficients of factor score, FS1 and FS2, were found to be statistically significant (P<0.001). It was calculated to be R2=84.8%, corrected R2=84.7% for live weights at the beginning of grazing season, these factor scores determined to be R2=78.9%, corrected R2=78.8% of total variance for live weights at the end of grazing season.
Discussion and Conclusion
Several studies were conducted to determine live weight and body measurements of sheep and the effect of body measurements on live weight (3, 4, 14, 16, 23, 24, 29, 30). Among these studies (3, 4, 14, 16, 29), maximum correlation was determined between live weight and chest girth and the same result was also obtained for the beginning and the end of grazing season in this study.
In explanatory factor analysis applied to identify correlations between live weights and body measurements in the study, body length and withers height were involved in the factor 1 and circumferences of cannon forelimb and cannon hindlimb were involved in factor 2 for the beginning of grazing season. For the end of grazing season, body length and withers height were involved in the factor 1 and chest depth and circumference of cannon forelimb were involved in the factor 2. In the study by Kilic et al. (15), the factor 2 included body length and back length for genotype Karayaka, withers height and body length involved in the factor 2 for genotype Bafra. In the study conducted by Gurcan and Akcapinar (9) on German Mutton and Karacabey Merinos, withers height, back length, body length, and live weight were involved in the first group and head length, head width, and chest girth were involved in the second group for both genotypes.
According to multiple regression analysis results without using factor analysis in this study, VIF values of the variables of circumference of cannon forelimb (VIF=12.38) and circumference of cannon hindlimb (VIF=12.91) at the beginning of grazing season were higher than 10 and multicollinearity problem was determined. Cankaya et al. (3) found that VIF values for withers height (10.5) and height at rump (10.9) were greater than 10 for Karayaka breed. Likewise, in a study by Eyduran et al. (7) on goats, VIF values for withers height (17.0) and the height at rump (13.0) were also reported. However, in the study conducted by Gul et al. (8) on Shami (Damascus) goats, they calculated VIF values smaller than 5 and determined that there was no multicollinearity problem.
Eigenvalues could be used as independent variables in multiple regression analysis because eigenvalues of the first 2 of 6 factors estimated by results of factor analysis results in this study were greater than 1. The first 2 factors chosen for live weight at the beginning of grazing season explain 49.775% and 33.327% proportion and 83.102% of the total variance, respectively. The first 2 factors chosen for live weight at the end of grazing season explain 47.092% and 36.960% proportion and 84.51% of the total variance, respectively. Independent variables in multiple regression analysis were also reported by several authors (3, 13, 15, 27).
These factor scores determined 84.8% and 78.9% of total variance belonging to live weights of Tuj lambs at the beginning and the end of grazing season. This value was found to be higher than the value of 73.1% determined by Cankaya et al. (3) and 62.3% determined by Eyduran et al. (7). However, this value was lower than the value of 91.1% determined by Jahan et al. (10). The reason behind why values of this study are different from those in other studies could be resulted from differences in species, breed, and number of examined characteristics, sample size, and statistical methods used.
Consequently, two factors were found from the results of factor analysis performed to body measurements for determining live weights of Tuj lambs at the beginning and the end of grazing season. These factors were determined to explain 84.8 and 78.9% of the total variance. It was determined that there was a multicollinearity problem between certain body measurements used for estimating live weights of Tuj lambs in the beginning of grazing season. It was concluded that applying factor analysis scores derived from independent variables decreased error in the model compared to least squares method.
Acknowledgements
This study was delivered as an oral presentation in the International 8th Balkan Animal Science Conference (6-8 September 2017).
References
1. Adeyinka IA, Mohammed ID (2006): Accuracy of body
weight prediction in Nigerian Red Sokoto goats raised in north eastern Nigeria using linear body measurement. Pak
J Biol Sci, 9, 2828-2830.
2. Akcapinar H (2000): Sheep Breeding.( in Turkish), 2nd Edition. Ismat Publishing, ISBN: 975-96978-1-5. Ankara. 3. Cankaya S, Altop A, Kul E, et al. (2009): Body weight
estimation Karayaka lambs by using factor analysis scores.
Anadolu J Agric Sci, 24, 98-102.
4. Cankaya S, Kayaalp GT (2007): Estimation of
relationship between live weights and some body measurements in German Farm x Hair crossbred by canonical correlation analysis. J of Anim Prod, 48, 27-32.
5. Cankaya S, Kayaalp GT, Sangun. L, et al. (2006): A
comparative study of estimation methods for parameters in multiple linear regression model. J Appl Anim Res, 29,
43-47.
6. Chitra R, Rajendran S, Prasanna D, et al. (2012):
Prediction of body weight using appropriate regression model in adult female Malabari goat. Veterinary World, 5,
409-411.
7. Eyduran E, Karakus K, Karakus S, et al. (2009): Usage
of factor scores for determining relationships among body weight and some body measurements. Bulg J Agric Sci, 15,
373-377.
8. Gul S, Gorgulu O, Keskin M, et al. (2005): Some
production equations of live weight from different body measurements in Shami (Damascus) goats. J Anim Vet
Adv, 4, 532-534.
9. Gurcan IS, Akcapinar H (2002): Investigation of the live
weight, body measurements and fiber diameter of the Deutsches Merinofleischschaf and Karacabey Merino sheep using cluster analysis.Turk J Vet Anim Sci, 26
1255-1261.
10. Jahan M, Tariq MM, Kakar MA, et al. (2013): Predicting
body weight from body and testicular characteristics of Balochi male sheep in Pakistan using different statistical analyses. J Anim Plant Sci, 23, 14-19.
11. Karagoz Y, Kosterelioglu D (2008): Developing
evaluation scale of communication skills with factor analysis Dumlupinar Univ J Soc Sci, 21, 81-98.
12. Keskin S, Daskiran I, Kor A (2007): Factor analysis
scores in a multiple linear regression model for the prediction of carcass weight in Akkeci kids. J Appl Anim
Res, 31, 201-204.
13. Khan MA, Tariq MM, Eyduran E, et al. (2014):
Estimating body weight from several body measurements in Harnai sheep without multicollinearity problem. J Anim
Plant Sci, 24, 120-126.
14. Kılıc I, Ozbeyaz C (2011): Classification of Karayaka and
Bafra (Chios x Karayaka B1) sheep according to body
measurements by different clustering methods. Ankara Univ
Vet Fak Derg, 58, 203-208.
15. Kılıc I, Ozbeyaz C, Unal N, et al. (2013): The usage of
discriminant analysis in separation of Karayaka and Bafra
(Chios x Karayaka B1) sheep breeds. Kafkas Univ Vet Fak
Derg, 19, 215-220.
16. Kul S, Seker I (2000): The relationship between body
weight and live body bone measurements and carcass measurements and characteristics in male Awassi lambs.
YYU Vet Fak Derg, 11, 70-75.
17. Mahieu M, Naves M, Arquet R (2011): Predicting the
body mass of goats from body measurements. Livestock
Research for Rural Development,
http://www.lrrd.org/lrrd23/9/mahi23192.htm. (20 January 2017).
18. Mason IL (1996): A World Dictionary of Livestock Breeds,
Types and Varieties. Fourth Edition. C.A.B International. 273 pp.
19. Olatunji-Akioye AO, Adeyemo OK (2009). Live weight
and chest girth correlation in commercial sheep and goat herds in Southwestern Nigeria. Int J Morphol, 27, 49-52. 20. Saatci M, Yildiz S, Kaya I (2003): New rearing systems for
Tuj (Tushin) lambs. Small Rumin Res, 50, 23-27.
21. Sakar E, Keskin S, Unver S (2011): Using of factor
analysis scores in multiple linear regression model for prediction of kernel weight in Ankara walnuts. J Anim Plant
Sci, 21, 182-185.
22. Sangun L, Cankaya S, Kayaalp GT, et al. (2009): Use of
factor analysis scores in multiple regression model for estimation of body weight from some body measurements in Lizardfish. J Anim Vet Adv, 8, 47-50.
23. Sari M, Isik S, Onk K, et al. (2013): Growth
characteristics and some body measurements of Tuj Lambs.
Erciyes Univ Vet Fak Derg, 10, 149-155.
24. Sari M, Onk K, Aksoy AR, et al. (2014): Determination of
growth and some body measurements of Hemşin Lambs.
Lalahan Hay Arast Enst Derg, 54, 15-20.
25. Sharma S (1996): Applied Multivariate Techniques. John Wiley & Sons, Inc, New York.
26. Tabachnick BG, Fidell LS (2001): Using Multivariate
Statistics. Allyn & Bacon, Inc, 4th Edition, New York.
27. Tariq MM, Eyduran E. Bajwa MA, et al. (2012):
Prediction of body weight from testicular and
morphological characteristics in indigenous Mengali sheep of Pakistan: using factor analysis scores in multiple linear regression analysis. Int J Agric Biol, 14, 590-594.
28. Tinsley HEA, Brown SD (2000): Handbook of Applied
Multivariate Statistics and Mathematical Modeling.
Academic Press, New York.
29. Topal M, Macit M (2004): Prediction of body weight from
body measurements in Morkaraman sheep. J Appl Anim
Res, 25, 97-100.
30. Ulusan HOK, Aksoy AR (1996) The performances of yield
of Tushin and Morkaraman ewes at the farm of Veterinary Faculty University of Kafkas, Kars 2. Growth and body measurements. Kafkas Univ Vet Fak Derg, 2, 139-146.
31. Yilmaz I, Eyduran E, Kaygisiz A, et al. (2011): Estimates
of genetic parameters for lactation shape parameters with multivariate statistical technique in Brown Swiss cattle. Int
J Agric Biol, 13, 174-178.
Geliş tarihi: 05.04.2017 / Kabul tarihi: 12.07.2017
Address for correspondence:
Dr. Kadir ÖNK
Kafkas University, Faculty of Veterinary Medicine Department of Animal Science
TR - 36300, Kars, Turkey. Tel: +90 474 2426807/5089 e-mail: [email protected]