17
AURUM MÜHENDİSLİK SİSTEMLERİ VE MİMARLIK DERGİSİ
AURUM JOURNAL OF ENGINEERING SYSTEMS AND ARCHITECTURE Cilt 1, Sayı 2 | Kış 2017 Volume 1, No. 2 | Winter 2017, 17-29 IMPROVING IDSs ALERTS TO IMPROVE HIGH QUALITY NETWORK SECURITY BY
USING DATA MINING TECHNIQUE
Isam Kareem THAJEEL1, Osman Nuri UÇAN1, OĞUZ BAYAT1, Karim Hashim AL-SAEDI2 1 Altinbas University, School Of Science And Engineering, Turkey
2 Computer Science Dep. College Of Science-University Of Mustansiriyah, Iraq
[email protected] , [email protected]
Abstract
Intrusion-Detection-Systems (IDSs) are the best and most effective techniques when it comes to addressing the threats (such as malware and cyber-attacks etc.) being faced by computer networks; indeed, these systems have been used for more than 20 years. However, these systems generate a huge number of alerts, a large percentage of which are false or incorrect. This problem adversely affects the performance and effectiveness of network se-curity. In this paper, we propose a new system to eliminate duplicated and redundant IDS alerts; the overall aim is to improve network security by minimizing the rate of false positive alarms. This system consists of two major phases, as well as various sub-phases. The first phase involves removing duplicated alerts by applying a new fil-tering algorithm which has been prepared for this purpose. The aim of the second phase is to reduce false alerts by eliminating the redundant alerts; this is achieved by applying association rules and mining frequent itemset algorithms. This system is evaluated and tested by using five weeks of data from the DARPA 99 dataset. The re-sults show that this system significantly reduces the number of FP alarms by 97.98%. These rere-sults also demon-strate the system’s substantial ability to reduce the very large number of false alarms related to IDSs.
Keywords: Network Security; IDSs; False Positive (FP) Alert;, Alert Evaluation; Threat Degree of Alerts. VERİ MADENCİLİĞİ TEKNİĞİNİ İLE ID’LER KULLANARAK AĞ GÜVENLİĞİNİN YÜKSEK
KALİTELİ HALE GETİRİLMESİ Özet
Saldırı Tespit Sistemleri (IDS), bilgisayar ağları tarafından karşılaşılan tehditleri (kötü amaçlı yazılımlar ve siber saldırı-lar gibi) ele almaya gelince en iyi ve etkili tekniklerdir; Gerçekten de, bu sistemler 20 yıldan fazla kullanılmaktadır. Bu-nunla birlikte, bu sistemler çok sayıda uyarı üretir; bunların büyük bir yüzdesi yanlış veya yanlıştır. Bu sorun, ağ güven-liğinin performansını ve etkililiğini olumsuz olarak etkiler. Bu yazıda, çoğaltılmış ve gereksiz IDS uyarılarını ortadan kaldırmak için yeni bir sistem öneriyoruz; genel amaç, yanlış pozitif alarm oranını en aza indirerek ağ güvenliğini art-tırmaktır. Bu sistemin yanı sıra çeşitli alt safhalar olmak üzere iki ana safhadan oluşur. Birinci aşamada, bu amaçla ha-zırlanmış yeni bir filtreleme algoritması uygulayarak çoğaltılan uyarıların kaldırılması gerekir. İkinci aşamada hedef, gereksiz uyarıları ortadan kaldırarak yanlış uyarıları azaltmaktır; bu ilişki kurallarını uygulayarak ve sık öğe seti algo-ritmalarını kullanarak gerçekleştirilir. Bu sistem, DARPA 99 veri kümesindeki beş haftalık verileri kullanarak değerlendi-rilir ve test edilir. Sonuçlar, bu sistemin FP alarm sayısını% 97.98 oranında önemli ölçüde düşürdüğünü göstermekte-dir. Bu sonuçlar, aynı zamanda, sistemin IDS’lerle ilgili çok sayıda yanlış alarmı azaltma kabiliyetini de göstermektegöstermekte-dir.
18
ISAM KAREEM THAJEEL, OSMAN NURİ UÇAN, OĞUZ BAYAT, KARIM HASHIM AL-SAEDI
1. INTRODUCTION
Over the last two decades, there has been a huge increase in the usage of both network computers as well as internet access in all sectors of life; this has led to a subsequent rise in both external and internal threats to computer networks security. Of particular note is the fact that such attacks have increased rap-idly over the last few years. For example, 3 years ago, 200 new threats to networks security per minute were identified [1]. At this point, it is worth mentioning a number of defense security devices and net-work systems, such as Firewalls, Intrusion-prevention systems, Intrusion-Detection-systems (IDSs), anti-vi-rus systems, and many other systems and devices. Over recent years, these systems have been embed-ded in diverse layers and infrastructures of the computer networks. Most of these devices are designed to detect and deny the influx of malicious network traffic from inside and outside of the network; this is achieved by detecting intrusion activity and triggering alerts which enable the network security systems to block malicious traffic from accessing their destinations.
One of these systems is the Intrusion-Detection-System (IDS), which has become more popular in the field of network security since the beginning of the last decade. The work of these systems is reflected in the monitoring of incoming packets from outside or inside of the network, which are classified based on their behaviors. These alerts are generated when malicious behaviors are detected by IDSs, which pro-vide the security analyst with the chance to react instantly to the possible malicious activities [3]. More-over, of particular note is the emergence of a significant problem which has increased the frailty of the IDSs when they are used extensively. This problem relates to vast numbers of alerts generated by IDSs, which often reach thousands per day. In actual fact, most of these alarms are False-Positive (FP) alerts [2, 4]. FP alerts are alarm messages generated by the IDSs which mark a non-malicious traffic activity. The number of these alerts has increased due to rises in both malicious activity and complex network struc-tures; as such, it is practically impossible and complex to verify the legality of each alert [4].
Previous researchers have adopted different techniques and approaches to address the problems of IDS log file alerts, which are considered extremely significant when it comes to tackling the threats which have threatened computer networks security for more than 10 years. In fact, these threats are caused by hackers or intruders, who break down the network security by using different types of threats, includ-ing denial of service (DoS) attacks, U2R, Probe, and R2L [5]. IDSs represent an efficient technique when it comes to defending against attacks which target computers and networks. In actual fact, these sys-tems are considered the second defensive line in the security environment of computer networks. Nev-ertheless, the IDS systems face a significant problem in terms of the number of alerts generated, around 99% of which are FP alerts [2, 8, 9]. This problem has affected the objective of IDS systems, which is to precisely differentiate between malicious behavior and natural behavior; therefore, the FP alerts have af-fected the accuracy and the performance of IDS systems [7, 10].
This paper is arranged as follows: Section 2 presents an overview of previous approaches and research aimed at reducing the FP alarms of IDSs. Section 3 describes and explains the methodology employed in this paper, while Section 4 presents the results, along with details of the experiment and the proposed system. Finally, Section 5 summarizes the conclusions and paths for future work.
19
AURUM MÜHENDİSLİK SİSTEMLERİ VE MİMARLIK DERGİSİ
AURUM JOURNAL OF ENGINEERING SYSTEMS AND ARCHITECTURE
2. RELATED WORK
There are two different approaches which have been used to reduce the number of false positive IDS alerts: a false positive reduction in log-file alerts, and a false positive reduction, at the sensor-level, of IDSs. This paper focuses solely on the studies concerning the reduction of false positive alerts after the detection level (log-file).
Pietraszek (2006) [6] proposed an incremental classifier called ALAC, which is based on two main factors; the first factor is background knowledge, while the second factor is human analyst feedback. This study improved the limitations of the RIPPER algorithm by using batch learner and weighting to build the in-cremental classifier. However, this system has a disadvantage, as an infinite growth size is needed to test a system throughout its lifetime; as such, Pietraszek’s system is incompetent.
Along similar lines, Alshammari et al. (2007) [11] constructed a hybrid neuro-fuzzy system to minimize the false positive alerts (FP), and considered the effect of adding background knowledge to the alerts data. Their system is based on multiple factors, including Membership Function (MF), Fuzzy Sets Vari-ables, Rule Weights, Learning Rate, Cross-validation, and Number of Epochs. The MFs provided by NEF-CLASS include Trapezoidal, Triangular, List function, and Bell-shaped. In actual fact, they used all four of these MFs with Confidence Factor (CF=0.99) within background knowledge classes. Moreover, they em-ployed different Fuzzy variables (including 3, 4, and 5 variables). This approach was tested by using the first three weeks of the DARPA 99 dataset, while the other weeks were used to evaluate the system. Their system reduced the false alarms efficiently by 90.92%; this was achieved through the use of (IP class with 10 features) 4 Fuzzy Sets Variables with trapezoid MF.
Another approach, this time based on data mining, was proposed by Zhang and Al-Mamory (2010) [14]; the main objective of this technique is to reduce (FP) false positive alerts. Their approach aimed to cre-ate a generalized alert from each cluster when the alerts are gathered into sets of clusters. To reduce the number of future alerts, this technique converted the root causes into a filter. The authors took into ac-count the concept of nearest neighboring and generalization in their proposed technique. As part of this technique, a new measurement was used to calculate the distances between alert feature values. This in-volved performing a calculation process based on the background knowledge of the observed network. This approach was evaluated by using the fifth week of the DARPA 99 dataset, with the results showing a reduction average of around 82% of the total alerts used.
Mohiuddin and Ahmed (2014) [15] proposed a new method based on improving the K-Means algo-rithm. Their approach was called CAD (Collective_Anomaly_Detection), while their improved algorithm was termed X-Means. They employed this improved algorithm to cluster the alerts and thus distinguish the anomaly alerts from normal alerts by measuring the similarity between the alerts’ datasets. Follow-ing this, they clustered the anomaly alerts to detect the DoS attacks. Their approach is examined by us-ing the DARPA dataset, and this examination is based on only four attributes from the dataset, includus-ing Des_IP, Src_IP, Protocol_type, and Payload_length to detect DoS attacks. In actual fact, their approach fo-cused on detecting only the DoS attacks, despite the fact that these datasets contained various types of attacks, such as U2R, R2L, and Probe.
20
ISAM KAREEM THAJEEL, OSMAN NURİ UÇAN, OĞUZ BAYAT, KARIM HASHIM AL-SAEDI
3. METHODOLOGY
Over the past few years, malicious attacks on computers have become an increasingly critical and com-plicated problem. Intrusion-detection-systems are used to look for the intrusive activity, which differs from normal activity. Thus, the IDSs are used to achieve the main security goals: integrity, confidentiality, and availability of computer networks and system [13]. The purpose of using the IDSs is to complement the existing infrastructure of networks security measures. As such, the aim of IDSs is to monitor the net-work traffic, to detect the malicious traffic activity, and generate alarm notifications when the potential intrusion activity is detected. Therefore, the IDSs are considered a main and integral part of computer networks security, and the second line of defense for the networks and systems. Nevertheless, these sys-tems generate a number of alarms, 99% of which are false positive alerts [12]. The proposed system is very considerable, and eliminates the duplicated and redundant alerts. This system has been designed using C# language, and consists of two main phases, namely the Filtering Duplicate Alerts (FDA) phase and the Alert Threat Evaluation (ATE) phase. Figure 1 describes the architecture of the proposed system.
Src_IP, Protocol_type, and Payload_length to detect DoS attacks. In actual fact, their approach focused on detecting only the DoS attacks, despite the fact that these datasets contained various types of attacks, such as U2R, R2L, and Probe.
III. METHODOLOGY
Over the past few years, malicious attacks on computers have become an increasingly critical and complicated problem. Intrusion-detection-systems are used to look for the intrusive activity, which differs from normal activity. Thus, the IDSs are used to achieve the main security goals: integrity, confidentiality, and availability of computer networks and system [13]. The purpose of using the IDSs is to complement the existing infrastructure of networks security measures. As such, the aim of IDSs is to monitor the network traffic, to detect the malicious traffic activity, and generate alarm notifications when the potential intrusion activity is detected. Therefore, the IDSs are considered a main and integral part of computer networks security, and the second line of defense for the networks and systems. Nevertheless, these systems generate a number of alarms, 99% of which are false positive alerts [12]. The proposed system is very considerable, and eliminates the duplicated and redundant alerts. This system has been designed using C# language, and consists of two main phases, namely the Filtering Duplicate Alerts (FDA) phase and the Alert Threat Evaluation (ATE) phase. Figure 1 describes the architecture of the proposed system.
Figure 1: The Proposed System architecture
The first process of the system involves extracting the standard attributes from the alerts database. This system provides the system analyst and system administrator with the ability to choose the significant attributes; indeed, one attribute is selected from the DARPA dataset to be a Transaction-ID (TID), following which several attributes are selected to generate frequent itemsets with these TIDs.
A. Filtering Duplicate Alerts (FDAs) phase
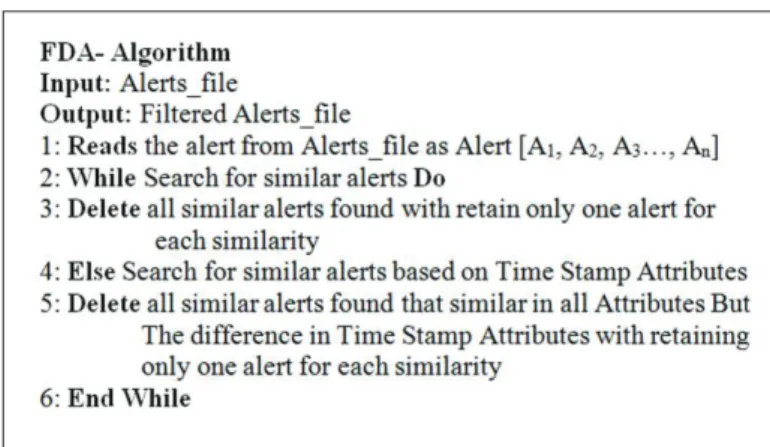
The aim of the FDA phase is to remove duplicated alerts, which constitute the majority of false positive (FP) alerts [18]; this will be achieved by using the proposed new algorithm to filter said alerts. In this section, we explain the method behind the aforementioned algorithm. Figure 2 shows the pseudocode of the Filtering Duplicate Alerts (FDAs) phase.
IDS logs file
DB Preparing the data and
features extraction
Counter for output alerts Filtering
Alerts
Alert threat evaluation phase
DB
Filtering duplicate alerts phase
Eclat Mining Frequent
Itemsets Generate Rules for
Frequent Itemset, TDI, TDA K-Means TDA Clustering Counter for input alerts
Figure 1. The Proposed System architecture
The first process of the system involves extracting the standard attributes from the alerts database. This system provides the system analyst and system administrator with the ability to choose the significant attributes; indeed, one attribute is selected from the DARPA dataset to be a Transaction-ID (TID), follow-ing which several attributes are selected to generate frequent itemsets with these TIDs.
1.1 Filtering Duplicate Alerts (FDAs) phase
The aim of the FDA phase is to remove duplicated alerts, which constitute the majority of false positive (FP) alerts [18]; this will be achieved by using the proposed new algorithm to filter said alerts. In this sec-tion, we explain the method behind the aforementioned algorithm. Figure 2 shows the pseudocode of the Filtering Duplicate Alerts (FDAs) phase.
21
AURUM MÜHENDİSLİK SİSTEMLERİ VE MİMARLIK DERGİSİ
AURUM JOURNAL OF ENGINEERING SYSTEMS AND ARCHITECTURE
Src_IP, Protocol_type, and Payload_length to detect DoS attacks. In actual fact, their approach focused on detecting only the DoS attacks, despite the fact that these datasets contained various types of attacks, such as U2R, R2L, and Probe.
III. METHODOLOGY
Over the past few years, malicious attacks on computers have become an increasingly critical and complicated problem. Intrusion-detection-systems are used to look for the intrusive activity, which differs from normal activity. Thus, the IDSs are used to achieve the main security goals: integrity, confidentiality, and availability of computer networks and system [13]. The purpose of using the IDSs is to complement the existing infrastructure of networks security measures. As such, the aim of IDSs is to monitor the network traffic, to detect the malicious traffic activity, and generate alarm notifications when the potential intrusion activity is detected. Therefore, the IDSs are considered a main and integral part of computer networks security, and the second line of defense for the networks and systems. Nevertheless, these systems generate a number of alarms, 99% of which are false positive alerts [12]. The proposed system is very considerable, and eliminates the duplicated and redundant alerts. This system has been designed using C# language, and consists of two main phases, namely the Filtering Duplicate Alerts (FDA) phase and the Alert Threat Evaluation (ATE) phase. Figure 1 describes the architecture of the proposed system.
Figure 1: The Proposed System architecture
The first process of the system involves extracting the standard attributes from the alerts database. This system provides the system analyst and system administrator with the ability to choose the significant attributes; indeed, one attribute is selected from the DARPA dataset to be a Transaction-ID (TID), following which several attributes are selected to generate frequent itemsets with these TIDs.
A. Filtering Duplicate Alerts (FDAs) phase
The aim of the FDA phase is to remove duplicated alerts, which constitute the majority of false positive (FP) alerts [18]; this will be achieved by using the proposed new algorithm to filter said alerts. In this section, we explain the method behind the aforementioned algorithm. Figure 2 shows the pseudocode of the Filtering Duplicate Alerts (FDAs) phase.
IDS logs file
DB
Preparing the data and features extraction
Counter for output alerts Filtering
Alerts
Alert threat evaluation phase
DB
Filtering duplicate alerts phase
Eclat Mining Frequent
Itemsets Generate Rules for
Frequent Itemset, TDI, TDA K-Means TDA Clustering Counter for input alerts
Figure 2. The Pseudocode of FDA Phase
As shown in Figure 2, this phase passes through two sub-processes. The first sub-process is designed to find any similarities between the items of the alert attributes. There are two pointers which are used to read the items of the alerts; the first alert from the database is read by the first pointer, while the second alert is read by the second pointer, so as to make a comparison between the items of the alerts attributes for these two alerts. The second alert will be deleted, and the first alert will only be kept if the similarity exists. If no similarity exists, the second pointer will be moved from the second alert to the third alert, and so on until all the alerts have been compared and those with similarities have been identified. The second sub-process is based on similarities between the alerts attributes and the Timestamp attributes. This process removes the duplicated alerts when similarities are found between attributes’ items that have only differences in timestamp and when these values of timestamp are very close to each other; indeed, the latter situation indicates that these alerts are generated from a single event but in succes-sive and very close time periods.
1.2 Alert Threat Evaluation (ATE) phase
The ATE phase is considered the main part of the proposed system. This phase consists of three sub-phases, each of which is responsible for performing a function. The function of the first sub-phase is to mine frequent itemsets which are based on the Eclat algorithm, as will be explained in Section 3.2.1. The second sub-phase is accountable for generating rules for frequent itemsets and establishing the threat degree based on the improved Generate Rules algorithm; the second sub-phase and the function of the third sub-phase, which is responsible for clustering the threat degree of alerts based on the K-Mean al-gorithm, will be explained in Section 3.2.2.
1.2.1 Eclat algorithm
This section presents a detailed explanation of the process of the standard Eclat algorithm in mining fre-quent itemsets. This algorithm is developed and enhanced so as it is possible to implement the items of the single alerts attribute. Moreover, this enhancement helps to turn the itemsets of the alerts feature into
22
ISAM KAREEM THAJEEL, OSMAN NURİ UÇAN, OĞUZ BAYAT, KARIM HASHIM AL-SAEDI
more convenient approaches. This algorithm is characterized by its high flexibility when applied with the different types of items data of alert attributes without specifying whether or not these items are digital. Indeed, this enhanced algorithm performs very well. Figure 3 shows the pseudocode of the ECLAT algo-rithm [16]. The objective of this sub-phase is to mine frequent 1-itemsets and frequent 2-itemsets with their support values, which will be the input for the second sub-phase.
Figure 2: The Pseudocode of FDA Phase
As shown in Figure 2, this phase passes through two sub-processes. The first sub-process is designed to find any similarities between the items of the alert attributes. There are two pointers which are used to read the items of the alerts; the first alert from the database is read by the first pointer, while the second alert is read by the second pointer, so as to make a comparison between the items of the alerts attributes for these two alerts. The second alert will be deleted, and the first alert will only be kept if the similarity exists. If no similarity exists, the second pointer will be moved from the second alert to the third alert, and so on until all the alerts have been compared and those with similarities have been identified. The second sub-process is based on similarities between the alerts attributes and the Timestamp attributes. This process removes the duplicated alerts when similarities are found between attributes’ items that have only differences in timestamp and when these values of timestamp are very close to each other; indeed, the latter situation indicates that these alerts are generated from a single event but in successive and very close time periods.
B. Alert Threat Evaluation (ATE) phase
The ATE phase is considered the main part of the proposed system. This phase consists of three sub-phases, each of which is responsible for performing a function. The function of the first sub-phase is to mine frequent itemsets which are based on the Eclat algorithm, as will be explained in Section 3.2.1. The second sub-phase is accountable for generating rules for frequent itemsets and establishing the threat degree based on the improved Generate Rules algorithm; the second sub-phase and the function of the third sub-phase, which is responsible for clustering the threat degree of alerts based on the K-Mean algorithm, will be explained in Section 3.2.2.
1) Eclat algorithm
This section presents a detailed explanation of the process of the standard Eclat algorithm in mining frequent itemsets. This algorithm is developed and enhanced so as it is possible to implement the items of the single alerts attribute. Moreover, this enhancement helps to turn the itemsets of the alerts feature into more convenient approaches. This algorithm is characterized by its high flexibility when applied with the different types of items data of alert attributes without specifying whether or not these items are digital. Indeed, this enhanced algorithm performs very well. Figure 3 shows the pseudocode of the ECLAT algorithm [16]. The objective of this sub-phase is to mine frequent 1-itemsets and frequent 2-itemsets with their support values, which will be the input for the second sub-phase.
Figure 3: Pseudocode of the Eclat Algorithm [17]
As shown in Figure 3, step 1 accompanies the items (CØ) with their TIDs and counts the length of their TID_lists. Step 4 involves
mining for frequent items whose TID_lists length is equal to or greater than the min_sup threshold from the candidate items generated in step 3. Following this, step 6 adds these frequent items into F, which represents the 1-itemset.
Figure 3. Pseudocode of the Eclat Algorithm [17]
As shown in Figure 3, step 1 accompanies the items (CØ) with their TIDs and counts the length of their TID_lists. Step 4 involves mining for frequent items whose TID_lists length is equal to or greater than the min_sup threshold from the candidate items generated in step 3. Following this, step 6 adds these fre-quent items into F, which represents the 1-itemset.
This function of the Eclat algorithm, from step 8 to step 16, scans only the frequent items that are gener-ated from the previous process without the need to rescan the origin database. To generate the 2-can-didate frequent itemsets (Cq) from F, which is called the prefix, it is necessary to join each pair of items and then find the intersection in their TID_lists; this process is implemented in step 10. Counting the length of intersected TID_lists for each pair of items ( ) to be these values as the support value for these items. Step 11 searches for any pairs of items that have a support value which satisfies the min_ sup threshold. Steps 12-15 are used to add the generated frequent 2-itemsets to F (large frequent item-sets), so that they can be processed later to generate 3-itemsets. Interestingly, this process is repeated many times until no new frequent itemsets are found. In fact, the proposed system intentionally makes the min_sup threshold of the Eclat algorithm equal to 1. As such, there will be no infrequent candidates.
23
AURUM MÜHENDİSLİK SİSTEMLERİ VE MİMARLIK DERGİSİ
AURUM JOURNAL OF ENGINEERING SYSTEMS AND ARCHITECTURE
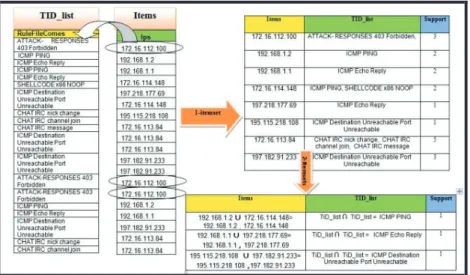
Thus, the implementation of this algorithm in our approach will suffice with the findings from only the 1-it-emsets and 2-itemsets. The Eclat algorithm will generate an abundance of frequent items due to the min_sup value which has been used in this approach; as such, no infrequent itemsets will be found. Fig-ure 4 explains an example to trace the behavior of the Eclat algorithm with min_sup=1 based on [17]. Firstly, the algorithm extracts items from alerts attributes and calculates their support value by ensuring that each item is accompanied by its TIDs to generate 1-itemset (support value represents how many times this item appears with this TID and the other TIDs). Secondly, the algorithm joins each of the two items with their TIDs from frequent 1-itemset to generate the 2-itemset by intersecting the TIDs of each two joined items, as shown in the example in Figure 4.
This function of the Eclat algorithm, from step 8 to step 16, scans only the frequent items that are generated from the previous
process without the need to rescan the origin database. To generate the 2-candidate frequent itemsets (Cq) from F, which is called
the prefix, it is necessary to join each pair of items and then find the intersection in their TID_lists; this process is implemented in
step 10. Counting the length of intersected TID_lists for each pair of items ( ) to be these values as the support value for these
items. Step 11 searches for any pairs of items that have a support value which satisfies the min_sup threshold. Steps 12-15 are
used to add the generated frequent 2-itemsets to F (large frequent itemsets), so that they can be processed later to generate
3-itemsets. Interestingly, this process is repeated many times until no new frequent itemsets are found. In fact, the proposed system
intentionally makes the min_sup threshold of the Eclat algorithm equal to 1. As such, there will be no infrequent candidates.
Thus, the implementation of this algorithm in our approach will suffice with the findings from only the 1-it-emsets and 2-itemsets.
The Eclat algorithm will generate an abundance of frequent items due to the min_sup value which has been used in this approach;
as such, no infrequent itemsets will be found. Figure 4 explains an example to trace the behavior of the Eclat algorithm with
min_sup=1 based on [17]. Firstly, the algorithm extracts items from alerts attributes and calculates their support value by ensuring
that each item is accompanied by its TIDs to generate 1-itemset (support value represents how many times this item appears with
this TID and the other TIDs). Secondly, the algorithm joins each of the two items with their TIDs from frequent 1-itemset to
generate the 2-itemset by intersecting the TIDs of each two joined items, as shown in the example in Figure 4.
Figure 4: The Implementation of the Eclat Algorithm
2) Rules Generation algorithm
The second sub-phase of the second phase (ATE) is responsible for generating rules for frequent 2-itemsets and then calculating
the threat degree for each item (TDI) while also extracting the threat degree for each alert (TDA). This algorithm is the same as
the generation-rule algorithm, but is improved to calculate the TDI for each item and TDA for each alert. While the original
algorithm generates rules only and calculates the confidence value, this improved algorithm calculates the threat degree of items
based on equation (1). Moreover, this improved algorithm extracts the threat degree of alerts depending on equation (2). As such,
these functions of the Rules Generation algorithm are passed through three processes. The improved algorithm is explained in
detail in Figure 5.
Figure 4. The Implementation of the Eclat Algorithm
1.2.2 Rules Generation algorithm
The second sub-phase of the second phase (ATE) is responsible for generating rules for frequent 2-item-sets and then calculating the threat degree for each item (TDI) while also extracting the threat degree for each alert (TDA). This algorithm is the same as the generation-rule algorithm, but is improved to cal-culate the TDI for each item and TDA for each alert. While the original algorithm generates rules only and calculates the confidence value, this improved algorithm calculates the threat degree of items based on equation (1). Moreover, this improved algorithm extracts the threat degree of alerts depending on equa-tion (2). As such, these funcequa-tions of the Rules Generaequa-tion algorithm are passed through three processes. The improved algorithm is explained in detail in Figure 5.
24
ISAM KAREEM THAJEEL, OSMAN NURİ UÇAN, OĞUZ BAYAT, KARIM HASHIM AL-SAEDI
Figure 5: The Pseudocode of the Rules Generation Algorithm
The first process of the ATE phase involves generating rules for frequent itemsets; these steps (1-3) read the 1-itemsets and 2-itemsets, following which rules are generated only for the 2-itemsets. This is identical to the condition of association rules in steps 4-17. The gen-rules function is responsible for generating rules and calculating the confidence degree for each rule; the confidence degree is extracted after the rules are generated based on equation (1). This equation will apply if the 2-itemset is A, B [20]:
(1)
The second process is applied based on the equation in step 18 after extracting all rule sets with confidence degrees for frequent 2-itemsets. In addition, this equation is proposed to calculate the (TDI) for each item. In essence, this equation is completely based on the rules with confidence degrees that are extracted during the first process through the gen-rules function. This equation was designed based on the fact that erroneous faults are the most frequent alerts, and all elements of a single alarm have a direct relationship with the other alert elements of the same attribute. More specifically, the value of confidence has a forthright influence on the relationship between the items and their impact on each other. This value also depends on the support value and the impact of each item on the other, which in fact represents the number of repeated items. Accordingly, TDI is calculated based on equation (2), as follows:
(2)
The aim of the third process is to extract the threat degree of each alert (TDA) after the threat degree of each item (TDI) has been extracted via the second process of the improved rule generation algorithm. The input for this process is the TDI, and thus all alerts contain several items, each of which has a TDI value. The output of this process is the TDA for each alert; these values represent the input for the last sub-phase of the second phase of the proposed system (K-Means clustering). Each item has a TDI value, but to obtain the TDA for each alert, equation (3) should be applied, as follows:
(3)
The last sub-phase of this system is the K-Means algorithm. The inputs of this sub-phase are the attributes of the TDA values. An effectively-performing K-Means algorithm should provide two attributes values for each object if said algorithm is able to find the distance between these attributes’ values by applying the Euclidian distance equation. However, the output of the ATE phase of this system is only one attribute value. As such, this sub-phase has one attribute element (TDA) for each alert; in this case, the attribute elements depend on the method put forth by [19], which states that the K-Means algorithm will be transformed from one method to another. The first method involves finding the similarity among the items by calculating the distances between these items either using Euclidean or Manhattan measures; in contrast, the new method calculates the mean value of k-distributions. Figure 5. The Pseudocode of the Rules Generation Algorithm
The first process of the ATE phase involves generating rules for frequent itemsets; these steps (1-3) read the 1-itemsets and 2-itemsets, following which rules are generated only for the 2-itemsets. This is iden-tical to the condition of association rules in steps 4-17. The gen-rules function is responsible for gener-ating rules and calculgener-ating the confidence degree for each rule; the confidence degree is extracted af-ter the rules are generated based on equation (1). This equation will apply if the 2-itemset is A, B [20]:
(1)
The second process is applied based on the equation in step 18 after extracting all rule sets with confi-dence degrees for frequent 2-itemsets. In addition, this equation is proposed to calculate the (TDI) for each item. In essence, this equation is completely based on the rules with confidence degrees that are extracted during the first process through the gen-rules function. This equation was designed based on the fact that erroneous faults are the most frequent alerts, and all elements of a single alarm have a di-rect relationship with the other alert elements of the same attribute. More specifically, the value of con-fidence has a forthright influence on the relationship between the items and their impact on each other. This value also depends on the support value and the impact of each item on the other, which in fact represents the number of repeated items. Accordingly, TDI is calculated based on equation (2), as follows:
(2)
The aim of the third process is to extract the threat degree of each alert (TDA) after the threat degree of each item (TDI) has been extracted via the second process of the improved rule generation algorithm. The input for this process is the TDI, and thus all alerts contain several items, each of which has a TDI
25
AURUM MÜHENDİSLİK SİSTEMLERİ VE MİMARLIK DERGİSİ
AURUM JOURNAL OF ENGINEERING SYSTEMS AND ARCHITECTURE
value. The output of this process is the TDA for each alert; these values represent the input for the last sub-phase of the second phase of the proposed system (K-Means clustering). Each item has a TDI value, but to obtain the TDA for each alert, equation (3) should be applied, as follows:
(3)
The last sub-phase of this system is the K-Means algorithm. The inputs of this sub-phase are the attri-butes of the TDA values. An effectively-performing K-Means algorithm should provide two attriattri-butes val-ues for each object if said algorithm is able to find the distance between these attributes’ valval-ues by ap-plying the Euclidian distance equation. However, the output of the ATE phase of this system is only one attribute value. As such, this sub-phase has one attribute element (TDA) for each alert; in this case, the attribute elements depend on the method put forth by [19], which states that the K-Means algorithm will be transformed from one method to another. The first method involves finding the similarity among the items by calculating the distances between these items either using Euclidean or Manhattan mea-sures; in contrast, the new method calculates the mean value of k-distributions. Each attribute item is represented as a point in this distribution. This sub-phase generates two distribution groups to classify the alerts based on threat degrees for said alerts. This algorithm clusters the alerts into two classes based on C1 (centroid 1) and C2 (centroid 2) values, which represent the threshold values of clustering; indeed, these values play the main role in determining the reduction ratio for false alerts. The output of this al-gorithm consists of two groups of alerts (G1 and G2), which represent the false positive alerts and true positive alerts (real attacks) respectively.
4. RESULT
The proposed system was tested and evaluated by using the DARPA 99 dataset to compare its results with the results of other researchers who have used the same dataset within the same area of research. The experiment was conducted using different clustering threshold values. The total number of alerts from this dataset is 59,720 in a five-week period. This data is generated by MIT Lincoln lab between 16th
September 1999 and 1st October 1999 [16]. This dataset has been used partially and entirely so as to
com-pare it with other studies which have also used the dataset partially or entirely. The proposed system provided the system analysts with the ability to increase the number of attributes which can be used. The clustering threshold plays a significant role in the classification of alerts based on the process of cal-culating the similarities of TDA for alerts among k-distributions; several results were obtained using sev-eral different thresholds (0.10-0.40), (0.20-0.50) and (0.25-0.75). For these thresholds of clustering, the ob-tained averages alert reduction ratios are used, namely 88.48%, 93.6%, and 97.98% respectively.
Experiment 1: This experiment has been conducted by using five weeks of the DARPA 99 dataset in order
to compare its result with those generated by other authors. The parameters that are used in this exper-iment are as follows: First is the dataset; five weeks of a DARPA 99 dataset are used, consisting of 59,720 alerts. Second is the No. of Attributes that are selected; indeed, six attributes are selected (the system analyst can change the No. of Attributes). Third is the Min_sup threshold, where the minimum support used is equal to 1, as explained in detail in Section 3 (the system analyst can also change this threshold).
26
ISAM KAREEM THAJEEL, OSMAN NURİ UÇAN, OĞUZ BAYAT, KARIM HASHIM AL-SAEDI
Finally, there are the clustering thresholds; in this experiment, there are several thresholds used, including: (0.10-0.40), (0.20-0.50) and (0.25-0.75). Moreover, the system analyst can change these thresholds values. Based on the results of this experiment, it is clear that the (0.25-0.75) threshold has the highest and best reduction ratio when compared with the other thresholds used in said experiment.
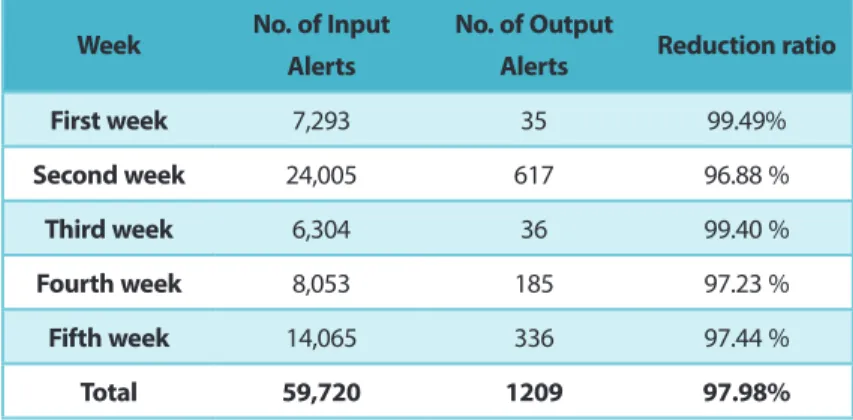
In particular, the first week and the third week have generated an extremely high reduction ratio rate, as shown in Table 1. Despite a high number of alerts in the second, fourth, and fifth weeks which are used by our system, this number does not exceed the number of alerts used in other systems. However, the system does generate a higher reduction percentage than the previous systems.
Figure 2 explains the reduction ratio for these five weeks with threshold (0.25-0.75), as follows: Table 1. Results of the DARPA 99 Datasets from our System
Week No. of Input Alerts
No. of Output
Alerts Reduction ratio
First week 7,293 35 99.49% Second week 24,005 617 96.88 % Third week 6,304 36 99.40 % Fourth week 8,053 185 97.23 % Fifth week 14,065 336 97.44 % Total 59,720 1209 97.98%
Here, it is important to compare the results of the proposed approach with those of other previous ap-proaches; the results which have been obtained by [6] and [14] are compared in Table 2. These studies used all five weeks of the DARPA 1999 dataset.
Table 2. Comparison of the results for five weeks from DARPA dataset with Other Approaches Approaches No. input alerts No. output alerts Weeks Reduction Ratio %
(Pietraszek, 2006) 59,512 23,925 5 weeks 60%
(Al-Mamory et al., 2010) 233,615 4,2051 5 weeks 82%
Proposed system 2017 59,720 1,209 5 weeks 97.98%
Table 2 shows the results of the study by Pietraszek et al. (2006), who unveiled a lower reduction rate, despite the number of alerts used in relation to the number of alerts used by our system. In contrast,
27
AURUM MÜHENDİSLİK SİSTEMLERİ VE MİMARLIK DERGİSİ
AURUM JOURNAL OF ENGINEERING SYSTEMS AND ARCHITECTURE
Al-Mamory et al. (2010) obtained a good ratio of reduction, despite a very high number of input alerts being used. Finally, the proposed system has obtained efficient results when compared with these ap-proaches.
Experiment 2: In order to compare the result obtained in this experiment with the approach of [11], two
weeks of the DARPA 99 dataset are used. This experiment is evaluated by using the fourth and fifth weeks from the DARPA 99 dataset. The experiment was conducted using the same parameters as those used in experiment 1. Table 2 shows the results for the fourth and fifth weeks of the proposed system, where the total number of alerts used in the experiment is equal to 22,118, with an average reduction rate of 97.35% [( 97.32+97.44)/2]. Table 3 shows the comparison of the result obtained in this experiment using the same two weeks and the approaches put forth by [11].
Table 3. Comparison of the results for fourth and fifth weeks from the DARPA dataset with [11] approach.
Approaches No. input alerts No. output alerts Weeks Reduction Ratio %
(Al-Shammari et al., 2007) 27,877 7,118 2 weeks 90.2%
Proposed system 2017 22,118 521 2 weeks 97.35%
Despite the good results achieved by employing the Al-Shammari method, better results were generated by the proposed system. This demonstrates the effectiveness and high viability of the proposed system in identifying and detecting false alerts of IDSs.
5. CONCLUSION
The system proposed here has been designed to reduce the number of FP alerts through two processes: filtering duplicate alerts and evaluating redundant alerts. The aim of both processes is to improve and generate a high-quality network security by solving all the problems that hinder the work of the systems analyst and affect the performance of IDSs. In actual fact, this system has achieved all of its objectives in the present paper by reducing the large number of false positive alerts during the FDA phase and the ATE phase. The main objective of the second phase is to calculate the TDA through three sub-phase pro-cesses, namely mining frequent itemsets, generating rules for frequent itemsets (which involves calculat-ing the degree of threat for each item as well as calculatcalculat-ing the degree of threat for each alert implicitly within this algorithm), and k-means clustering sub-phases. The efficiency of the generation-rule algo-rithm has been improved, as clearly shown by the results of the proposed system. For example, by using the first and third weeks of the DARPA 99 dataset, it has been possible to test the efficiency of the sys-tem. This system has produced a reduction ratio of 99.48%, which is the best result in comparison with the fact that these two weeks consist entirely of false alerts (free attack label).
Consequently, the proposed system generated a high reduction ratio of 97.98% when the entirety of the DARPA dataset was used. When all of the alerts which were entered into this sub-phase were evaluated,
28
ISAM KAREEM THAJEEL, OSMAN NURİ UÇAN, OĞUZ BAYAT, KARIM HASHIM AL-SAEDI
most of said alerts were evaluated and classified as FP alerts, with the lowest degree of threat ranging from 0.060-0.370. Moreover, the alerts which were classified as true alerts were also evaluated, with threat degrees (TDA) ranging from 0.65-0.95. The values show that these alerts are the most threatening when compared to the rest of the other alerts; said values also indicate that these alerts are alerts resulting from a real attack. This conclusion is based on the obtained results, which show that the strong perfor-mance of the ATE phase results in improved efficiency for the system as a whole. Thus, the second phase can be considered an integral part of the system in reducing false alarms; indeed, this subsequently re-sults in a high-resolution reduction of the redundant alerts.
6. REFERENCES
[1] McAfee Labs (2013). McAfee Labs Threats Report. available in “https://www.mcafee.com/us/re-sources/reports”
[2] Julisch, K. Dealing with false positives in intrusion detection. available in “ http://www.raid-sympo-sium.org/”, 2000.
[3] Axelsson, S. 1999. The base-rate fallacy and its implications for the difficulty of intrusion detection. In CCS ’99: Proceedings of the 6th ACM conference on Computer and communications security, 1–7, New York, NY, USA. ACM.
[4] Manganaris, S., Christensen, M., Zerkle, D., & Hermiz, K. 2000. A data mining analysis of rtid alarms. Comput. Netw., 34(4), 571–577.
[5] Julisch, K. (2003). Using root cause analysis to handle intrusion detection alarms PhD thesis, Uni-versity of Dortmund (2003).
[6] Pietraszek, T., ”Using Adaptive Alert Classification to Reduce False Positives in Intrusion Detection,” Recent Advances in Intrusion Detection: 7th International Symposium RAID 2004, pp. 102-124, Sep-tember 2004.
[7] Tjhai G. C. (2011). Anomaly-Based Correlation of IDS Alarms, PhD thesis, The University of Plymouth, UK.
[8] Magi, F., Matteucci, M. & Zanero, S. (2009). Reducing false positives in anomaly detectors through fuzzy alert aggregation, Information Fusion. 10,300-311.
[9] Adnan, A. H. (2009). Multithreaded scalable matching algorithm for intrusion detection system. Uni-versity Sains Malaysia, PhD Thesis.
[10] El-Taj, H., Abouabdalla, O., Manasrah, A., Al-Madi, A., Sarwar, M.I., & Ramadass, S. (2010). Forth-coming aggregating intrusion detection system alerts framework. In Emerging Security Information Systems and Technologies (SECURWARE), 2010 Fourth International Conference. 40-44. IEEE. [11] Alshammari, R., Sonamthiang, S., Teimouri, M., & Riordan, D. (2007). Using Neuro-Fuzzy
Ap-proach to Reduce False Positive Alerts, Communication Networks and Services Research, 2007. CNSR ‘07. Fifth Annual Conference on, 345-349. Doi:10.1109/CNSR.2007.70
29
AURUM MÜHENDİSLİK SİSTEMLERİ VE MİMARLIK DERGİSİ
AURUM JOURNAL OF ENGINEERING SYSTEMS AND ARCHITECTURE
[12] Elshoush & Osman. (2011). Alert correlation in collaborative intelligent intrusion detection system-A survey . Applied Soft Computing Journal, 11, 4349-4365.
[13] Hackmageddon.com, _Cyber attacks statistics,_ http://hackmageddon.com/2013-cyber-attacks-sta-tistics/, Aug 2013.
[14] Al-Mamory, S. O. & Zhang, H. (2010). New data mining technique to enhance IDS alarms quality, Journal in computer virology, Vol. 6, No. 1,43-55. Doi:10.1007/s11416-008-0104-2.
[15] Mohiuddin Ahmed, Abdun Naser Mohmood, “Network Traffic Analysis based on Collective Anom-aly Detection” 9th Conference on Industrial Electronics and Application ICIEA, 2014 IEEE,PIN:
978-1-4799-4315-9/14.
[16] Lippmann, R.,J. W. Haines, et al. (2000a).” The 1999 DRPA off-line intrusion detection evaluation”, Computer Networks-the International Journal of Computer and Telecommunications Networking 34(4): 579-595.
[17] Lars Schmidt-Thieme, “Algorithmic Features of Eclat” Conference: FIMI’04, Proceedings of the IEEE ICDM Workshop on Frequent Itemsets Mining Implementation, Brighton, UK, November 1, 2004. [18] Khanchi, s.,& Adibnia, F.(2002). False alert reduction on network-based intrusion detection system
by means of feature frequencies. Advances in Computing , Control, & Telecommunication Technolo-gies, 2009. ACT ‘09. International conference on vol., no., 513,516,28-29 Dec.2009. doi: 10.1109/ACT. 2009.221
[19] Kardi Teknomo. K-Means Clustering Tutorials. 2007”.http:\\people.revoledu .com\kardi\ tutorial\ kMean\”
[20] Lior Rokach and Oded Maimon, Data Mining and Knowledge Discovery Handbook, Tell-Aviv Uni-versity, 2005, pp 321-349.SPIN 11053125,11411963.


![Table 3. Comparison of the results for fourth and fifth weeks from the DARPA dataset with [11] approach.](https://thumb-eu.123doks.com/thumbv2/9libnet/5476281.106081/11.833.120.739.429.511/table-comparison-results-fourth-fifth-darpa-dataset-approach.webp)
