A STATISTICAL APPROACH TO ESTIMATE THE WIND
SPEED DISTRIBUTION: THE CASE OF GELIBOLU REGION
RÜZGAR HIZI DAĞILIMININ TAHMİN EDİLMESİ İÇİN İSTATİSTİKSEL BİR YAKLAŞIM: GELİBOLU BÖLGESİ ÖRNEĞİ
Veysel YILMAZ, H. Eray ÇELİK
Department of Statistics, Science and Literature Faculty, Eskişehir Osmangazi University
ABSTRACT: Wind energy is renewable and environment friendly. It is an
alternative clear energy source compared to the fossil fuels that pollute the lower layer of atmosphere. The most important parameter of the wind energy is the wind speed. Statistical methods are useful for estimating wind speed because it is a random phenomena. For this reason, wind speed probabilities can be estimated by using probability distributions. An accurate determination of probability distribution for wind speed values is very important in evaluating wind speed energy potential of a region. In this study, first, we tried to determine appropriate theoretical pdf (probability density function) by comparing 10 pdf for the wind speed data measured for Gelibolu region. In determining proper pdf , an approach consisting of 3 goodness of fit tests and fitted graphics have been used.
Keywords: Wind speed, Estimation, Probability distribution, Statistical goodness of
fit tests.
ÖZET: Rüzgar enerjisi yenilenebilir ve çevre dostu bir enerjidir. Rüzgar enerjisi
atmosferi kirleten fosil yakıtlarıyla kıyaslandığında, temiz enerji kaynağı için bir alternatiftir. Rüzgar enerjisinin potansiyelinin en önemli parametresi rüzgar hızıdır. Rüzgar hızı rassal olay olarak tanımlandığı için rüzgar hız tahminlerinde istatistiksel yöntemleri kullanmak yararlıdır. Bu nedenle rüzgar hızı, olasılık dağılımları kullanılarak tahmin edilebilir. Bir bölgenin rüzgar hızı enerji potansiyelinin değerlendirilmesi ve tahmini için geçerli bir olasılık dağılımının belirlenmesi çok önemlidir. Bu çalışmada Gelibolu bölgesinde ölçülen rüzgar hızı verilerini temsil edebilecek uygun bir olasılık dağılımı 10 dağılım karşılaştırılarak belirlenmeye çalışılmıştır. Bu amaçla üç uyum iyiliği testi ve grafik yöntemi kullanılmıştır.
Anahtar Kelimeler: Rüzgar hızı, Tahmin, Olasılık dağılımı, İstatistiksel uyum iyiliği
testleri.
1. Introduction
Energy need of the world increases 4-5% every year whereas fossil fuel reserves covering that need decrease much faster than the need. In addition, with increasing negative effects of fossil fuels on environment, mainly developed countries and others have begun using renewable energy sources. Nowadays, the fastest developing and most common used energy source is the wind energy. Wind energy is a form of solar energy; it is an air current created by the balance between pressure and temperature differences due to the different distribution of solar heat coming to Earth. Wind energy is a clean and renewable alternative source of energy potential to fossils based energy sources polluting the lower layer atmosphere. Since wind
energy is a clean and renewable energy, systems transforming wind power to electrical energy has been developing quite fast (Aras, et al. 2003). Turkey is a rapidly growing energy consumer and its domestic energy production has not exceeded half of energy demand. Energy is essential to the economic and social development, and will improve the quality of life in Turkey as in other countries. Because of some technological and economical consequences, renewable energy sources do not have wide applications either in the world or in Turkey at present (Yılmaz et al., 2004).
The most important parameter of the wind energy is the wind speed. For this reason, an accurate determination of probability distribution of wind speed values is very important in evaluating wind speed energy potential of a region. Wind energy potential can be determined by wind measurements of a certain investigation region depending on years. In the literature, the Weibull distribution is commonly used in the practical studies related to the wind energy modeling (for example, Auwera et al. 1980; Rehman et al., 1994; Lun and Lan, 2000; Seguro and Lambert, 2000; Ulgen and Hepbasli, 2002; Weisser, 2003; Celik, 2003; Stewens et al., 1979; Toure, 2005; Zhou et al., 2006). The Ramirez and Carta’s study (2005) on this subject is the most popular one. By using statistical tests, the authors have shown the fit of wind speed to the Weibull distribution step by step. However, these studies are performed through priori acceptance. Probability density function of wind speed is not always statistically accepted as Weibull pdf. For realization of this acceptance, different pdf distributions should be investigated and incorporated to the analyses. For this reason, in this study, data set obtained from Gelibolu region, which takes the first place in electricity generation from wind in Turkey, has been used. In this study, we tried to determine appropriate theoretical pdf distribution by comparing 10 pdf distributions (Beta, Erlang, Exponential, Gamma, Log-Logistic, Lognormal, Pearson V, Pearson VI, Uniform and Weibull) for the wind speed data measured in Gelibolu region. In determining proper theoretical pdf distribution, an approach consisting of 3 goodness of fit tests (Chi-square, Kolmogorov Smirnov and Anderson-Darling) and fitted graphics have been used.
2. Wind Speed Data
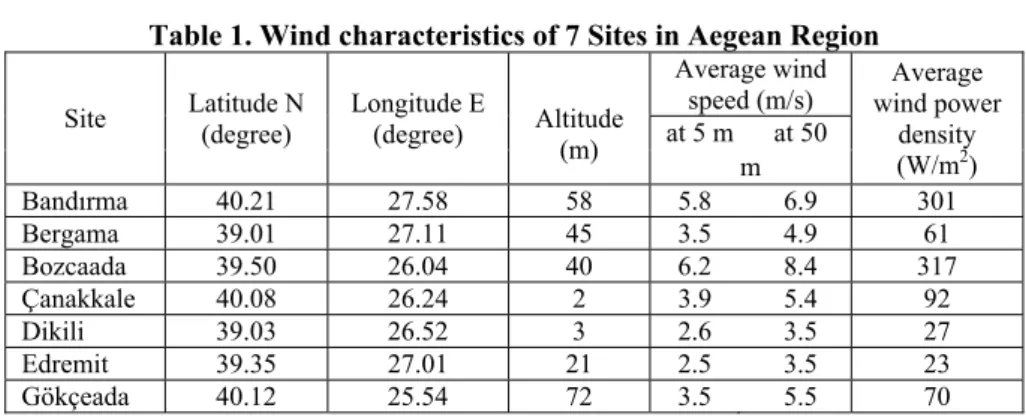
In this study, regular and complete measurement data, aiming energy, taken by General Directorate of Electrical Power Resources Survey and Administration in Gelibolu station (North-West Turkey) for 2003 have been used. Measurements related to this station are very important, because being the most convenient region in generating energy from wind, Aegean Region stretching from Gelibolu to Datca, especially Muğla, takes the first place in electricity generation from wind in Turkey. In addition, the region accommodation natural resources such as forested areas and national parks, and due to this, exhibit a difference from other regions of Turkey. 2x160 MW Çan Thermic Plant has been constructed in a distance of 45 km to the Gelibolu National Park. Wind characteristics of some areas take place in Aegean Region are given in Table 1 (Oztopal et al., 2000; Şen and Şahin, 1998).
Table 1. Wind characteristics of 7 Sites in Aegean Region
Site Latitude N (degree) Longitude E (degree) Altitude (m)
Average wind
speed (m/s) wind power Average density (W/m2) at 5 m at 50 m Bandırma 40.21 27.58 58 5.8 6.9 301 Bergama 39.01 27.11 45 3.5 4.9 61 Bozcaada 39.50 26.04 40 6.2 8.4 317 Çanakkale 40.08 26.24 2 3.9 5.4 92 Dikili 39.03 26.52 3 2.6 3.5 27 Edremit 39.35 27.01 21 2.5 3.5 23 Gökçeada 40.12 25.54 72 3.5 5.5 70
3. Determination of the Proper Distribution for Wind Speed Data
Characteristic
Probability distributions and functions used to modeling them mathematically are the most used media for wind speed estimation. In the literature, Weibull and Rayleigh are among the most used functions for this purpose (Tuller and Brett, 1984; Xi and Tang, 2002; Bivona et al., 2003). These are used for modeling probability distribution of wind speed measured in a certain time and place. However, to assume Weibull distribution without any statistical test always may result in errors in determining theoretical distribution of wind speed. For that reason, in addition to Weibull distribution, effectiveness of theoretical probability distributions such as Beta, Earlang, Exponential, Gamma, Log-logistic, Lognormal, Pearson V, Pearson VI, Uniform have been investigated with the aid of 3 goodness of fit tests namely, Anderson-Darling, Kolmogorov Smirnov and Chi-Square tests. Statistical tests are given below.
3.1. Goodness of Fit Tests
In determination of the effective distribution, the test statistics summarized briefly below have been used.
Kolmogorov - Smirnov Test
The Kolmogorov-Smirnov (K-S) test is used to decide if a sample comes from a population with a specific distribution. The (K-S) test is based on the empirical distribution function (ECDF). Given n ordered data points Y1,Y2,…,Yn, the ECDF is defined as
E
n= n(i)/N
wheren(i)
is the number of points less than Yi and Yi are ordered from smallest to largest value. This is a step function that increases by 1/N at the value of each ordered data point.An attractive feature of this test is that the distribution of the K-S test statistic itself does not depend on the underlying cumulative distribution function being tested. Another advantage is that it is an exact test (the chi-square goodness-of-fit test depends on an adequate sample size for the approximations to be valid). Despite these advantages, the K-S test has several important limitations:
1) It only applies to continuous distributions.
2) It tends to be more sensitive near the center of the distribution than at the tails. 3) Perhaps the most serious limitation is that the distribution must be fully
the data, the critical region of the K-S test is no longer valid. It typically must be determined by simulation.
Due to limitations 2 and 3 above, many analysts prefer to use the Anderson-Darling goodness-of-fit test. However, the Anderson-Darling test is only available for a few specific distributions. The test is calculated as:
H0: The data follow a specific distribution. H1: The data do not follow the specific distribution
N i Y F N i D= ≤ ≤ ( i)− 1 max (1)
where F is the theoretical cumulative distribution of the distribution being tested which must be a continuous distribution (i.e., no discrete distributions such as the binomial or Poisson), and it must be fully specified (i.e., the location, scale, and shape parameters cannot be estimated from the data). The hypothesis regarding the distributional form is rejected if the test statistic, D, is greater than the critical value obtained from a table. There are several variations of these tables in the literature that use somewhat different scalings for the K-S test statistic and critical regions. These alternative formulations should be equivalent, but it is necessary to ensure that the test statistic is calculated in a way that is consistent with how the critical values were tabulated.
Anderson- Darling Test
The Anderson-Darling test is used to test if a sample of data came from a population with a specific distribution. It is a modification of the (K-S) test and gives more weight to the tails than does the K-S test. The K-S test is distribution free in the sense that the critical values do not depend on the specific distribution being tested. The Anderson-Darling test makes use of the specific distribution in calculating critical values. This has the advantage of allowing a more sensitive test and the disadvantage that critical values must be calculated for each distribution. Currently, tables of critical values are available for the normal, lognormal, exponential, Weibull, extreme value type I, and logistic distributions (Anderson and Darling 1954; Law and Kelton 1991).
The Anderson - Darling test statistic is defined by A2= -N-S where
[
ln
(
)
ln(
1
(
))
]
1
2
1 1 i N i N iY
F
Y
F
N
i
S
+− =−
+
−
=
∑
(2)F is the cumulative distribution function of the specified distribution. Note that the Yi are the ordered data. The critical values for the Anderson-Darling test are dependent on the specific distribution that is being tested. Tabulated values and formulas have been published for a few specific distributions (normal, lognormal, exponential, Weibull, logistic, extreme value type 1). The test is a one-sided test and the hypothesis that the distribution is of a specific form is rejected if the test statistic, A, is greater than the critical value. Note that for a given distribution, the
Anderson-Darling statistic may be multiplied by a constant (which usually depends on the sample size, n). This is what should be compared against the critical values. Also, be aware that different constants (and therefore critical values) have been published. You just need to be aware of what constant was used for a given set of critical values (the needed constant is typically given with the critical values).
Chi-Square Test
The chi-square test is used to test if a sample of data came from a population with a specific distribution. An attractive feature of the chi-square goodness-of-fit test is that it can be applied to any univariate distribution for which you can calculate the cumulative distribution function. The chi-square goodness-of-fit test is applied to binned data (i.e., data put into classes).
Some disadvantages of the test are
• the value of the chi-square test statistic are dependent on how the data is binned.
• it requires a sufficient sample size in order for the chi-square approximation to be valid.
The statistic is calculated as
∑
=
−
=
r
i
E
i
i
E
i
O
1
2
)
(
2
χ
(3)where Oi is the observed frequency for bin and Ei is the expected frequency for bin and is calculated by Ei= N(F(Yu) -F(Yl)) where F is the cumulative distribution function and Yu and Yl are the upper and lower limits for class i. The test statistic follows, approximately, a chi-square distribution with (k - c) degrees of freedom where k is the number of non-empty cells and c = the number of estimated parameters for the distribution + 1. Therefore, the hypothesis that the data are from a population with the specified distribution is rejected if
χ
χ
α 2 , 2 c k− > where
χ
α2,k−cthechi-square percent is point function with k - c degrees of freedom and a significance level of the
α
(http://cheminfo.informatics.indiana.edu/~rguha/writing/notes/stats/ node11.html).3.2. Hypothesis and Decision Rule
In order to decide which distribution fits to wind speed data that measured by the aid of statistical fitness tests, first, a null hypothesis is set, then test statistic is computed, and finally, considering decision rule of the null hypothesis, it is decided to accept or reject. Null hypotheses can be defined as:
H0: Estimated probability distribution represents wind speed data set.
Decision rules for acceptation or rejection of the hypothesis formulated as above are given below:
a) If the table value (critical value) is greater than the computed value, accept H0; otherwise reject H0.
b) While the test statistic for each test can be useful, the p-value for each test is more useful in determining the goodness of fit.
The p-value is defined as the probability that another sample will be as unusual as the current sample given that the fit is appropriate. A small p-value indicates that the current sample is highly unlikely, and, therefore, the fit should be rejected. Conversely, a high p-value indicates that the sample is likely and would be repeated, and, therefore, the fit should not be rejected. Thus, the higher the p-value, the more likely that the fit is appropriate. While comparing two different fitted distributions, the distribution with the higher p-value is likely to be the better fit regardless of the level of significance (If
p
>
α
, accept H0).4. Statistical Analysis
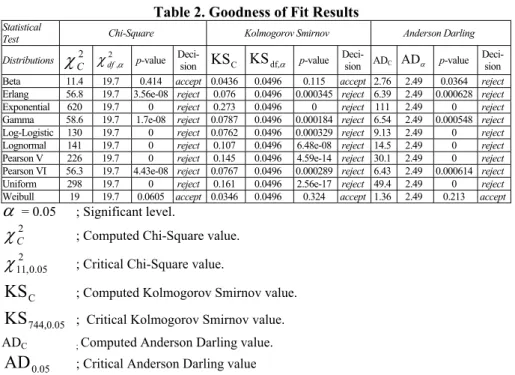
The analysis results of the test statistics used in determination of the effective distribution are given in Table 2. Decision rule results revealed that Beta distribution is accepted according to Chi-square and KS tests, but it is rejected according to Anderson-Darling test statistics. As it can be seen in the last row of the Table 2, the Weibull distribution is accepted according to all of the three tests. For this reason, the distribution best representing the set of data is the Weibull Distribution. When the results given in Table 2 are reviewed, it will be seen that Rayleigh distribution had not been used in determination of effective distribution. The Rayleigh distribution is used in presence of a data set composed of mean wind speed (Pashardes and Chiristofides
,
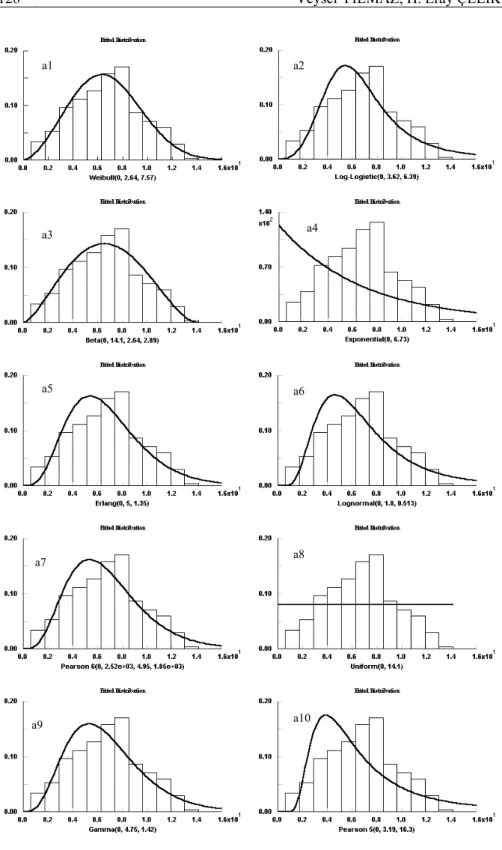
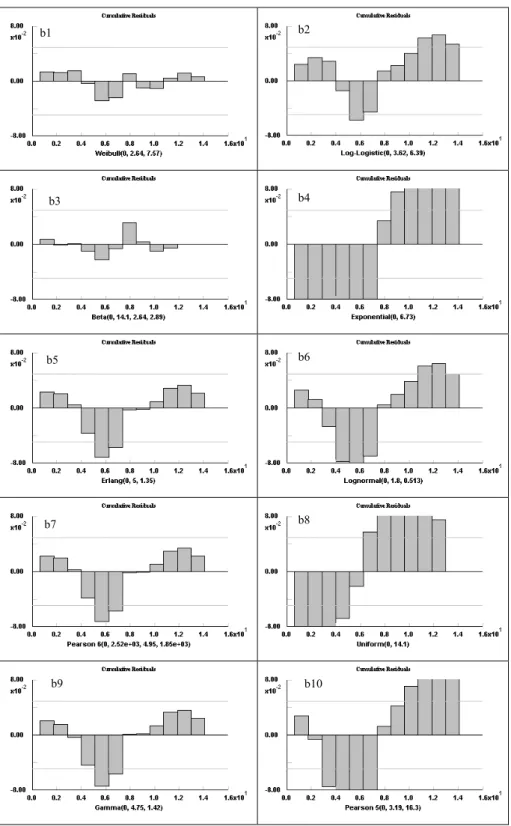
1995). Measured wind speeds and graphics of probability distributions used are given in Figure 1 and Figure 2. Measurement values and estimated distribution are given in the same graphic in Figure 1. Distribution name and computed parameter values are given below the graphics. When the graphics are reviewed it can easily be seen that Weibull (a1) and Beta (a3) distributions give the best fitness.Figure 2 shows graphics of residuals (difference between measured value and estimated value) for theoretical distributions. Areas on the graphics show disharmony. Large areas on the graphics show that the difference of the measured and estimated values is great. Consequently, if the area of the residuals increases then the distributions’ representation ability of data sets will decrease. In Figure 2, error areas are the smallest for Weibull (b1) and Beta (b3) distributions. In this study, goodness of fit tests, fitted graphics and graphics of cumulative residuals of distributions approaches have been used in determination of the best fitting distribution. All of the three results have supported each other. Since results revealed that the best fitting distribution representing the data is Weibull, we will focus on this distribution hereafter. In order to make predictions by the help of probability distributions, the first thing to be done is the estimation of distribution parameters. There are different methods to estimate shape and scale parameters of Weibull distribution (Gupta, 1986; Dorvlo, 2002; Xi and Tang, 2002; Yılmaz and Çelik, 2004). The three methods mostly used in estimation of parameters are Least Squares (Regression) Method (LSM), Maximum Likelihood Estimation (MLE) and Method of Moments (MOM).
Figure 1. Fitted Distribution (a1-a10) a1 a3 a5 a7 a9 a2 a4 a6 a8 a10
Figure 2. Cumulative Residuals of Distributions (b1-b10) b1 b2 b3 b5 b7 b4 b6 b9 b10 b8
4.2. Compare of Estimation Techniques
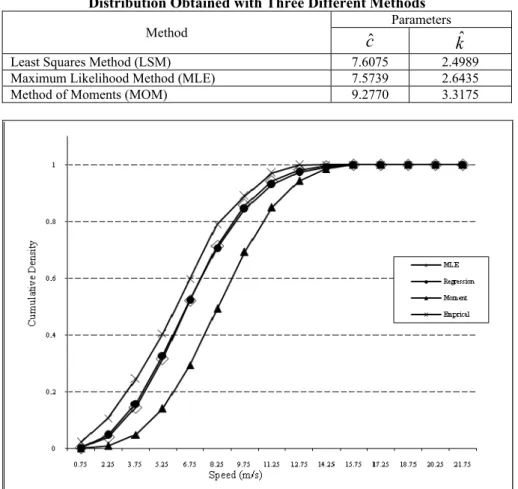
Table 3 gives shape and scale estimation values of Weibull distribution computed by using three different methods. In Table 3, it is seen that c and k parameters estimated per MLE and LSM techniques are close each other and different from parameters obtained by using MOM. The plot of the empirical distribution and the estimated Weibull distribution is in Figure 3. Figure 3 reveals that shape and scale parameters’ values estimated with MLE and LSM methods best fit with measured data set. For this reason, to use parameters estimated with MLE and LSE techniques will ensure to obtain more effective results during estimation by using Weibull distribution.
Table 3. Estimation Values of Shape and Scale Parameters of Weibull Distribution Obtained with Three Different Methods
Method
cˆ
Parameterskˆ
Least Squares Method (LSM) 7.6075 2.4989
Maximum Likelihood Method (MLE) 7.5739 2.6435
Method of Moments (MOM) 9.2770 3.3175
Figure 3. Estimated Cumulative Density Functions for Each Method
5. Conclusion
Decision on whether to make an investment or not for the wind plant planned to be built in a region is made by the help of speed data measured for the region. Therefore distribution of the wind speeds in that region is investigated for long years. Since wind speeds are explained as random events, it is expected to fit a probability distribution, therefore the distribution, which the wind speed fitting, is investigated. In the literature studies, without any investigation of the fitness, wind
speeds were assumed to be distributed Weibull. Significance level cannot be seen for the decisions made by the help of this assumption without using any statistical goodness of fit test. But, while making scientific decisions, reliability of the decision and obviousness of the error ratio are very important keys in estimation and investment projects to be made by the help of this decision. Since decisions made through statistical tests are in certain confidence level, they provide researchers with the significance level information of their decisions. In this study, an approach has been proposed including statistical goodness of fit tests for research process of this fitness. This approach covers goodness of fit tests, fitted graphics and graphics of cumulative residuals of distributions. Ten candidate distributions were compared for the goodness of fit tests. At the end of the comparison, Weibull has been determined to be the best distribution representing wind data. This decision has been made at 95% confidence level and 5% significance level.
Table 2. Goodness of Fit Results
Statistical
Test Chi-Square Kolmogorov Smirnov Anderson Darling Distributions
χ
C2 χdf2,α p-value Deci- sion KSC KSdf,α p-value Deci- sion ADC ADα p-value Deci- sionBeta 11.4 19.7 0.414 accept 0.0436 0.0496 0.115 accept 2.76 2.49 0.0364 reject
Erlang 56.8 19.7 3.56e-08 reject 0.076 0.0496 0.000345 reject 6.39 2.49 0.000628 reject
Exponential 620 19.7 0 reject 0.273 0.0496 0 reject 111 2.49 0 reject Gamma 58.6 19.7 1.7e-08 reject 0.0787 0.0496 0.000184 reject 6.54 2.49 0.000548 reject
Log-Logistic 130 19.7 0 reject 0.0762 0.0496 0.000329 reject 9.13 2.49 0 reject Lognormal 141 19.7 0 reject 0.107 0.0496 6.48e-08 reject 14.5 2.49 0 reject Pearson V 226 19.7 0 reject 0.145 0.0496 4.59e-14 reject 30.1 2.49 0 reject Pearson VI 56.3 19.7 4.43e-08 reject 0.0767 0.0496 0.000289 reject 6.43 2.49 0.000614 reject Uniform 298 19.7 0 reject 0.161 0.0496 2.56e-17 reject 49.4 2.49 0 reject Weibull 19 19.7 0.0605 accept 0.0346 0.0496 0.324 accept 1.36 2.49 0.213 accept
α
= 0.05 ; Significant level.2
C
χ
; Computed Chi-Square value.2 05 . 0 , 11
χ
; Critical Chi-Square value.C
KS
; Computed Kolmogorov Smirnov value.44,0.05 7
KS
; Critical Kolmogorov Smirnov value. ADC ; Computed Anderson Darling value..05 0
AD
; Critical Anderson Darling valueReferences
ANDERSON, T.W., DARLING, D.A. (1954). A Test of Goodness of Fit, Journal of
American Statistics Association, pp. 765-767.
ARAS, H., YILMAZ, V., ÇELİK, H.E. (2003). Estimation of Monthly Wind Speeds of Eskişehir,Turkey. The First International Exergy, Energy and Environment
Symposium, Hotel Princess, Izmir, Turkey 13-17 July.
AUWERA V., MEYER L.F., MALET LM. (1980). The use of the Weibull three parameter model for estimating mean wind power densities. Journal of Apply
Meteorology, vol.19,pp. 819–825.
BIVONA, S., BURLON, R., LEONE C. (2003). Hourly wind speed analysis in Sicily.
Renewable Energy, vol. 28, pp. 1371-1385.
ÇELİK, A.N. (2003) A statistical analysis of wind power density based on the Weibull and Rayleigh models at the southern region of Turkey. Renewable Energy, vol.29, no.4, pp.593–604.
DORVLO, S.S. A. (2002) Estimating wind speed distribution. Energy Conversion and
Management, vol.43, pp. 2311-2318.
GUHA, R., (2004). Statistic lecture notes. Statistical definitions, [Online] Available at: <http://cheminfo.informatics.indiana.edu/~rguha/writing/notes/stats/node11.html>, [ Erişim tarihi 26.04.2007].
GUPTA B.K. (1986) Weibull parameters for annual and monthly wind speed distributions for five locations in India. Solar Energy, vol.37, pp. 469–71.
LAW A.M. and KELTON W.D. (1991) Simulation Modeling and Analysis. McGraw-Hill.
LUN, I.Y.F., LAN J.C. (2000) A study of Weibull parameters using long-term wind observations. Renewable Energy, vol.20, pp.145–53.
OZTOPAL, A, SAHIN, A.D., SEN Z. (200) On the regional wind energy potential of Turkey. Energy, vol.25, pp.189-200.
PASHARDES, S., CHRISTOFIDES, C. (1995) Statistical analysis of wind speed and direction in Cyprus. Solar Energy, vol. 55, no.5, pp.405-414.
Published by the General Directorate of Turkish State Meteorological Service and the General Directorate of Electrical Power Resources Survey Administration, Data Bank, Ankara, Turkey, 2003.
RAMIREZ, P., CARTA, J.A. (2005) Influence of the data sampling interval in the estimation of the parameters of the Weibull wind speed probability density distribution: a case study. Energy Conversion and Management, vol.46, pp. 2419– 2438.
REHMAN, S., HALAWANI T.O., HUSAIN, T. (1994) Weibull parameters for wind speed distribution in Saudi Arabia. Solar Energy, vol.53, pp.473–9.
SEGURO, J.V., LAMBERT, T.W. (200) Modern estimation of the parameters of the Weibull wind speed distribution for wind energy analysis. Journal of Wind
Engineering and Industrial Aerodynamics, vol.85, pp. 75-84.
STEVENS, M., SMULDERS, P.T. (1979). The estimation of the parameters of the Weibull wind speed distribution for wind energy utilization purposes. Wind Energy
,pp. 132-145.
TOURE, S. (2005) Investigations on the Eigen-coordinates method for the 2-parameter Weibull distribution of wind speed. Renewable Energy, vol.30, pp.511-521.
TULLER, S.E., BRETT, A.C. (1984) The characteristics of wind velocity that favor the fitting of a Weibull distribution in wind speed analysis. Journal of Apply
Meteorology, vol.23, pp.124-34.
SEN Z., SAHIN A.D (1998) Regional wind energy evaluation in some parts of Turkey.
Journal of Wind Engineering and Industrial Aerodynamics, vol.74-76, pp.345-353.
ULGEN, K., HEPBASLI, A. (2002) Determination of Weibull parameters for wind energy analysis of İzmir, Turkey. International Journal of Energy Research., vol.26, no.6, pp.495–506.
YILMAZ, V., ÇELİK, H.E. (2004) The estimation of earthquake risk in Eskişehir, Turkey. Anadolu University Journal of Science and Technology, vol.5, no.2, pp.279-283
YILMAZ, V., ARAS,H., ARAS, N., ÇELIK,H.E. (2004) Estimation of Monthly Wind Speed By Using Least Squares & Exponantial Smoothing Technique. An
International Symposium Cappadocia-Urgup, Turkey,July 14-16.
XI, M.Y., TANG, A. (2002) Modified Weibull Extension With Bathtub-Shaped Failure Rate Function. Reliability Engineering and System Safety, vol.76, pp.279-285. WEISSER, D. (2003) A wind energy analysis of Grenada: an estimation using the
‘Weibull’ density function. Renewable Energy, vol. 28 ,pp. 1803–1812.
ZHOU, W., YANG, H., FANG Z. (2006) Wind power potential and characteristic analysis of the Pearl River Delta region, China. Renewable Energy, vol.31, pp. 739-753.