arXiv:1307.2022v1 [hep-ex] 8 Jul 2013
Measurement of the integrated luminosities of the data taken by
BESIII at
√
s = 3.650 and 3.773 GeV
*M. Ablikim1, M. N. Achasov7,a, O. Albayrak4, D. J. Ambrose40, F. F. An1, Q. An41, J. Z. Bai1, R. Baldini Ferroli18A,
Y. Ban27, J. Becker3, J. V. Bennett17, M. Bertani18A, J. M. Bian39, E. Boger20,b, O. Bondarenko21, I. Boyko20,
R. A. Briere4, V. Bytev20, H. Cai45, X. Cai1, O. Cakir35A, A. Calcaterra18A, G. F. Cao1, S. A. Cetin35B, J. F. Chang1,
G. Chelkov20,b, G. Chen1, H. S. Chen1, J. C. Chen1, M. L. Chen1, S. J. Chen25, X. Chen27, X. R. Chen22, Y. B. Chen1, H. P. Cheng15, Y. P. Chu1, D. Cronin-Hennessy39, H. L. Dai1, J. P. Dai1, D. Dedovich20, Z. Y. Deng1, A. Denig19,
I. Denysenko20, M. Destefanis44A,44C, W. M. Ding29, Y. Ding23, L. Y. Dong1, M. Y. Dong1, S. X. Du47, J. Fang1, S. S. Fang1, L. Fava44B,44C, C. Q. Feng41, P. Friedel3, C. D. Fu1, J. L. Fu25, O. Fuks20,b, Y. Gao34, C. Geng41, K. Goetzen8,
W. X. Gong1, W. Gradl19, M. Greco44A,44C, M. H. Gu1, Y. T. Gu10, Y. H. Guan37, A. Q. Guo26, L. B. Guo24, T. Guo24,
Y. P. Guo26, Y. L. Han1, F. A. Harris38, K. L. He1, M. He1, Z. Y. He26, T. Held3, Y. K. Heng1, Z. L. Hou1, C. Hu24,
H. M. Hu1, J. F. Hu36, T. Hu1, G. M. Huang5, G. S. Huang41, J. S. Huang13, L. Huang1, X. T. Huang29, Y. Huang25,
T. Hussain43, C. S. Ji41, Q. Ji1, Q. P. Ji26, X. B. Ji1, X. L. Ji1, L. L. Jiang1, X. S. Jiang1, J. B. Jiao29, Z. Jiao15, D. P. Jin1, S. Jin1, F. F. Jing34, N. Kalantar-Nayestanaki21, M. Kavatsyuk21, Kloss19, B. Kopf3, M. Kornicer38, W. Kuehn36, W. Lai1,
J. S. Lange36, M. Lara17, P. Larin12, M. Leyhe3, C. H. Li1, Cheng Li41, Cui Li41, D. M. Li47, F. Li1, G. Li1, H. B. Li1, J. C. Li1, K. Li11, Lei Li1, Q. J. Li1, S. L. Li1, W. D. Li1, W. G. Li1, X. L. Li29, X. N. Li1, X. Q. Li26, X. R. Li28, Z. B. Li33,
H. Liang41, Y. F. Liang31, Y. T. Liang36, G. R. Liao34, X. T. Liao1, D. Lin12, B. J. Liu1, C. L. Liu4, C. X. Liu1, F. H. Liu30,
Fang Liu1, Feng Liu5, H. Liu1, H. B. Liu10, H. H. Liu14, H. M. Liu1, H. W. Liu1, J. P. Liu45, K. Liu34, K. Y. Liu23,
P. L. Liu29, Q. Liu37, S. B. Liu41, X. Liu22, Y. B. Liu26, Z. A. Liu1, Zhiqiang Liu1, Zhiqing Liu1, H. Loehner21, X. C. Lou1,c,
G. R. Lu13, H. J. Lu15, J. G. Lu1, X. R. Lu37, Y. P. Lu1, C. L. Luo24, M. X. Luo46, T. Luo38, X. L. Luo1, M. Lv1,
C. L. Ma37, F. C. Ma23, H. L. Ma1, Q. M. Ma1, S. Ma1, T. Ma1, X. Y. Ma1, F. E. Maas12, M. Maggiora44A,44C,
Q. A. Malik43, Y. J. Mao27, Z. P. Mao1, J. G. Messchendorp21, J. Min1, T. J. Min1, R. E. Mitchell17, X. H. Mo1, H. Moeini21, C. Morales Morales12, K. Moriya17, N. Yu. Muchnoi7,a, H. Muramatsu40, Y. Nefedov20, C. Nicholson37,
I. B. Nikolaev7,a, Z. Ning1, S. L. Olsen28, Q. Ouyang1, S. Pacetti18B, J. W. Park38, M. Pelizaeus3, H. P. Peng41, K. Peters8, J. L. Ping24, R. G. Ping1, R. Poling39, E. Prencipe19, M. Qi25, S. Qian1, C. F. Qiao37, L. Q. Qin29, X. S. Qin1, Y. Qin27,
Z. H. Qin1, J. F. Qiu1, K. H. Rashid43, G. Rong1, X. D. Ruan10, A. Sarantsev20,d, M. Shao41, C. P. Shen2, X. Y. Shen1,
H. Y. Sheng1, M. R. Shepherd17, W. M. Song1, X. Y. Song1, S. Spataro44A,44C, B. Spruck36, D. H. Sun1, G. X. Sun1,
J. F. Sun13, S. S. Sun1, Y. J. Sun41, Y. Z. Sun1, Z. J. Sun1, Z. T. Sun41, C. J. Tang31, X. Tang1, I. Tapan35C,
E. H. Thorndike40, D. Toth39, M. Ullrich36, I. Uman35B, G. S. Varner38, B. Wang1, D. Wang27, D. Y. Wang27, K. Wang1, L. L. Wang1, L. S. Wang1, M. Wang29, P. Wang1, P. L. Wang1, Q. J. Wang1, S. G. Wang27, X. F. Wang34, X. L. Wang41,
Y. D. Wang18A, Y. F. Wang1, Y. Q. Wang19, Z. Wang1, Z. G. Wang1, Z. Y. Wang1, D. H. Wei9, J. B. Wei27, P. Weidenkaff19, Q. G. Wen41, S. P. Wen1, M. Werner36, U. Wiedner3, L. H. Wu1, N. Wu1, S. X. Wu41, W. Wu26, Z. Wu1,
L. G. Xia34, Y. X Xia16, Z. J. Xiao24, Y. G. Xie1, Q. L. Xiu1, G. F. Xu1, G. M. Xu27, Q. J. Xu11, Q. N. Xu37, X. P. Xu32, Z. R. Xu41, Z. Xue1, L. Yan41, W. B. Yan41, Y. H. Yan16, H. X. Yang1, Y. Yang5, Y. X. Yang9, H. Ye1, M. Ye1, M. H. Ye6,
B. X. Yu1, C. X. Yu26, H. W. Yu27, J. S. Yu22, S. P. Yu29, C. Z. Yuan1, Y. Yuan1, A. A. Zafar43, A. Zallo18A, S. L. Zang25,
Y. Zeng16, B. X. Zhang1, B. Y. Zhang1, C. Zhang25, C. C. Zhang1, D. H. Zhang1, H. H. Zhang33, H. Y. Zhang1,
J. Q. Zhang1, J. W. Zhang1, J. Y. Zhang1, J. Z. Zhang1, LiLi Zhang16, R. Zhang37, S. H. Zhang1, X. J. Zhang1,
X. Y. Zhang29, Y. Zhang1, Y. H. Zhang1, Z. P. Zhang41, Z. Y. Zhang45, Zhenghao Zhang5, G. Zhao1, H. S. Zhao1, J. W. Zhao1, K. X. Zhao24, Lei Zhao41, Ling Zhao1, M. G. Zhao26, Q. Zhao1, S. J. Zhao47, T. C. Zhao1, X. H. Zhao25,
Y. B. Zhao1, Z. G. Zhao41, A. Zhemchugov20,b, B. Zheng42, J. P. Zheng1, Y. H. Zheng37, B. Zhong24, L. Zhou1, X. Zhou45, X. K. Zhou37, X. R. Zhou41, C. Zhu1, K. Zhu1, K. J. Zhu1, S. H. Zhu1, X. L. Zhu34, Y. C. Zhu41, Y. M. Zhu26, Y. S. Zhu1,
Z. A. Zhu1, J. Zhuang1, B. S. Zou1, J. H. Zou1 (BESIII Collaboration)
1 Institute of High Energy Physics, Beijing 100049, People’s Republic of China
∗ Supported in part by the Ministry of Science and Technology of China under Contract No. 2009CB825200; National Natural Science Foundation of China (NSFC) under Contracts Nos. 10625524, 10821063, 10825524, 10835001, 10935007, 11125525, 11235011; Joint Funds of the National Natural Science Foundation of China under Contracts Nos. 11079008, 11179007; the Chinese Academy of Sciences (CAS) Large-Scale Scientific Facility Program; CAS under Contracts Nos. KJCX2-YW-N29, KJCX2-YW-N45; 100 Talents Program of CAS; German Research Foundation DFG under Contract No. Collaborative Research Center CRC-1044; Istituto Nazionale di Fisica Nucleare, Italy; Ministry of Development of Turkey under Contract No. DPT2006K-120470; U. S. Department of Energy under Contracts Nos. DE-FG02-04ER41291, DE-FG02-05ER41374, DE-FG02-94ER40823; U.S. National Science Foundation; University of Groningen (RuG) and the Helmholtzzentrum fuer Schwerionenforschung GmbH (GSI), Darmstadt; WCU Program of National Research Foundation of Korea under Contract No. R32-2008-000-10155-0.
2 Beihang University, Beijing 100191, People’s Republic of China 3 Bochum Ruhr-University, D-44780 Bochum, Germany 4 Carnegie Mellon University, Pittsburgh, Pennsylvania 15213, USA 5 Central China Normal University, Wuhan 430079, People’s Republic of China
6 China Center of Advanced Science and Technology, Beijing 100190, People’s Republic of China 7 G.I. Budker Institute of Nuclear Physics SB RAS (BINP), Novosibirsk 630090, Russia
8 GSI Helmholtzcentre for Heavy Ion Research GmbH, D-64291 Darmstadt, Germany 9 Guangxi Normal University, Guilin 541004, People’s Republic of China
10 GuangXi University, Nanning 530004, People’s Republic of China 11 Hangzhou Normal University, Hangzhou 310036, People’s Republic of China 12 Helmholtz Institute Mainz, Johann-Joachim-Becher-Weg 45, D-55099 Mainz, Germany
13 Henan Normal University, Xinxiang 453007, People’s Republic of China
14 Henan University of Science and Technology, Luoyang 471003, People’s Republic of China 15Huangshan College, Huangshan 245000, People’s Republic of China
16 Hunan University, Changsha 410082, People’s Republic of China 17 Indiana University, Bloomington, Indiana 47405, USA
18(A)INFN Laboratori Nazionali di Frascati, I-00044, Frascati, Italy; (B)INFN and University of Perugia, I-06100, Perugia,
Italy
19 Johannes Gutenberg University of Mainz, Johann-Joachim-Becher-Weg 45, D-55099 Mainz, Germany 20 Joint Institute for Nuclear Research, 141980 Dubna, Moscow region, Russia
21 KVI, University of Groningen, NL-9747 AA Groningen, The Netherlands 22 Lanzhou University, Lanzhou 730000, People’s Republic of China 23 Liaoning University, Shenyang 110036, People’s Republic of China 24 Nanjing Normal University, Nanjing 210023, People’s Republic of China
25Nanjing University, Nanjing 210093, People’s Republic of China 26 Nankai university, Tianjin 300071, People’s Republic of China 27 Peking University, Beijing 100871, People’s Republic of China
28 Seoul National University, Seoul, 151-747 Korea 29 Shandong University, Jinan 250100, People’s Republic of China
30Shanxi University, Taiyuan 030006, People’s Republic of China 31Sichuan University, Chengdu 610064, People’s Republic of China
32 Soochow University, Suzhou 215006, People’s Republic of China 33 Sun Yat-Sen University, Guangzhou 510275, People’s Republic of China
34 Tsinghua University, Beijing 100084, People’s Republic of China
35 (A)Ankara University, Dogol Caddesi, 06100 Tandogan, Ankara, Turkey; (B)Dogus University, 34722 Istanbul, Turkey;
(C)Uludag University, 16059 Bursa, Turkey
36 Universitaet Giessen, D-35392 Giessen, Germany
37 University of Chinese Academy of Sciences, Beijing 100049, People’s Republic of China 38 University of Hawaii, Honolulu, Hawaii 96822, USA
39 University of Minnesota, Minneapolis, Minnesota 55455, USA 40 University of Rochester, Rochester, New York 14627, USA
41 University of Science and Technology of China, Hefei 230026, People’s Republic of China 42University of South China, Hengyang 421001, People’s Republic of China
43 University of the Punjab, Lahore-54590, Pakistan
44 (A)University of Turin, I-10125, Turin, Italy; (B)University of Eastern Piedmont, I-15121, Alessandria, Italy; (C)INFN,
I-10125, Turin, Italy
45 Wuhan University, Wuhan 430072, People’s Republic of China 46 Zhejiang University, Hangzhou 310027, People’s Republic of China 47 Zhengzhou University, Zhengzhou 450001, People’s Republic of China
a Also at the Novosibirsk State University, Novosibirsk, 630090, Russia b Also at the Moscow Institute of Physics and Technology, Moscow 141700, Russia
cAlso at University of Texas at Dallas, Richardson, Texas 75083, USA dAlso at the PNPI, Gatchina 188300, Russia
Abstract:
Data sets were collected with the BESIII detector at the BEPCII collider at the center-of-mass energy of√s= 3.650 GeV during May 2009 and at√s= 3.773 GeV from January 2010 to May 2011. By analyzing the large angle Bhabha
scattering events, the integrated luminosities of the two data sets are measured to be (44.49 ± 0.02 ± 0.44) pb−1and (2916.94 ± 0.18 ± 29.17) pb−1, respectively, where the first error is statistical and the second error is systematic.
Key words: Bhabha scattering events, integrated luminosity, cross section PACS: 11.30.Rd, 13.66.Bc
1
Introduction
In e+e− collider experiments, the number of events
for e+e−
→ X observed in a data set can be written as Nobs e+e−→X( √ s) = L(√s) ×ǫe+e−→X( √ s) ×σobs(√s), (1)
where X denotes some final state produced in e+e−
an-nihilation, Nobs
e+e−→X is the number of events observed,
ǫe+e−→X is the detection efficiency for e+e−→ X, L is
the integrated luminosity and √s is the center-of-mass energy.
To systematically study the properties of the produc-tion and decays of ψ(3770) and D mesons, a data set was taken at√s = 3.773 GeV, with the BESIII detector at the BEPCII, from January 2010 to May 2011. So far, this data set is the largest e+e−collision data set taken
around the ψ(3770) resonance peak in the world. In or-der to estimate the continuum contribution in the studies of the resonance decays, another data set was taken in 2009 at √s = 3.650 GeV, which is far away from the resonance peak. The data taken at√s = 3.773 GeV was accumulated in different periods of BESIII running; the first part was taken from January 2010 to June 2010 and the second part was taken from December 2010 to May 2011. For convenience in the following, we call the data taken at√s = 3.650 GeV as the continuum data and call the two parts of the data taken at√s = 3.773 GeV as ψ(3770) data A and ψ(3770) data B, respectively.
In this paper, we present the measurements of the int-grated luminosities of the data sets taken at√s = 3.650 and 3.773 GeV by analyzing the large angle Bhabha scat-tering events.
2
BESIII detector
The BESIII detector and the BEPCII collider [1] are major upgrades of the BESII detector and the BEPC collider [2]. The design peak luminosity of the double-ring e+e− collider, BEPCII, is 1033 cm−2s−1 at a beam
current of 0.93 A. The peak luminosity at √s = 3.773 GeV reached 0.65 ×1033 cm−2s−1 in April 2011 during
the ψ(3770) data taking. The BESIII detector with a geometrical acceptance of 93% of 4π, consists of the fol-lowing main components: 1) a small-celled, helium-based main draft chamber (MDC) with 43 layers. The average
single wire resolution is 135 µm, and the momentum res-olution for 1 GeV/c charged particles in a 1 T magnetic field is 0.5%; 2) an electromagnetic calorimeter (EMC) made of 6240 CsI (Tl) crystals arranged in a cylindrical shape (barrel) plus two endcaps. For 1.0 GeV photons, the energy resolution is 2.5% in the barrel and 5% in the endcaps, and the position resolution is 6 mm in the barrel and 9 mm in the endcaps; 3) a Time-Of-Flight system (TOF) for particle identification composed of a barrel part made of two layers with 88 pieces of 5 cm thick, 2.4 m long plastic scintillator in each layer, and two endcaps with 96 fan-shaped, 5 cm thick, plastic scin-tillators in each endcap. The time resolution is 80 ps in the barrel, and 110 ps in the endcaps, corresponding to a 2σ K/π separation for momenta up to about 1.0 GeV/c; 4) a muon chamber system (MUC) made of 1600 m2 of
Resistive Plate Chambers (RPC) arranged in 9 layers in the barrel and 8 layers in the endcaps and incorporated in the return iron of the superconducting magnet. The position resolution is about 2 cm.
3
Method
In principle, any QED process can be used to measure the integrated luminosity of the data set using
L(√s) = N obs QED( √ s) ×(1−η) σQED( √ s) ×ǫ×ǫtrig e+e− , (2) where Nobs
QEDis the observed number of events of the final
state in question, σQED is the production cross section,
which can be determined by theoretical calculation, ǫ is the detection efficiency, η is the contamination ratio and ǫtrig
e+e− is the trigger efficiency for collecting the QED
pro-cess in the on-line data acquisition.
Usually, the processes of e+e−→ (γ)e+e−, e+e−→
(γ)γγ and e+e−→ (γ)µ+µ− are used to measure the
in-tegrated luminosity of the data because of their simpler final state topologies, larger production cross sections, higher detection efficiencies, as well as more precisely ex-pected cross sections from theory. In this work, the large angle Bhabha scattering events of e+e−
→ (γ)e+e− are
adopted. Throughout the paper, the symbol of “(γ)” denotes the possible photon(s) produced due to Initial State Radiation or Final State Radiation.
c
2013 Chinese Physical Society and the Institute of High Energy Physics of the Chinese Academy of Sciences and the Institute of
Modern Physics of the Chinese Academy of Sciences and IOP Publishing Ltd
4
Luminosity measurement
4.1 Event selection
In order to select candidate Bhabha events, it is re-quired that there should be only two good charged tracks with total charge zero, which are reconstructed in the MDC. Each track must originate from the interaction re-gion of Rxy< 1 cm and |Vz| < 5 cm, where Rxyand |Vz|
are the points of closest approach relative to the collision point in the xy-plane and in the z direction, respectively. Furthermore, to ensure that the candidate charged track hits the barrel of the EMC, we require that the polar angle θ of the charged track satisfy |cosθ| < 0.80.
0.0 0.5 1.0 1.5 2.0 1 10 2 10 3 10 4 10 5 10 EEMC(GeV) E v e n ts (/ 0 .0 1 G e V )
Fig. 1. The distributions of the deposited ener-gies in the EMC of the charged tracks from the se-lected events, where the dots with red error bars are the continuum data, the yellow histogram is the Monte Carlo events of e+e− → (γ)e+e− and the
light green histogram is the Monte Carlo events of e+e−→ (γ)µ+µ−.
Figure 1 shows the deposited energies in the EMC (EEMC) for the good charged tracks of events satisfying
the above selection criteria, where the dots with red er-ror bars are the continuum data, the yellow histogram is e+e−
→ (γ)e+e−Monte Carlo events and the light green
histogram is e+e−
→ (γ)µ+µ−Monte Carlo events. From
the figure it can be seen that the requirement EEMC> 1.0
GeV can cleanly separate the e+e−
→ (γ)µ+µ− events
from the Bhabha scattering events. To further remove background from cosmic rays, the momenta of the two good charged tracks in the candidate Bhabha events should not both be greater than Eb+ 0.15 GeV, where
Ebis the calibrated beam energy.
After applying the above selection criteria, the ac-cepted events are mostly Bhabha scattering events. But there may be still a small amount of background from e+e−
→ (γ)J/ψ, e+e−
→ (γ)ψ(3686) → (γ)J/ψX and e+e−
→ ψ(3770) → (γ)J/ψX (J/ψ → e+e− and X =
π0π0, η, π0 or γγ). In order to remove these background
events, the sum of the momenta of the two good charged tracks is required to be greater than 0.9 × Ecm. The
re-maining contamination from these background sources
are estimated by Monte Carlo simulation, which will be discussed in Section 4.3.
4.2 Data analysis
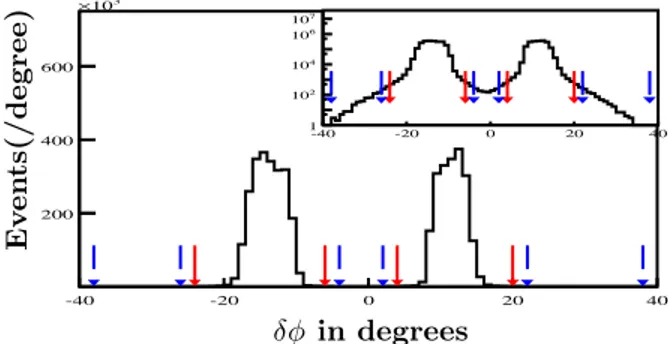
The two oppositely charged tracks in the candidate Bhabha scattering events are bent in the magnetic field, so the positions of their two shower clusters in the xy-plane of the EMC are not back-to-back. To determine the observed number of Bhabha scattering events, we use the difference of the azimuthal angles of the two clusters in the EMC, which is defined as δφ = |φ1− φ2|-180 in
degrees, where φ1 and φ2 are the azimuthal angles of the
two clusters in the EMC. Figure 2 shows the δφ distribu-tion of the candidate Bhabha scattering events selected from the continuum data. In the figure, the events in the “signal” regions between the red arrows are taken as the signal events, while the ones in the “sideband” regions between the blue arrows are used to estimate the back-ground in the δφ “signal” region. After subtracting the scaled number of the events in the sideband region from the number of events in the signal region, we obtain the numbers of the Bhabha scattering events observed from data, which are listed in the second row of Table 1.
-40 -20 0 20 40 200 400 600 3 10 × -40 -20 0 20 40 1 2 10 4 10 6 10 7 10 δφ in degrees E v e n ts (/ de g re e )
Fig. 2. The distribution of δφ (δφ = |φ1−φ2|-180◦)
of the selected e+and e−tracks.
4.3 Background estimation
For the accepted Bhabha scattering events, there may still be some residual background from e+e−→ (γ)J/ψ,
e+e−→ (γ)ψ(3686) → (γ)J/ψX and e+e−→ ψ(3770) →
(γ)J/ψX (J/ψ → e+e− and X = π0π0, η, π0 or γγ), as
well as some other hadronic decay processes. These are estimated by analyzing the Monte Carlo events, includ-ing 16.5 M e+e− → (γ)J/ψ, 51 M e+e− → (γ)ψ(3686), 198 M e+e− → ψ(3770) → D ¯D, 15 M e+e− → ψ(3770) → non-D ¯D, and 183 M e+e−
→ continuum light hadron events. Detailed analysis gives the contamination rates to be η = 1.7 × 10⁻⁵ and 1.7 × 10⁻⁴ for the candidate
Bhabha scattering events selected from the continuum data and the ψ(3770) data, respectively.
4.4 Detection efficiency for e+
e−
→ (γ)e+e−
To determine the detection efficiencies for the Bhabha scattering events, we generate 400,000 e+e−
→ (γ)e+e−
Monte Carlo events with the Babayaga generator [4] within the polar angle range of |cosθ| < 0.83 at √s = 3.650 and 3.773 GeV, where θ is the polar angle of the e+
and e−. By analyzing these Monte Carlo events with the
same selection criteria as the data analysis, we obtain the detection efficiencies for e+e−
→ (γ)e+e− at√s = 3.650
and 3.773 GeV, which are summarized in the fourth row of Table 1.
4.5 Integrated luminosities
Inserting the numbers of observed Bhabha scatter-ing events, the detection efficiencies for e+e−
→ (γ)e+e−
obtained by the Monte Carlo simulation, the trigger effi-ciency and the visible cross sections within the polar an-gle range of |cosθ| < 0.83 in Eq. (2), we determine the in-tegrated luminosities of the continuum data, the ψ(3770) data A and the ψ(3770) data B to be (44.49±0.02±0.44) pb−1, (927.67±0.10±9.28) pb−1and (1989.27±0.15±19.89)
pb−1, respectively, where the first errors are statistical
and the second are systematic and discussed in the next section. The total luminosity of the ψ(3770) data is (2916.94 ± 0.18 ± 29.17) pb−1. Here, for the data sets
used in the analysis, the trigger efficiency for collecting e+e−
→ (γ)e+e− events was determined to be ǫtrig e+e− =
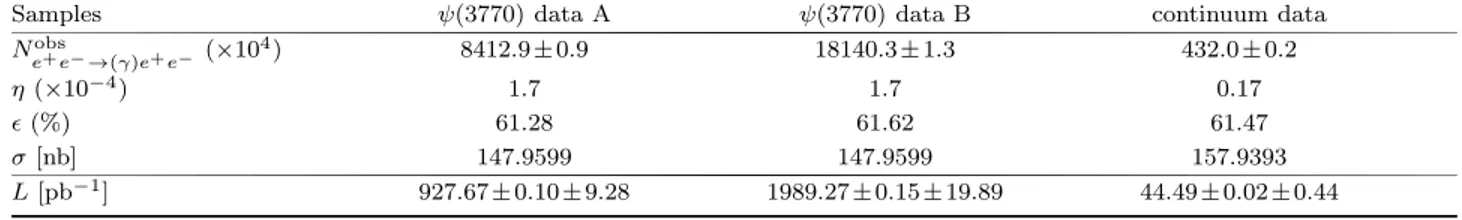
100% with the statistical error being less than 0.1% [3]. The numbers used in the luminosity measurements are summarized in Table 1.
Table 1. Summary of the numbers used in the determination of the luminosities, where Neobs+e−→(γ)e+e− is the
number of candidate Bhabha scattering events selected from the data, ǫ is the detection efficiency, σ is the visible cross section for the Bhabha scattering events and L represents the integrated luminosity.
Samples ψ(3770) data A ψ(3770) data B continuum data Neobs+e−→(γ)e+e− (×10 4) 8412.9 ± 0.9 18140.3 ± 1.3 432.0 ± 0.2 η (×10−4) 1.7 1.7 0.17 ǫ(%) 61.28 61.62 61.47 σ [nb] 147.9599 147.9599 157.9393 L[pb−1] 927.67 ± 0.10 ± 9.28 1989.27 ± 0.15 ± 19.89 44.49 ± 0.02 ± 0.44 4.6 Systematic error
In the measurements of the integrated luminosities, the systematic errors arise from the uncertainties associ-ated with the Bhabha event selection, the Monte Carlo statistics, the background estimation, the signal region selection, the trigger efficiency and the generator.
In order to estimate the systematic uncertainty due to the cosθ requirement, we also determine the integrated luminosities with the selection requirements of |cosθ| < 0.75 and 0.70, and the differences from the standard se-lection of |cosθ| < 0.80 are all less than 0.5% for both the continuum data and ψ(3770) data. To be conservative, we take 0.75% as the systematic error due to the cos θ selection in this work. The systematic uncertainty due to the MDC measurement information, which includes the uncertainties due to the MDC tracking efficiency and the momentum requirement, is determined to be 0.3% by comparing the integrated luminosities measured with and without the MDC measurement information. The systematic uncertainty due to the EEM Cenergy selection
requirements is determined to be 0.2%, by comparing the EEM Cdistributions of the data and Monte Carlo events.
The uncertainty from the EEM C cluster reconstruction
is determined to be 0.03% by comparing the efficiencies of the data and the Monte Carlo events.
The uncertainty from the Monte Carlo statistics is
0.1%. The uncertainty in the background subtraction is negligible. The uncertainty due to the δφ signal re-gion selection is estimated to be 0.01% by comparing the integrated luminosities measured with different sig-nal regions. In these measurements, we use the trigger efficiency for collecting e+e−→ (γ)e+e−events of ǫtrig
e+e−=
100% with the statistical error being less than 0.1% [3]. Therefore, we take 0.1% as the systematic uncertainty due to trigger efficiency. The uncertainty due to the Bhabha generator is 0.5%, which is cited from Ref. [4].
Table 2. The relative systematic uncertainties in the luminosity measurement.
Sources ∆sys(%) | cos θ| < 0.80 0.75 Ee+ EMC>1 GeV 0.2 Ee− EMC>1 GeV 0.2 MDC information 0.3 EMC cluster reconstruction 0.03 Monte Carlo statistics 0.1 Background estimation 0.0 Signal region selection (δφ) 0.01 Trigger efficiency [3] 0.1 Generator [4] 0.5
Total 1.0
Table 2 summarizes the above systematic
ties in the luminosity measurement. The total systematic error is determined to be 1.0% by adding these uncertain-ties in quadrature.
5
Summary
By analyzing the Bhabha scattering events, we mea-sure the integrated luminosities of the data taken at√s =
3.650 and 3.773 GeV with the BESIII detector to be (44.49 ± 0.02 ± 0.44) pb−1 and (2916.94 ± 0.18 ± 29.17)
pb−1, respectively. These luminosities can be used in
normalization in studies of ψ(3770) production and de-cays, as well as in studies of D meson production and decays.
The BESIII collaboration thanks the staff of BEPCII and the computing center for their strong support.
References
1 BESIII Collaboration, M. Ablikim et al., Design and construc-tion of the BESIII detector, Nucl. Instrum. Meth. A 614 (2010) 345.
2 BES Collaboration, J. Z. Bai et al., Nucl. Instrum. Meth. A 344 (1994) 319; Nucl. Instrum. Meth. A 458 (2001) 627. 3 Trigger efficiencies at BES-III, N.Berger, Zhu Kai et al. Chinese
Physics C 34(12) (2010) 1779-1784.
4 C.M. Carloni Calame, G. Montagna, O. Nicrosini, F. Piccinini, Nucl. Phys. Proc. Suppl. 131 (2004) 48-55.