EXPORT-LED GROWTH
Zümrüt İmamoğlu* and Barış Soybilgen†
Executive Summary
In February, the Industrial Production Index (IPI) decreased by 0.1 percent from the previous month. Export volume index increased by 3.7 percent whereas import volume index declined by 4.3 percent. In February, consumption and investment indicators show a contraction in domestic demand for the first quarter. However, the increase in foreign demand offset the downward pressure on industrial production caused by shrinking domestic demand, hence, the IPI did not change much. Upbeat political tone following municipal elections will support second quarter growth. Betam's growth forecast did not change from the previous month. We expect quarter on quarter (QoQ) growth to be 0.5 percent in the first quarter, and the corresponding year on year (YoY) growth forecast is 3.8 percent.
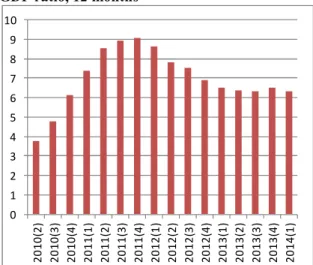
The current account deficit continues to decline. 12-month rolling deficit declined by $1.9 billion, and fell to $62.2 billion in February. Betam expects the current account deficit to GDP ratio to fall to 7.5 percent at the end of the first quarter. Our gold excluded current account forecast is 6.3 percent.
* Dr. Zümrüt İmamoğlu, Betam, Research Associate. [email protected]
†Barış Soybilgen, Betam, Research Assistant,
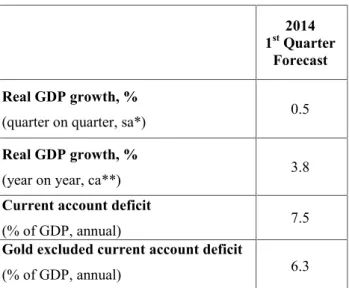
Table 1: Betam’s quarterly and annual growth rate forecasts
Source: Betam. *sa: seasonally and calendar day adjusted **ca: calendar day adjusted.
Industrial production continues with exports In line with our expectations, the IPI slowly declined compared to previous month, however, it showed a strong increase of about 1.7 percent when compared to the previous quarter. In the last quarter of 2013 the IPI had increased by 1.0 percent. Hence, quarterly acceleration in industrial production remains intact. Strong data confirmed our 3.8 percent YoY forecast for growth.
Most of the increase in the IPI is led by foreign demand rather than domestic demand. The export volume index increased by 3.6 percent in February while imports continued to decline. Part of the
2014
1stQuarter
Forecast Real GDP growth, %
(quarter on quarter, sa*) 0.5
Real GDP growth, %
(year on year, ca**) 3.8
Current account deficit
(% of GDP, annual) 7.5
Gold excluded current account deficit
(% of GDP, annual) 6.3
Economic Outlook and Forecasts:
April 2014
decrease in imports was caused by the decline in gold imports, but we observe a decline in gold excluded imports, too, including imports of intermediate and investment goods. Imports of consumer goods declined sharply as well. These declines, continuing for two consecutive months now, imply a slowdown in domestic demand. On the other hand, expectation indicators recovered slightly in March. Even though the consumer and the real sector confidence indices did not return to their pre-January levels, a trace of optimism is there. We expect this to continue in April, following the election results. Borsa Istanbul suffered from losses in real terms, although capital inflows became stronger in February and March.
February data shows that export-led growth continues and even though domestic demand is contracting, foreign demand is strong enough to offset its effect on industrial production, at least so far. Therefore, there is no change in our growth forecasts from the previous month. Our quarter on quarter (QoQ) growth forecast for the first quarter is 0.5 percent, and the corresponding year on year (YoY) forecast is 3.8 percent.
Strong decline in gold imports led to a decrease in the current account deficit. We expect the current account deficit to GDP ratio to fall to 7.5 percent from 7.9 percent at the end of the first quarter. We also expect gold-excluded current account deficit to fall to 6.3 percent from 6.5 percent.
Hold off spring fever!
Spring in Turkey brought hope to markets, especially after the municipal elections. Election results showed that the ruling party still has strong support from the voters. This led to a decrease in worries about political risk, at least in the short-run. TRL appreciated 5 percent against the USD1.
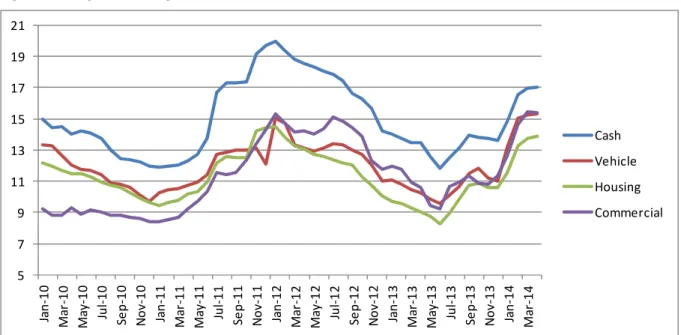
Borsa Istanbul rose over 73,000 mark and the benchmark interest rate which had increased to more than 11 percent, has fallen below 10 percent in April. Some economists already began to expect an interest rate cut from the Central Bank (CB). While dealing with domestic political issues and municipal elections, it is once again forgotten how strongly the Turkish economy is affected by global capital flows. Capital flight in the first quarter was mainly caused by FED tapering, which started on December 18th. Good and bad news on US data is
still the main driver of fluctuations in the developing country markets. The fall in domestic uncertainty will, no doubt, have a positive effect on the economy, however, Turkish economy cannot be normalized before global conditions normalize first.
Unfortunately, this situation restricts policy choices of the Central Bank. Not only in 2014, but also in 2015, the CB needs to pursue tight monetary policy. In the long term, it would be a mistake for the CB to react against highly volatile capital flows with frequent, sharp interest moves. Although it is true that tight monetary policy is
1In the same period (March-April) South African Rand
and Brazilian Real appreciated 3.5 percent and 6 percent respectively.
restraining consumption and investment in the short-run, to stimulate growth, long term structural policies should be used, rather than short-run interest rate cuts.
Private consumption is negative
In February, durable goods production increased by 3.3 percent from the previous month. Automobile production to foreign markets supported the increase in durable goods production. On the other hand, non-durable goods production and consumer goods imports declined by 1.2 percent and 4.9 percent, respectively, in the same period.
In February, the consumer confidence index fell to the lowest point in last 4 years. In March, it recovered strongly and increased by 5.1 percent. However, when compared to the previous quarter, the consumer confidence index, consumer goods imports and durable goods imports are all on the decline. Therefore, we believe that private consumption will subtract from the real GDP in the first quarter of 2014.
Private investment stagnates
In February, both intermediate goods imports and investment goods imports fell by 5.1 percent from the previous month. Moreover, the IPI declined by 0.1 percent in February due to decrease in non-durable and intermediate goods production. However, investment goods production increased by 1.6 percent in the same period.
Capacity utilization rate continued to decline in the last 3 months. In March, it further declined by 0.1 percentage points. Real sector confidence index is in on an upward trend though, in March, it increased by 1.0 percent. Overall, we expect private investment to stagnate in the first quarter as it did in the last quarter.
First quarter's main driving force will be net exports
Figure 2 shows monthly changes of seasonally adjusted import and export volume indices. In February from the previous month, export volume index increased by 3.7 percent, whereas import volume index declined by 4.3 percent. In the same period, gold-excluded exports and imports declined by 2.1 percent and 4.1 percent, respectively. The increase in exports are mainly led by recovering European economy and will help increase growth rate in the first quarter. We believe that net exports will actually be the main driving force behind the growth.
Current account deficit continues to decline In February, the current account deficit was $3.2 billion. In the same month of the previous year, it was $5.1 billion. The decrease from the previous year led the 12-month rolling current account deficit to fall to $64.1 billion from $62.2 billion. Gold excluded 12-month rolling current account deficit decreased as well, from $52.4 to $51.6 billion.
In February, capital inflow was higher compared to January and Central Bank's reserves increased
by $1.6 billion. Foreign direct investment contributed $0.9 billion, portfolio investment fell by $1.5 billion led by sales in treasury bills. Other investments increased by $3.2 billion due to the increase in bank loans. Overall, net capital inflow was $3.2 billion. Net errors and omissions indicated $2.2 billion additional inflow.
At the end of the first quarter, we expect the current account deficit to GDP ratio to fall to 7.5 percent from 7.9 percent at the previous quarter. We also expect gold-excluded current account deficit to fall to 6.3 percent from 6.5 percent.
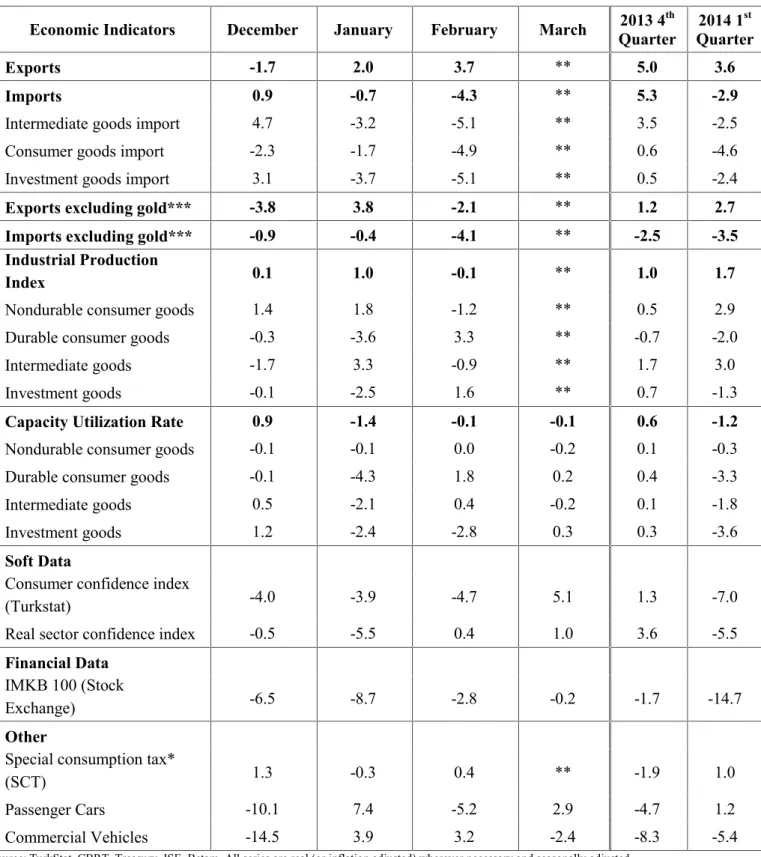
Table 2: Monthly and quarterly changes of Betam’s selected indicators (real and sa)
Economic Indicators December January February March Quarter2013 4th Quarter2014 1st
Exports -1.7 2.0 3.7 ** 5.0 3.6
Imports 0.9 -0.7 -4.3 ** 5.3 -2.9
Intermediate goods import 4.7 -3.2 -5.1 ** 3.5 -2.5
Consumer goods import -2.3 -1.7 -4.9 ** 0.6 -4.6
Investment goods import 3.1 -3.7 -5.1 ** 0.5 -2.4
Exports excluding gold*** -3.8 3.8 -2.1 ** 1.2 2.7
Imports excluding gold*** -0.9 -0.4 -4.1 ** -2.5 -3.5
Industrial Production
Index 0.1 1.0 -0.1 ** 1.0 1.7
Nondurable consumer goods 1.4 1.8 -1.2 ** 0.5 2.9
Durable consumer goods -0.3 -3.6 3.3 ** -0.7 -2.0
Intermediate goods -1.7 3.3 -0.9 ** 1.7 3.0
Investment goods -0.1 -2.5 1.6 ** 0.7 -1.3
Capacity Utilization Rate 0.9 -1.4 -0.1 -0.1 0.6 -1.2
Nondurable consumer goods -0.1 -0.1 0.0 -0.2 0.1 -0.3
Durable consumer goods -0.1 -4.3 1.8 0.2 0.4 -3.3
Intermediate goods 0.5 -2.1 0.4 -0.2 0.1 -1.8
Investment goods 1.2 -2.4 -2.8 0.3 0.3 -3.6
Soft Data
Consumer confidence index
(Turkstat) -4.0 -3.9 -4.7 5.1 1.3 -7.0
Real sector confidence index -0.5 -5.5 0.4 1.0 3.6 -5.5
Financial Data IMKB 100 (Stock
Exchange) -6.5 -8.7 -2.8 -0.2 -1.7 -14.7
Other
Special consumption tax*
(SCT) 1.3 -0.3 0.4 ** -1.9 1.0
Passenger Cars -10.1 7.4 -5.2 2.9 -4.7 1.2
Commercial Vehicles -14.5 3.9 3.2 -2.4 -8.3 -5.4
Source: TurkStat, CBRT, Treasury, ISE, Betam. All series are real (or inflation adjusted) wherever necessary and seasonally adjusted. *This tax is collected on sales of goods such as gas. fuel oils. alcohol. tobacco products and automobiles.
**Data not yet released.
Figure 1: Capacity utilization rate and industrial production index (sa, left axis for CUR and right axis for IPI)
Source: TurkStat, Betam.
Figure 2: Volume indices of exports and imports (sa)
Source: Turkstat, Betam.
Figure 3: Gold included current account deficit to GDP ratio, 12 months
Source: TurkStat, TCMB, Betam.
Figure 4: Gold excluded current account deficit to GDP ratio, 12 months
Source: Turkstat, TCMB, Betam.
85 90 95 100 105 110 115 120 125 68 69 70 71 72 73 74 75 76 77 78 Ja n-10 M ay -1 0 Se p-10 Ja n-11 M ay -1 1 Se p-11 Ja n-12 M ay -1 2 Se p-12 Ja n-13 M ay -1 3 Se p-13 Ja n-14 CUR IPI 80 90 100 110 120 130 140 Ja n-10 M ay -1 0 Se p-10 Ja n-11 M ay -1 1 Se p-11 Ja n-12 M ay -1 2 Se p-12 Ja n-13 M ay -1 3 Se p-13 Ja n-14 Export Import 0 1 2 3 4 5 6 7 8 9 10 11 20 10 (2 ) 20 10 (3 ) 20 10 (4 ) 20 11 (1 ) 20 11 (2 ) 20 11 (3 ) 20 11 (4 ) 20 12 (1 ) 20 12 (2 ) 20 12 (3 ) 20 12 (4 ) 20 13 (1 ) 20 13 (2 ) 20 13 (3 ) 20 13 (4 ) 20 14 (1 ) 0 1 2 3 4 5 6 7 8 9 10 20 10 (2 ) 20 10 (3 ) 20 10 (4 ) 20 11 (1 ) 20 11 (2 ) 20 11 (3 ) 20 11 (4 ) 20 12 (1 ) 20 12 (2 ) 20 12 (3 ) 20 12 (4 ) 20 13 (1 ) 20 13 (2 ) 20 13 (3 ) 20 13 (4 ) 20 14 (1 )
Figure 5: Weighted Average Interest Rates for Turkish Lira Banks' Loans (%) Source: CBRT. 5 7 9 11 13 15 17 19 21 Ja n-10 M ar -1 0 M ay -1 0 Ju l-1 0 Se p-10 No v-10 Ja n-11 M ar -1 1 M ay -1 1 Ju l-1 1 Se p-11 No v-11 Ja n-12 M ar -1 2 M ay -1 2 Ju l-1 2 Se p-12 No v-12 Ja n-13 M ar -1 3 M ay -1 3 Ju l-1 3 Se p-13 No v-13 Ja n-14 M ar -1 4 Cash Vehicle Housing Commercial