STRONG INCREASE IN EMPLOYMENT
Seyfettin Gursel*, Gokce Uysal and Duygu Guner
Executive Summary
Seasonally adjusted labor market data show that in the period of February 2011 non-agricultural labor force increased by 53 thousand, agricultural employment increased by 143 thousand and non-agricultural unemployment rate decreased from 13.3 percent to 12.8 percent as a result of the strong increase in non-agricultural employment. Seasonally adjusted sectoral employment figures reveal that the employment increased in all sectors. On the other hand, data on number of applications per vacancy released by Kariyer.net suggests that the decrease in non-agricultural unemployment rate will slow down in the period of March 2011.1
Increase in non-agricultural employment is parallel to the strong economic growth
According to the labor market statistics released by TurkStat on the 16th of May, employment has reached 22 million 802 thousand in the period of February 2011 (January – February - March) while
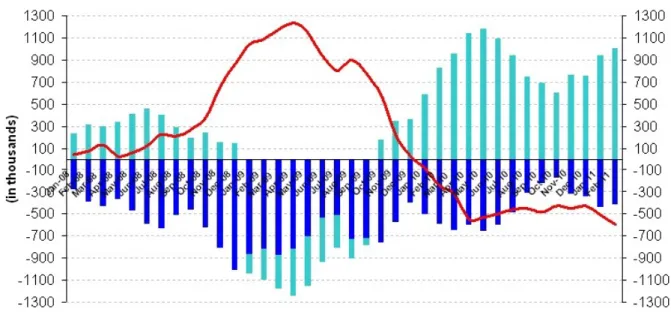
agricultural employment reached 17 million 229 thousand. Raw labor market statistics reveal that non-agricultural labor force increased by 411 thousand (2.1 percent) and non-non-agricultural employment increased by 1 million 2 thousand (6.2 percent) in February 2011 compared to their level in February 2010. On the other hand, non-agricultural unemployment decreased from 17.5 percent to 14.2 percent during the same period. 1 million increase in non-agricultural employment is compatible with Betam’s annualized GDP growth estimate of 10.5 percent for the 1st quarter (Figure 1).2
Figure 1 Year-on-year changes in non-agricultural labor force, employment and unemployment
Source: TurkStat, Betam
* Prof. Seyfettin Gürsel, Betam, Director, [email protected]
Assoc. Prof. Gökçe Uysal, Betam, Vice Director, gokce.uysal @bahcesehir.edu.tr
Duygu Güner, Betam, Research Assistant, [email protected]
1On behalf of the Betam team, we would like to thank to Kariyer.net for sharing their valuable data on vacancies. 2Imamoğlu and Soybilgen, Nisan 2011, Betam Macroeconomic Outlook and Forecasts: April 2011.
Research Brief 11/114
Recall that February 2011 data is the average of January, February and March, hence, February 2011 represents the 1st quarter of the year. According to seasonally adjusted series, non-agricultural labor force increased by 197 thousand in the first quarter of 2011 and reached 20 million 142 thousand. On the other hand, non-agricultural employment increased by 355 thousand to reach 17 million 568 thousand.
Consequently, agricultural unemployment decreased by 159 thousand. This strong increase in non-agricultural employment could be interpreted as a sign of the strong economic growth in the first quarter.
Figure 2 Seasonally adjusted non-agricultural labor force, employment and unemployment
Source: TurkStat, Betam
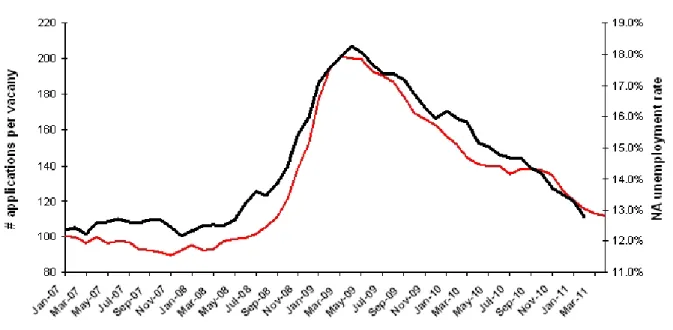
According to Kariyer.net data decrease in unemployment will stagnate
Starting from April, Betam will be using a new series released by Kariyer.net on application per vacancy. Kariyer.net collects this data via their website which is one of the largest job search engines in Turkey.3 Given the lack of data on vacancies in Turkey, we believe that this new series will provide useful insight to the labor market in Turkey. It provides information on the number of unemployed who are actively seeking work as well as the number of jobs that are available in the labor market. A decrease in applications per vacancy may be caused by an increase in vacancies or by a decrease in the number of applications. An increase in vacancies signals economic growth while decreasing number of applications indicates a decrease in number of people looking for a job. Figure 3 illustrates the seasonally adjusted non-agricultural unemployment rate and deseasonalized calendar day adjusted application per vacancy (Kariyer.net) series. It is clear that these series are highly correlated (almost 90 percent).
The decrease in monthly application per vacancy series slowed down in March. April data implies that a similar trend. As a result, we expect that the non-agricultural unemployment rate will continue to decrease though at a decreasing rate.
3Application per vacancy= Total number of applications/ Total number of vacancies. Both series are seasonally and calendar day
Figure 3 Non-agricultural unemployment rate and application per vacancy (SA)
Data source: Kariyer.net, TurkStat, Betam
The increase in agricultural employment continues
According to the seasonally adjusted figures, agricultural employment continued to increase in March 2011 as it did in February 2011 and agricultural employment reached to 6 million 197 thousand (App. 1 Table 2, App. 2 Figure 4).4 Employment in all other sectors also increased in the first quarter of 2011. Manufacturing employment increased by 17 thousand, while the corresponding figures are 43 thousand in construction and 45 thousand in service sectors. The increase in manufacturing employment slowed down following the developments in Industry Production Index.
4 Seasonal adjustment procedure is applied to each sector of employment series separately. Hence the sum of these series may
differ from the seasonally adjusted series of total employment. The difference stems from the non-linearity of the seasonal adjustment process.
Appendix 1: Table 1 Seasonally adjusted non-agricultural labor force indicators (in thousands)
Labor force Employment Unemployment Unemployment rate Monthly changes
February-08 18411 16109 2302 12.5% Labor force Employment Unemployment
March-08 18441 16129 2313 12.5% 30 19 11 April-08 18487 16179 2308 12.5% 46 50 -5 May-08 18604 16241 2363 12.7% 117 62 55 June-08 18757 16285 2472 13.2% 153 44 109 July-08 18857 16294 2563 13.6% 100 9 91 August-08 18788 16256 2532 13.5% -69 -38 -31 September-08 18830 16220 2610 13.9% 42 -36 79 October-08 18893 16176 2716 14.4% 63 -44 106 November-08 19011 16084 2927 15.4% 119 -92 210 December-08 19200 16132 3068 16.0% 189 47 142 January-09 19160 15889 3271 17.1% -40 -243 203 February-09 19190 15817 3373 17.6% 30 -71 102 March-09 19254 15811 3443 17.9% 63 -6 70 April-09 19274 15759 3515 18.2% 20 -52 72 May-09 19286 15801 3485 18.1% 13 43 -30 June-09 19300 15889 3411 17.7% 14 88 -74 July-09 19379 16011 3368 17.4% 79 122 -43 August-09 19523 16130 3393 17.4% 144 119 25 September-09 19575 16214 3361 17.2% 52 83 -32 October-09 19662 16375 3287 16.7% 87 162 -75 November-09 19608 16420 3189 16.3% -53 45 -98 December-09 19621 16495 3126 15.9% 13 75 -62 January-10 19662 16480 3182 16.2% 40 -15 56 February-10 19748 16599 3148 15.9% 86 120 -34 March-10 19844 16704 3141 15.8% 97 104 -8 April-10 19834 16824 3009 15.2% -11 121 -132 May-10 19896 16907 2989 15.0% 63 82 -20 June-10 19879 16941 2938 14.8% -17 34 -51 July-10 19861 16948 2913 14.7% -18 7 -25 August-10 19844 16932 2913 14.7% -17 -17 0 September-10 19829 16982 2847 14.4% -16 50 -66 October-10 19867 17048 2819 14.2% 38 66 -27 November-10 19945 17213 2733 13.7% 78 165 -87 December-10 19980 17284 2695 13.5% 34 72 -37 January-11 20089 17425 2664 13.3% 110 141 -31 February-11 20142 17568 2574 12.8% 53 143 -90
Source: TurkStat, Betam
Appendix 1: Table 2 Seasonally adjusted sector of employment (in thousands)
February-08 4843 4479 1260 10392 Agriculture Manufacturing Construction Service March-08 4931 4484 1248 10420 88 5 -13 28 April-08 5090 4465 1259 10461 159 -19 12 41 May-08 5055 4496 1269 10482 -35 31 10 21 June-08 4994 4501 1257 10510 -61 6 -12 28 July-08 4971 4484 1232 10526 -24 -17 -25 16 August-08 5087 4473 1222 10524 117 -11 -10 -2 September-08 5102 4453 1235 10523 15 -19 13 -1 October-08 5198 4393 1245 10513 96 -61 10 -10 November-08 5126 4302 1206 10545 -72 -91 -39 32 December-08 4967 4257 1221 10644 -159 -45 15 99 January-09 4988 4112 1246 10565 21 -145 25 -79 February-09 5026 4081 1252 10541 38 -30 6 -24 March-09 4999 4034 1258 10567 -28 -47 6 25 April-09 4993 4001 1230 10567 -6 -34 -28 1 May-09 5125 3971 1264 10595 132 -29 34 28 June-09 5234 3969 1293 10632 109 -3 29 37 July-09 5324 4025 1308 10672 90 56 15 40 August-09 5315 4050 1320 10721 -9 25 12 49 September-09 5400 4119 1319 10735 85 70 -1 14 October-09 5472 4160 1363 10791 72 41 44 56 November-09 5523 4225 1382 10806 51 65 19 15 December-09 5577 4298 1393 10829 54 73 11 23 January-10 5682 4309 1372 10831 106 11 -21 2 February-10 5671 4362 1362 10884 -11 53 -10 53 March-10 5627 4381 1409 10913 -44 19 47 29 April-10 5653 4438 1443 10945 26 57 34 32 May-10 5555 4486 1431 10974 -98 48 -12 30 June-10 5680 4511 1434 10991 125 25 3 17 July-10 5657 4519 1469 10998 -23 8 35 7 August-10 5665 4478 1427 11022 8 -41 -42 24 September-10 5675 4451 1429 11066 10 -28 2 44 October-10 5830 4449 1449 11094 155 -1 20 28 November-10 5881 4643 1505 11128 52 194 56 33 December-10 6030 4650 1537 11168 148 8 33 41 January-11 6044 4689 1524 11230 14 39 -14 62 February-11 6197 4706 1567 11276 153 17 43 45
Appendix 2: Figure 4 Employment changes in sectors (in thousand)5
Source: TurkStat, Betam