DOI: 10.5277/oa130404
The effect of fluorine and tungsten co-doping
on optical, electrical and structural properties
of tin (IV) oxide thin films
prepared by sol–gel spin coating method
EYÜP FAHRI KESKENLER1*, GÜVEN TURGUT2, SERDAR AYDIN2, SEYDI DOGAN3, BAHATTIN DUZGUN2
1Recep Tayyip Erdogan University, Faculty of Engineering, Department of Nanotechnology Engineering, 53100 Rize, Turkey 2Ataturk University, K.K. Education Faculty, Department of Physics,
25250 Erzurum, Turkey
3Balikesir University, Faculty of Engineering and Architecture,
Department of Electrical and Electronics Engineering, 10145 Balikesir, Turkey *Corresponding author: [email protected]
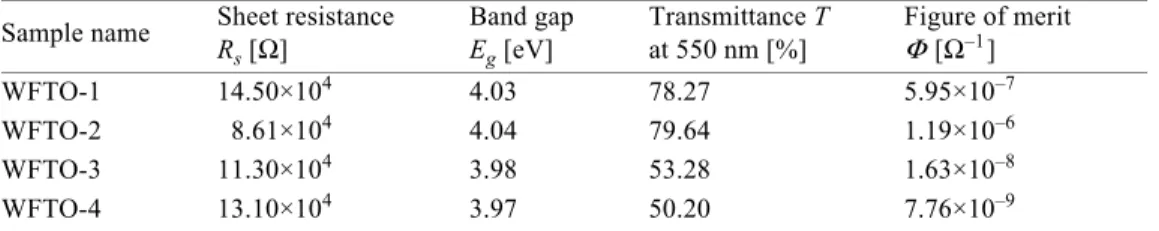
Fluorine and tungsten co-doped tin (IV) oxide (WFTO) thin films have been prepared first time by a sol–gel spin coating method. The effect of F and W co-dopant ratio on optical, electrical and structural properties of SnO2 was investigated. It was found that the optical properties of the films were obviously affected by the co-dopant ratio. When the F:W co-dopant ratio increases from 0.25:0.25 to 0.75:0.50, the transmittance in the short wavelengths slightly increases and transmittance edge shifts towards shorter wavelength. With an increase in the co-dopant ratio, the reduction and red shifts in the optical transmittance edge are very obvious at all wavelengths. Transmittance values at 550 nm for the films have varied between 79.64% and 50.20%. The indirect and direct band gap values for WFTO-1, WFTO-2, WFTO-3 and WFTO-4 samples were calculated to be 3.73, 3.79, 3.48, 3.40 eV and 4.03, 4.04, 3.98, 3.97 eV, respectively. The crystal structure of the films has been investigated by X-ray diffraction patterns. It has been observed that WFTO-1 and WFTO-2 samples have (111) preferential orientation corresponding to SnO2 cubic phase. This orientation almost disappears and changes to tetragonal phase (110) orientation for WFTO-3 and WFTO-4. To the best of our knowledge, this is the first cubic structure observation for SnO2 grown by the sol–gel technique. The electrical properties were also changed with co-doping ratio. The best optical, electrical and structural properties were obtained for mole ratio 0.75:0.50 (F:W). Keywords: tin (IV) oxide (SnO2), fluorine (F) and tungsten (W) co-doping, sol–gel.
1. Introduction
Transparent and conductive thin films, owing to their high transmittance and conductivity, have widely been used in optoelectronic applications [1, 2]. In recent years, there has been a growing interest in the use of transparent conducting oxide thin
films for the conducting solar window materials [3], heat reflectors [4, 5] and various gas sensors [6, 7] and their applications. Among the different transparent conductive
oxides, tin (IV) oxide (SnO2) has significant commercialization [8, 9]. When SnO2 is
co-doped with F and W, the dopants give extra free electrons to SnO2 lattice [10, 11]
and cause an increase in the electrical conductivity and optical transmittance. Both parameters make films more appropriate for solar cell application. Doped and
undoped SnO2 thin films can be synthesized by various techniques such as thermal
evaporation [8], sputtering [12], chemical vapor deposition [13], spray pyrolysis [11], hydrothermal method [14], pulsed plasma deposition (PPD) [15], pulsed laser deposi-tion (PLD) [16], reactive evaporadeposi-tion [17] and the sol–gel spin coating technique [18]. Among these techniques, the sol–gel spin coating is attractive due to its easy manipula-tion, ability to prepare high quality thin films in a large scale, simplicity, safety, low cost of apparatus [19–21] and easy control of chemical components [22]. To the best
of our knowledge, the synthesis of F and W co-doped SnO2 films has not been reported
up to now by the sol–gel spin coating method. Therefore, in this study, we aimed to investigate the effect of F and W co-doping on optical, electrical and structural
properties of spin coated SnO2 films. Also, we investigated the evaluation of these
films for use as a transparent conductor material in solar cell applications.
2. Experiment
2.1. Sample preparation
In the present study, F and W co-doped tin oxide (WFTO) films were prepared by the sol–gel spin coating method on soda lime glass substrates having about 5 eV band gap value [23]. The precursor solution was prepared by using tin chloride dihydrate
(SnCl2·2H2O), 2-methoxyethanol (C3H8O2) and monoethanolamine (C2H7NO, MEA)
as starting material, solvent and stabilizer, respectively. For the F and W co-doped thin
films, ammonium fluoride (NH4F) and tungsten hexachloride (WCl6) form were used
as fluorine and tungsten doping source, respectively, and they simultaneously were
added by dissolving in the solution. The molar ratios of SnCl2·2H2O and metal dopant
sources to MEA were maintained at 1:1. 0.1 M SnCl2·2H2O, 0.1 M NH4F and
0.1 M WCl6 were mixed in different solutions to obtain the mole ratios as 0.25:0.25,
0.75:0.50, 1.25:0.75, 1.75:1.00 for F and W, respectively. The co-doped films were named as WFTO-1, WFTO-2, WFTO-3 and WFTO-4, respectively. The precursor sol was stirred at 70 °C for 1 h in a tightly-closed flask to obtain a clear and homogenous solution. Soda-lime glass substrates were kept in boiling chromic acid solution and they were rinsed with deionized water. They then were cleaned with acetone, methanol and deionized water by using an ultrasonic cleaner and dried with nitrogen. The sub-strate dropped resultant solution was rotated at a speed of 2500 rpm for 30 s by using a spin-coater. After the glass substrates were coated, they were sintered at 200 °C for 5 min to evaporate solvent and remove the organic sediments and then spontaneously cooled to room temperature. This procedure was repeated for seven times and finally the samples were annealed in air ambient at 450 °C for 30 min.
2.2. Characterization
The optical transmittance and absorbance measurements were recorded in the spectral region of 300–1000 nm at 300 K by using a UV-VIS spectrophotometer (Perkin–Elmer, Lambda 40) which works in the range of 200–1100 nm. When the optical properties of the films were measured, a soda-lime glass being identical to substrate was used as a reference. Therefore, transmittance and absorbance values of glass substrate with-out a film were extracted from the values obtained for the deposited film grown on a substrate at the same wavelength; and therefore, only the transmittance and absor-bance of the films were obtained. The structural characterization of the WFTO thin films was carried out by X-ray diffraction (XRD) measurements using a Rigaku
Miniflex II diffractometer with CuKα radiation (λ= 1.5418 Å). The diffractometer
reflections were taken at room temperature and the values of 2θ were altered between
10 and 80 deg in step of 0.05 deg.The sheet resistance values of films were measured by means of the four point probe technique by using Keithley 2400 sourcemeter. In four probe measurements, probes were arranged in a single line and outer pair was carrying current and the sheet resistance values were obtained from values of applied current and measured voltage (by measuring voltage between inner pairs).
3. Results and discussions
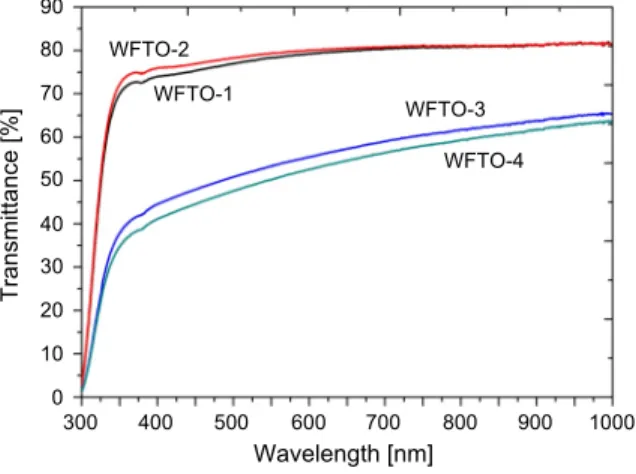
3.1. Optical propertiesThe optical properties of WFTO thin films were investigated by UV-VIS spectrometer at room temperature. The transmittance spectra of the films have been given in Fig. 1. As can be seen from this figure, when the F/W co-dopant ratio increases from 1.00 for WFTO-1 to 1.50 for WFTO-2, the transmittance in the short wavelengths slightly in-creases. Compared with WFTO-1, the optical transmittance edge of the WFTO-2 shifts slightly towards shorter wavelength. With the increase in the co-dopant ratio, 1.66 for WFTO-3 and 1.75 for the WFTO-4, the reduction and red shifts in the optical
trans-90 80 70 60 50 40 30 20 10 0 300 400 500 600 700 800 900 1000 WFTO-1 T ransmitta nce [% ] Wavelength [nm] WFTO-2 WFTO-3 WFTO-4
mittance edge are very obvious at all wavelength ranges. The reason of the decrease in transmittance at a higher dopant ratio (or doping concentration) may be defects being created by high doping.
The analysis of the dependence of an absorption coefficient on photon energy in the high absorption regions is carried out to obtain the detailed information about
the energy band gaps. The absorption coefficient α is determined by the Lambert’s
equation [24],
(1) where T is the transmittance and d is the film thickness. The variation of the absorption
coefficient against the photon energy hν has the form of [25]
(2)
where Eg is the band gap, A is a constant and n is equal to one for a direct-gap material
and to four for an indirect-gap material [26]. To determine whether the co-doped films
have a direct or indirect band gap, (αhν)2 vs. photon energy and (αhν)1/2 vs. photon
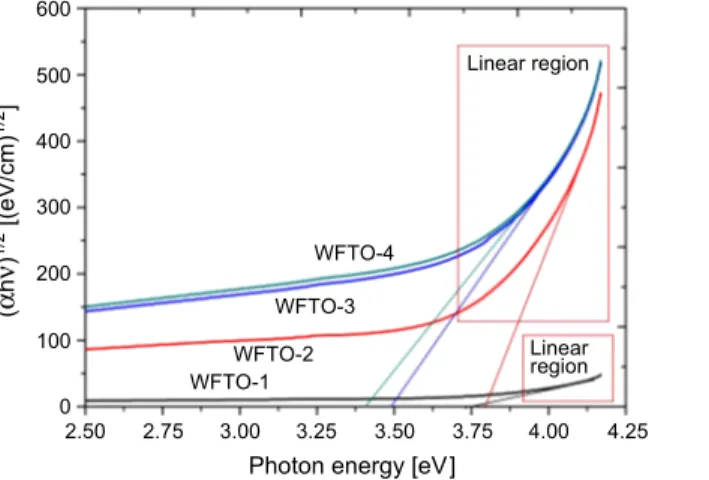
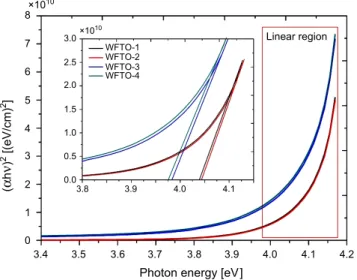
energy figures were attempted to plot and these plots were given in Figs. 2 and 3, respectively. In addition, the inset of Fig. 3 shows the band gap energy determination of samples for smaller scale axis because of separating lines. As can be seen from
squares indicated by red lined in these figures, the (αhν)2 vs. photon energy plots have
better linearity than (αhν)1/2 vs. photon energy plots. Therefore, it can be concluded
that the co-doped films are direct band gap semiconductor materials [26]. The indirect and direct band gap values for WFTO-1, WFTO-2, WFTO-3 and WFTO-4 samples were calculated to be 3.73, 3.79, 3.48, 3.40 eV and 4.03, 4.04, 3.98, 3.97 eV,
α = ---ln(1 Td⁄ )
αhν = A h( ν –Eg)n 2⁄
Linear region
WFTO-1
Photon energy [eV]
WFTO-2 WFTO-3 WFTO-4 600 500 400 300 200 100 0 2.50 2.75 3.00 3.25 3.50 3.75 4.00 4.25 ( α h ν ) 1/2 [(eV/cm) 1/2 ] Linear region
Fig. 2. The (αhν)1/2 versus photon energy plot for the calculation of an indirect band gap value of WFTO samples.
respectively. As can be expected, the direct optical band gap values are higher compared to indirect optical band gap values. The similar results were obtained by
DUA et al. [27] and the direct optical band gap values agree with those found by DUA
et al. [27] and TH DIANA et al. [28].
When F and W co-dopant ratio is increased from 0.25:0.25 (F:W) for WFTO-1 to
0.75:0.50 for WFTO-2 in SnO2 lattice, the band gap value slightly increases and then
decreases with further F and W co-dopant ratios. The reason of the increase in the band
gap with W and F co-doping can probably be explained as follows; since SnO2 is one
of degenerate semiconductors [29] in which the Fermi level is within the conduction band [30], the optical band gaps are directly related to the excitation of the electrons from the valance band to Fermi level [31, 32] and/or conduction band. This means that there is a shift of the Fermi level into the conduction band of the semiconductor due to the increase in the carrier density leading to the energy band broadening (shifting)
with some of the Sn4+ and O2– ions being replaced by W6+ and F– in the lattice. This
is called the Moss–Burstein effect [33]. As can be seen from XRD spectra of the films, the decrease in the peak intensities can be attributed to the crystal quality being deteriorated with a co-doping ratio increase. When F and W co-doping ratio is increased in the crystal structure, the dopants cannot be placed into the proper lattice positions. This can lead to forming crystal defects and causing high surface roughness. Therefore, the decrease in the band gap and transmittance values for WFTO-3 and WFTO-4 films can be due to the enhancement in photon scattering because of crystal defects which create lattice strain by co-doping with F and W [34–36].
Linear region
WFTO-1
Photon energy [eV]
WFTO-2 WFTO-3 WFTO-4 8 7 6 5 4 3 2 3.4 3.5 3.6 3.7 3.8 3.9 4.0 4.1 ( α h ν ) 2 [(eV/cm) 2] ×1010 1 0 4.2 ×10¹⁰ 3.0 2.5 2.0 1.5 1.0 0.0 3.8 3.9 4.0 4.1 0.5
Fig. 3. The (αhν)2 versus photon energy plot for the calculation of a direct band gap of WFTO samples; the inset shows the band gab energy determination of samples for smaller scale axis because of separating lines.
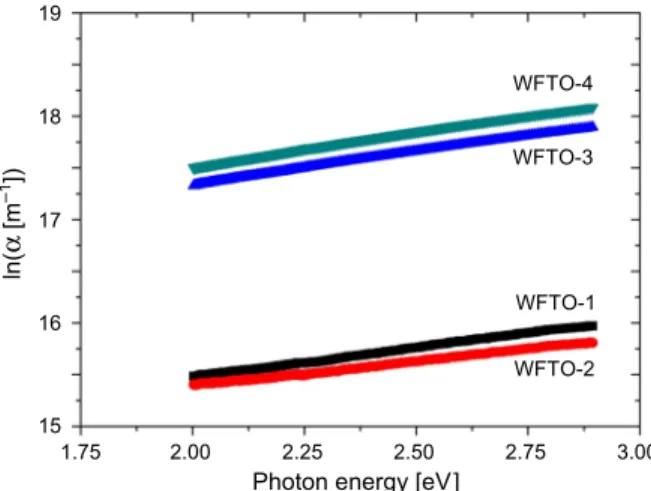
Exponential absorption tails for photon energies of sub-band gap in both crystalline and amorphous materials have attracted considerable attention in recent years. Various mechanisms such as the excitons may affect the absorption phenomena. Figure 4 shows spectral dependences of the logarithm of an absorption coefficient as a function of energy for WFTO films.
The optical absorption coefficient shows a temperature-dependent exponential tail
for E < Eg [37]:
(3)
where, E0 and α0 are constants, which can be determined from the ln(α) versus E.
Urbach energy Eu is assigned to the steepness of the Urbach tail. It is a function of
temperature and the degree of crystal disorder of the material. It has a significant role in the characteristic analysis of a semiconductor. The previous statements imply that the Urbach energy can be expressed into two components as a temperature-dependent and temperature-independent term:
(4) The thermal disorder of the material is associated with the temperature-dependent term, while the temperature-independent component is related to its inherent structural
disorder [38]. The steepness parameter σ is found as:
(5)
WFTO-1
Photon energy [eV]
WFTO-2 WFTO-3 WFTO-4 19 18 17 16 15 1.75 2.00 2.25 2.50 2.75 3.00 ln( α [m –1])
Fig. 4. The Urbach plots for the WFTO films.
α(E T, ) α0 E E– 0 Eu(T X, ) ---⎩ ⎭ ⎨ ⎬ ⎧ ⎫ exp = Eu(T X, ) = Eu( ) ET + u( )X σ kTE u ---=
By taking the natural logarithm on both sides of Eq. (5):
(6)
where Urbach energy Eu is equal to the absorption edge energy width and inverse to
the absorption edge slope value,
(7)
where Urbach energy Eu only depends on the degree of structural disorders as a
func-tion of X (lattice strains and dislocafunc-tion densities), in constant temperature [38].
The Eu values were found to be 140, 141, 158 and 160 meV and σ values were
found to be 1.846×10⁻⁴, 1.833×10⁻⁴, 1.636×10⁻⁴ and 1.617×10⁻⁴ for WFTO-1,
WFTO-2, WFTO-3 and WFTO-4, respectively. Urbach energy values of the films increase with F/W co-dopant ratio. The optical band gaps of the films change oppo-sitely with Urbach energy. This result causes a redistribution of states, such as from band-to-tail and tail-to-tail transitions, and the optical gap decreases due to the broad-ening of the Urbach tail.
The reflectance R of the films is found by using relationship [39],
(8) where T and A are transmission and absorption, respectively. The absorption and reflectance (as a percentage) spectra are given in Figs. 5 and 6, respectively. Refractive index n of the samples and extinction coefficient k are calculated by the following equations [40]:
(9) and
(10)
where R, α and λ are reflectance, absorption coefficient and wavelength, respectively.
The n and k values dependence on wavelength is shown in Figs. 7 and 8, respectively. As can be seen from Figs. 7 and 8, n and k values depend on wavelength. Compared with WFTO-1, the extinction coefficient value of WFTO-2 decreases for WFTO-2 and then continuously increases with the increase in the W/F co-dopant ratio for WFTO-3 and WFTO-4. At short wavelengths, k values are small due to the Burstein–Moss shift [33], but they are high at near-infrared spectral regions
α ( ) ln E Eu --- ln( )α0 E0 Eu ---+ = Eu–1 d ln( )α d E ---= R+T+A = 1 n 1+R 1 R– --- 4R 1 R– ( )2 --- k– 2 + = k αλ 4π ---=
1. 0 0. 8 0. 6 0. 4 0. 2 0. 0 400 5 00 600 700 800 90 0 1000 WFTO -1 Absorption Wavelen gth [nm] WFT O -2 WFT O -3 WF TO -4 Fig. 5. The absorpt
ion spectra for the
WFTO thin fi lms. Fig. 6. The reflectan ce spectra for th
e WFTO thin films.
20 15 10 5 0 40 0 5 00 600 7 00 800 9 00 100 0 WF TO -1 Reflectance [%] Wa velength [n m] WFTO -2 WFTO -3 WFTO -4 Fi g. 7. Th e var iatio n o f extin ction co effi cient wit h wavel engt h f or WFTO thi n fi lms. Fig. 8. The variation of refractive index
for WFTO thi
n films with wavel ength . 0. 35 0. 30 0. 20 0. 15 0. 05 0. 00 400 5 00 600 700 800 90 0 1000 WF TO -1 Extinction coefficient k Wavelen gth [nm] WFTO -2 WFTO -3 WFTO -4 0. 25 0. 10 2. 6 2. 2 1. 8 1. 4 1. 0 40 0 5 00 600 7 00 800 9 00 100 0 WFTO -1 Refractive index n Wa velength [n m] WF TO -2 WFTO -3 WFTO -4
because of the increase in the free carrier absorption [41]. The n values have been obtained for the different W/F co-dopant ratio, and their average values for WFTO-1, WFTO-2, WFTO-3 and WFTO-4 were found to be 1.99, 1.98, 2.48 and 2.51, respectively. These values are in agreement with those reported by other research-ers [42–44]. It can be concluded that the films with lower carrier concentration have a higher refractive index. The values of the refractive index in this study are comparable to those reported in the literature [45, 46].
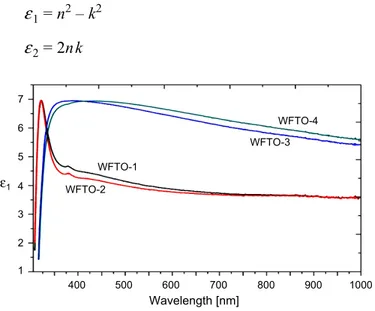
The fundamental electron excitation spectrum of the films is described by means
of a complex electronic dielectric constant. The real ε1 and imaginary ε2 parts of
the dielectric constant are related to the n and k values. The ε1 and ε2 values are
calculated using the following equations [47, 48]:
ε1= n2 – k2 (11) ε2= 2nk (12) 7 6 4 2 1 400 500 600 700 800 900 1000 WFTO-1 Wavelength [nm] WFTO-2 WFTO-3 WFTO-4 5 3 ε1
Fig. 9. The variation of real dielectric constants for WFTO films as a function of wavelength.
0.7 0.6 0.4 0.2 0.1 400 500 600 700 800 900 1000 WFTO-1 Wavelength [nm] WFTO-2 WFTO-3 WFTO-4 0.5 0.3 ε2
The dielectric constant values depending on the wavelength have been given in
Figs. 9 and 10, respectively. As can be seen in these figures, the ε1 values are higher
than ε2 values.
3.2. Electrical properties
The sheet resistance values of WFTO films were measured by a four point probe method. As can be seen in Tab. 1, the F/W co-dopant ratio increases from 1.00 for WFTO-1 to 1.50 for WFTO-2, there is a decrease in sheet resistance, then there is a reduction in sheet resistance value for WFTO-3 (F/W ratio, 1.66) and WFTO-4
(F/W ratio, 1.75). The variation in the sheet resistance of SnO2 with F and W co-doping
can be explained as follows: when SnO2 is doped with F and W, some of the O2– and
Sn4+ ions in the lattice can be replaced by F– and W6+ and this can cause the sheet
resistance. In particular, a part of the W6+ ions is reduced to the low valance states,
resulting in the formation of acceptor states and a loss of carriers [10, 15, 18]. In
addition to this, F– ions do not occupy suitable lattice states. Thus, the increase in
the sheet resistance may be observed [11]. This result is in accordance with that of optical studies.
T a b l e 1. Optical and electrical properties of WFTO thin films. Sample name Sheet resistance R
s [Ω] Band gap Eg [eV] Transmittance T at 550 nm [%] Figure of merit Φ [Ω–1] WFTO-1 14.50×10⁴ 4.03 78.27 5.95×10⁻⁷ WFTO-2 8.61×10⁴ 4.04 79.64 1.19×10⁻⁶ WFTO-3 11.30×10⁴ 3.98 53.28 1.63×10⁻⁸ WFTO-4 13.10×10⁴ 3.97 50.20 7.76×10⁻⁹ 15 14 13 12 11 10 9 8 Rs Φ WFTO-1 1.4 1.0 0.6 0.2 ×10⁻⁶ Sheet resistan ce R s [ Ω ] Figure o f merit Φ [ Ω –1] ×104
WFTO-2 WFTO-3 WFTO-4
The figure of merit is an important parameter for evaluating transparent conducting oxides thin films for use in solar cells [31]. Therefore, the figure of merit values of the films was calculated and its variation with F/W co-dopant ratio was investigated. In order to compare the performance of various transparent conductors, the most widely used figure of merit is defined by the Haacke formulation [36],
Φ= T10/R
s (13)
where T is the transmittance at 550 nm and Rs is the sheet resistance. This formula
gives more weight to the transparency and thus is better adapted to solar cell technology. It is clear that figure of merit is dependent on the sheet resistance. Figure 11 shows the sheet resistance and figure of merit variation with F/W co-dopant ratio. The calculated figure of merit values are given in Table 1 together with sheet resistance, transmittance and band gap. It is found that WFTO-2 film has the highest
value obtained in the present study (1.19×10⁻⁶Ω–1). This is possibly due to formation
of a good quality film in terms of conductivity and transmittance. 3.3. Structural properties
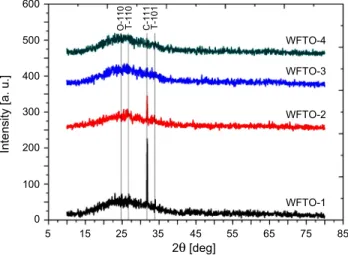
The crystal structure of spin coated WFTO thin films has been investigated by X-ray diffraction (XRD) patterns. Figure 12 shows XRD spectra of F and W co-doped
SnO2 thin films. As can be seen from these spectra, WFTO-1 and WFTO-2 samples
have (111) preferential orientation corresponding to SnO2 cubic phase (JCPDS 50-1429),
but this orientation almost disappears and changes to tetragonal phase (110) orientation (JCPDS 41-1445) for WFTO-3 and WFTO-4. To the best of our knowledge, this is
the first cubic structure observation for SnO2 grown by sol–gel technique. In the
lit-erature, generally ethanol [49, 50], 1-propyl alcohol [51], mixture of water and
alco- O-11 0 T-11 0 C-11 1 T-10 1 WFTO-1 600 500 400 300 200 100 0 5 15 25 35 45 55 65 75 85 Inte
nsity [a. u.]
2θ [deg]
WFTO-2 WFTO-3 WFTO-4
hol [27, 52] are used as a solvent for the preparation of SnO2 by the sol–gel route. YANWEI HUAN et al. [18] have prepared W-doped SnO2 thin film from sol–gel solution
including diluted SnCl2·2H2O and WCl6 solved in the mixture of ethanol/water.
SnO2 tetragonal phase was obtained in all these studies. The (110) and (101) peaks of
tetragonal phase have been observed at very little intensities for films. Also, there is an orthorhombic (110) peak (JCPDS 29-1484) at intensities which may be neglected. When the doping ratio is increased, it is observed that peak intensities continuously decrease and there is a nearly amorphous phase formation for WFTO-3 and WFTO-4. The reason for this may be that F and W atoms do not occupy the appropriate lattice
sites with increasing doping and so crystallization deteriorates. SnO2 crystallizes in
the tetragonal rutile crystal system, but there are also orthorhombic and cubic phases
of SnO2. Tetragonal, orthorhombic and cubic phases of SnO2 have been observed by
some research groups [53, 54]. Similarly, in this study, SnO2 hetero-phase structure
has been observed.
4. Conclusions
In the present study, we have firstly prepared F and W co-doped SnO2 thin films by
the sol–gel spin coating method. The effect of F/W co-dopant ratio on optical properties
of SnO2 has extensively been investigated. Transmittances at 550 nm and optical
band gap values for the films have varied between 79.64–50.20% and 4.04–3.97 eV, respectively, and the highest value was obtained for WFTO-2. The average refractive index values of WFTO-1, WFTO-2, WFTO-3 and WFTO-4 have been found to be 1.99, 1.98, 2.48 and 2.51, respectively. The electrical and structural properties of the films have also been investigated. It has been found that the co-dopant ratio is much effective on the optical and structural properties of the films. The best optical, electrical and structural properties were obtained for mole ratio 0.75:0.50 (F:W).
Acknowledgments – This work was supported by the Atatürk University Research Fund, Project Numbers:
2012/282 and 2012/283. One of the authors (G. Turgut) would like to thank Prof. Dr. Ümit Turgut and Assoc. Prof. Refik Dilber for their technical support.
References
[1] DENGKUI MIAO, QINGNAN ZHAO, SHUO WU, ZHENDONG WANG, XINGLIANG ZHANG, XIUJIAN ZHAO, Effect
of substrate temperature on the crystal growth orientation of SnO2:F thin films spray-deposited on glass substrates, Journal of Non-Crystalline Solids 356(44–49), 2010, pp. 2557–2561.
[2] EXARHOS G.J., XIAO-DONG ZHOU, Discovery-based design of transparent conducting oxide films, Thin Solid Films 515(18), 2007, pp. 7025–7052.
[3] ELANGOVAN E., RAMAMURTHI K., Optoelectronic properties of spray deposited SnO2:F thin films for
window materials in solar cells, Journal of Optoelectronics and Advanced Materials 5(1), 2003,
pp. 45–54.
[4] FRANK G., KAUER E., KÖSTLIN H., SCHMITTE F.J., Transparent heat-reflecting coatings for solar
applications based on highly doped tin oxide and indium oxide, Solar Energy Materials 8(4), 1983,
[5] COHEN S., Low emissivity coatings for the improvement of the insulation properties of double-glazing
units, Thin Solid Films 77(1–3), 1981, p. 127.
[6] GOETZBERGER A., HEBLING C., Photovoltaic materials, past, present, future, Solar Energy Materials and Solar Cells 62(1–2), 2000, pp. 1–19.
[7] THANGARAJU B., Structural and electrical studies on highly conducting spray deposited fluorine and
antimony doped SnO2 thin films from SnCl2 precursor, Thin Solid Films 402(1–2), 2002, pp. 71–78.
[8] WAN-YOUNG CHUNG, CHANG-HYUN SHIM, DUK-DONG LEE, SOON-DON CHOI, Tin oxide microsensor
for LPG monitoring, Sensors and Actuators B 20(2–3), 1994, pp. 139–143.
[9] ELANGOVAN E., SHIVASHANKAR S.A., RAMAMURTHI K., Studies on structural and electrical properties
of sprayed SnO2:Sb films, Journal of Crystal Growth 276(1–2), 2005, pp. 215–221.
[10] YANWEI HUANG, QUN ZHANG, GUIFENG LI, Transparent conductive tungsten-doped tin oxide
polycrystalline films prepared on quartz substrates, Semiconductor Science and Technology 24(1),
2009, article 015003.
[11] MOHOLKAR A.V., PAWAR S.M., RAJPURE K.Y., ALMARI S.N., PATIL P.S., BHOSALE C.H.,
Solvent--dependent growth of sprayed FTO thin films with mat-like morphology, Solar Energy Materials
and Solar Cells 92(11), 2008, pp. 1439–1444.
[12] QING NAN ZHAO, SHUO WU, DENG KUI MIAO, Effect of substrate temperature on the haze and
properties of SnO2:F thin film coated on glass (FTO) by spray pyrolysis process, Advanced
Materials Research 150–151, 2010, pp. 1043–1048.
[13] SHEWALE P.S., PATIL S.I., UPLANE M.D., Preparation of fluorine-doped tin oxide films at low
substrate temperature by an advanced spray pyrolysis technique, and their characterization,
Semiconductor Science and Technology 25(11), 2010, article 115008.
[14] QIANWANG CHEN, YITAI QIAN, ZUYAO CHEN, GUIEN ZHOU, YUHENG ZHANG, Fabrication of ultrafine
SnO2 thin films by the hydrothermal method, Thin Solid Films 264(1), 1995, pp. 25–27.
[15] HUANG Y., ZHANG Q., LI G., YANG M., Tungsten-doped tin oxide thin films prepared by pulsed
plasma deposition, Materials Characterization 60(5), 2009, pp. 415–419.
[16] NAKAO S., YAMADA N., HITOSUGI T., HIROSE Y., SHIMADA T., HASEGAWA T., Fabrication of
transparent conductive W-doped SnO2 thin films on glass substrates using anatase TiO2 seed layers,
Physica Status Solidi (C) 8(2), 2011, pp. 543–545.
[17] MURANAKA S., BAND Y., Reactive deposition of W-, Mo- and V-doped SnO2 films, Bulletin of the Institute for Chemical Research, Kyoto University 70(4), 1992, pp. 430–434.
[18] YANWEI HUANG, DEZENG LI, JIAHAN FENG, GUIFENG LI, QUN ZHANG, ZHANG Q., Transparent
conductive tungsten-doped tin oxide thin films synthesized by sol–gel technique on quartz glass substrates, Journal of Sol–Gel Science and Technology 54(3), 2010, pp. 276–281.
[19] GHODSI F.E., ABSALAN H., Comparative study of ZnO thin films prepared by different sol–gel route, Acta Physica Polonica A 118(4), 2010, pp. 659–664.
[20] SAGAR P., KUMAR M., MEHRA R.M., Electrical and optical properties of sol–gel derive ZnO:Al thin
films, Materials Science-Poland 23(3), 2005, pp. 685–696.
[21] ROKNABADI M. R., BEHDANI M., ARABSHAHI H., HODEINI N., Indium-doped zinc oxide thin films
sol–gel method, International Review of Physics 12, 2009, pp. 153–157.
[22] ILICAN S., CAGLAR Y., CAGLAR M., Preparation and characterization of ZnO thin films deposited
by sol–gel spin coating method, Journal of Optoelectronics and Advanced Materials 10, 2008,
pp. 2578–2583.
[23] FARSON D.F., HAE WOON CHOI, ZIMMERMAN B. , STEACH J.K., CHALMERS J.J., OLESIK S.V., LEE L.J.,
Femtosecond laser micromachining of dielectric materials for biomedical applications, Journal of
Micromechanics and Microengineering 18(3), 2008, article 035020.
[24] SERIN T., SERIN N., KARADENIZ S., SARI H., TUGLUOGLU N., PAKMA O., Electrical, structural and
optical properties of SnO2 thin films prepared by spray pyrolysis, Journal of Non-Crystalline
[25] TAUC J., GRIGOROVICI R., VANCU A., Optical properties and electronic structure of amorphous
germanium, Physica Status Solidi (B) 15(2), 1966, pp. 627–637.
[26] RAVICHANDRAN,K., MURUGANANTHAM G., SAKTHIVEL B., PHILOMINATHAN P., Nanocrystalline doubly
doped tin oxie films deposited using a simplified and low-cost spray technique for solar cell applications, Journal of Ovonic Research 5(3), 2009, pp. 63–69
[27] DUA L.K., DE A, CHAKRABORTY S., BISWAS P.K., Study of spin coated high antimony content
Sn–Sb oxide films on silica glass, Materials Characterization 59(5), 2008, pp. 578–586.
[28] TH DIANA, NOMITA DEVI K., NANDAKUMAR SARMA H., On the optical properties of SnO2 thin films
prepared by sol–gel method, Indian Journal of Physics 84(6), 2010, pp. 687–691.
[29] BATZILL M., DIEBOLD U., The surface and materials science of tin oxide, Progress in Surface Science 79(2–4), 2005, pp. 47–154.
[30] LINGANE J.J., SMALL L.A., Polarography of the various oxidation states of tungsten, Journal of American Chemical Society 71(3), 1949, pp. 973–978.
[31] BABAR A.R., SHINDE S.S., MOHOLKAR A.V., BHOSALE C.H., KIM J.H., RAJPURE K.Y., Structural and
optoelectronic properties of antimony incorporated tin oxide thin films, Journal of Alloys and
Compounds 505(2), 2010, pp. 416–422.
[32] BABAR A.R., SHINDE S.S., MOHOLKAR A.V., BHOSALE C.H., KIM J.H., RAJPURE K.Y., Sensing
properties of sprayed antimony doped tin oxide thin films: solution molarity, Journal of Alloys and
Compounds 509(6), 2011, pp. 3108–3115.
[33] BURSTEIN E., Anomalous optical absorption limit in InSb, Physical Review 93(3), 1954, pp. 632–633. [34] FREUND L.B., SURESH S., Thin Film Materials: Stress, Defect Formation and Surface Evolution,
Cambridge University Press, Cambridge, 2003.
[35] LEE Y.H., LEE W.J., KWON Y.S., YEOM G.Y., YOON J.K., Effects of CdS substrates on the physical
properties of polycrystalline CdTe films,Thin Solid Films 341(1–2), 1999, pp. 172–175.
[36] MEMARIAN N., ROZATI S.M., ELEMURUGU E., FORTUNATO E., Characterization of SnO2:F thin
films deposited by an economic spray pyrolysis technique, Physica Status Solidi (C) 7(9), 2010,
pp. 2277–2281.
[37] IRIBARREN A., FERNÁNDEZ P., PIQUERAS J., Influence of defects on cathodoluminescence along
ZnTexO1 – x–ZnO microstructures grown by the vapour-solid technique, Revista Cubana de Física
26(2A), 2009, pp. 116–119.
[38] PEJOVA B., The Urbach–Martienssen absorption tails in the optical spectra of semiconducting
variable-sized zinc selenide and cadmium selenide quantum dots in thin film form, Materials
Chemistry and Physics 119(3), 2010, pp. 367–376.
[39] MISHRA R.L., MISHRA S.K., PRAKASH S.G., Optical and gas sensing characteristics of tin oxide
nano-crystaline thin film, Journal of Ovonic Research 5(4), 2009, pp. 77–85.
[40] AKSOY S., CAGLAR Y., ILICAN S., CAGLAR M., Effect of Sn dopants on the optical and electrical
properties of ZnO films, Optica Applicata 40(1), 2010, pp. 7–14.
[41] FACHUN LAI, LIMEI LIN, RONGQUAN GAI, YONGZHONG LIN, ZHIGAO HUANG, Determination of optical
constants and thicknesses of In2O3:Sn films from transmittance data, Thin Solid Films 515(18),
2007, pp. 7387–7392.
[42] DEBAJYOTI D., RATNABALI B., Properties of electron-beam-evaporated tin oxide films, Thin Solid Films 147(3), 1987, pp. 321–331.
[43] FANTINI M., TORRIANI I., The compositional and structural properties of sprayed SnO2:F thin films, Thin Solid Films 138(2), 1986, pp. 255–265.
[44] RAJPURE K.Y., KUSUMADE M.N., NEUMANN-SPALLART M.N., BHOSALE C.H., Effect of Sb doping on
properties of conductive spray deposited SnO2 thin films, Materials Chemistry and Physics 64(3),
2000, pp. 184–188.
[45] FUJIWARA H., KONDO M., Effects of carrier concentration on the dielectric function of ZnO:Ga and
In2O3:Sn studied by spectroscopic ellipsometry: analysis of free-carrier and band-edge absorption,
[46] MERGEL D., QIAO Z., Dielectric modelling of optical spectra of thin In2O3:Sn films, Journal of Physics D: Applied Physics 35(8), 2002, pp. 794–801.
[47] HODGSON J.N., Optical Absorption and Dispersion in Solids, Chapman and Hall, 1970.
[48] ILICAN S., ZOR M., CAGLAR Y., CAGLAR M., Optical charecterization of the CdZn(S1–xSex)2 thin film
deposited by spray pyrolysis method, Optica Applicata 36(1), 2006, pp. 29–37.
[49] TERRIER C., CHATELON J.P., ROGER J.A., BERJOAN R., DUBOIS C., Analysis of antimony doping in tin
oxide thin films obtained by the sol–gel method, Journal of Sol–Gel Science and Technology 10(1),
1997, pp. 75–81.
[50] YUNG-JEN LIN, CHING-JIUNN WU, The properties of antimony-doped tin oxide thin films from
the sol–gel process, Surface and Coatings Technology 88(1–3), 1997, pp. 239–247.
[51] IZERROUKEN M., KERMADI S., SOUAMI N., SARI A., BOUMAOUR M., Influence of reactor neutrons
irradiation on electrical, optical and structural properties of SnO2 film prepared by sol–gel method,
Nuclear Instruments and Methods in Physics Research Section A 611(1), 2009, pp. 14–17. [52] YUHUA XIAO, SHIHUI GE, LI XI, YALU ZUO, XUEYUN ZHOU, BANGMIN ZHANG, LI ZHANG, CHENGXIAN
LI, XIUFENG HAN, ZHENCHAO WEN, Room temperature ferromagnetism of Mn-doped SnO2 thin films
fabricated by sol–gel method, Applied Surface Science 254(22), 2008, pp. 7459–7463.
[53] SHIEN A.R., KUBO A., DUFFY T.S., PRAKAPENKA V.B., SHEN G., High-pressure phases in SnO2 to
117 GPa, Physical Review B 73(1), 2006, article 014105.
[54] HAINES J., LEGÉR J.M., X-ray diffraction study of the phase transitions and structural evolution
of tin dioxide at high pressure: relationships between structure types and implications for other rutile-type dioxides, Physical Review B 55(17), 1997, pp. 11144–11154.
Received September 18, 2012 in revised form January 6, 2013