www.arccjournals.com/www.ijaronline.in
*Corresponding author’s e-mail: [email protected]
1Omer Halisdemir University, Faculty of Ayhan Sahenk Agricultural Sciences and Technologies, Department of Animal Production and Technologies,
51240, Nigde, Turkey.
2Osmangazi University, Faculty of Agriculture, Department of Animal Science, 26160, Eskisehir, Turkey. 3Ahi Evran University, Faculty of Agriculture, Department of Animal Science, 40100 Kirsehir, Turkey.
4Ahi Evran University, Faculty of Agriculture, Department of Agricultural Biotechnology, 40100 Kirsehir, Turkey. 5Ondokuz Mayis University, Faculty of Agriculture, Department of Agricultural Biotechnology, 55139, Samsun, Turkey.
.
Print ISSN:0367-6722 / Online ISSN:0976-0555
Genetic trends of body weight and some scanning traits of Karayaka lambs
Zafer Ulutaş1, Yüksel Aksoy2, Aziz Şahin3, Emre Şirin4, Ugur Şen*5 and Mehmet Kuran5 Omer Halisdemir University, Faculty of Ayhan Sahenk Agricultural Sciences and Technologies, Department of Animal Production and Technologies, 51240, Nigde, Turkey.
Received: 25-01-2017 Accepted: 23-11-2017 DOI: 10.18805/ijar.B-698
ABSTRACT
This investigation was conducted to estimate the breeding values and genetic trends for body weight (BW), scanning fat depth (SFD) and scanning muscle depth (SMD) of Karayaka lambs (n= 1059) at 140 ± 3.36 day of age. Experiments were conducted in a nucleus flock of Karayaka sheep under a selective breeding program to increase productivity at research farm of Gaziosmanpasa University between the years 2006 - 2011. Breeding values were estimated with ASREML software. While genetic trend for BW and SMD showed a smooth ascending trend, SFD exhibited a descending trend throughout the experimental period. The genetic trend for BW, SFD and SMD of Karayaka lambs were observed as 0.433 kg / year, -0.00686 mm / year and 0.00786 mm / year, respectively. The results showed that applying of a selection program on BW, SMD and SFD characteristics would increase BW and SMD values and decrease SFD value in Karayaka lambs.
Key words: Breeding value, Genetic trend, Karayaka, Lamb. INTRODUCTION
Karayaka sheep are native breed of Turkey and they are commonly raised in Black Sea Region, totaling about 1.3 million (TurkStat 2015). Karayaka sheep are a lean tailed and medium-sized (40 - 45 kg) breed and the body color is white, but there are brown and black spots over the body, especially head and neck (Sen et al. 2011). Karayaka sheep are generally defined as a “carpet-wool” breed, but male lambs of this breed are raised dominantly for meat production (Ulutas et al. 2008; Ulutas et al. 2010; Sen et al. 2011). After fattening period, they generally have a high meat quality because of mosaic distribution pattern of the fat among the muscle fibers (Ulutas et al. 2010). Therefore, usually Karayaka male lambs are grown and fattened for meat production. Karayaka breed is highly tolerant to extreme rainy environmental conditions, but profitability in Karayaka sheep farming is limited because of insufficient biological and socio-economic knowledge (Aksoy et al. 2016).
Body weight is the major component of meat production and is affected by genetic and environmental factors (Aksoy et al. 2016; Khan et al. 2017). The goal of lamb breeders is to develope this significant trait (Ulutas et
al. 2010; Malik et al. 2017). During the last forty years, a
definite trend has been observed in consumer desires for leaner meat and without thick layers of fat between and around the muscles (Swatland et al. 1994; Ulutas et al. 2008).
Therefore, it is significant to take lamb weights into consideration to build a breeding program. The determination of carcass characteristics before slaughtering is very important for meat type sheep breed (Ulutas et al. 2008; Sen et al. 2011). Therefore, determination of the muscle and fat depth on live animals with ultrasound technique is a useful application. Many researchers employed this technique on sheep to produced leaner meat (Ulutas et al. 2008; Simm et
al. 2002; Kvame and Vangen 2007). Also, estimates of the
heritability and genetic correlations of live weight (Khan et
al. 2015) and ultrasound muscle dimensions (Clarke et al.
1998, Ulutas et al. 2008; Aksoy et al. 2016), especially in longisismus-dorsi muscle, are more valuable indicators to the genetic improvement of carcass yield and composition through selection based on live animal.
Body weight, weaning weight, slaughter weight and carcass composition traits (fat and muscle depths) are very important traits in the sheep industry (Aksoy et al. 2016; Malik et al. 2017). The selective breeding organization for Karayaka native sheep breed was started in 2006 and the general aim of this breeding program was to increase the productive characteristics of Karayaka native sheep breed. The present study was, therefore, conducted to estimate genetic trends in scanning traits of Karayaka lambs under this selective breeding program through fitting animal model.
N, 36° 53`E and 650 m altitude). The relevant records covered the period from 2006 to 2011. A database containing pedigree information, body weight (BW), scanning fat depth (SFD) and scanning muscle depth (SMD) measurements of Karayaka lambs were used to gather the data from national research projects (TÜBİTAK / Project number: 104O329 and TAGEM / Project number: 60KYK2005-01). There were 1059 Karayaka lambs obtained from 554 ewes and sired by 53 rams. BW, SFD and SMD of lambs were measured at 140 ± 3.36 days of age. All ewes remained on open hill grazing until they were housed immediately before the start of lambing. Following the lambing, all lambs were kept with their dams in the sheepfold for two weeks. During this period all ewes were fed concentrate at 250 g / ewe / day and good quality alfalfa hay of 1 kg / ewe / day to meet approximately their daily requirement. Starting from day 15 of lambing, ewes were allowed to pasture in extensive areas of hills during the day time and to suckle their lambs over the nights in a barn. Additionally, ewes received supplementary feeding (approximately, concentrate at 150 g / ewe / day) in order to maintain body condition. After two weeks of age, all lambs were permitted to pasture with their mothers and received the creep-feed concentrate when they returned to sheepfold until 140 days of age. The basic statistics and covariates for each trait are presented in Table 1.
BW was determined using a weighbridge with a sensitivity of 1 gram. SFD and SMD were measured at 3rd lumbar vertebrae with an ultrasonic linear prop (Falco Vet. Lineer prop 8.0 MHz; Pie Medical Equipment Co., Maastricht, Netherlands). BW, SFD and SMD were measured simultaneously. General linear model of Minitab Version 12 was used for the preliminary data analyses. Gender of lamb, birth year, birth type and dam age were considered as fixed effects and lamb age was considered as linear covariate.
Breeding values of BW, SFD and SMD were estimated with restricted maximum likelihood estimation for animal models and pedigree information through ASREML (Gilmour et al. 1998). The following model including random effects of animal, sire and dam was used for this purpose.
Y: Observation vector
b: Vector including birth year, gender, birth type (single and
multiple) and age of ewe as fixed effects
a, m, c, e: Vectors respectively of direct additive genetic
effects, maternal genetic effects, permanent environmental effect of ewe and the residual.
X, Za, Zm, Zc: Incidence matrices relating observations
respectively to b, a, m and c.
A: Numerator relationship matrix
óam: Covariance between direct and maternal genetic effects The covariance structure of the random effects is defined as follows: V(a): Aó2 A; V(m): Aó 2 M ; V(c): Idó 2 C; V(e): Inó 2 E; Cov (a, m): AóAM where:
A: Numerator relationship matrix
ó2
A: Direct additive genetic variance
ó2
M: Maternal additive genetic variance
óAM: Direct - maternal additive genetic covariance
ó2
C: Maternal permanent environmental variance ó2
E: Residual variance
The genetic trends were expressed as changes in averages of breeding values across birth year of lambs. The matrix construction of the equality was below;
2 n 2 c 2 AM AM 2
0
0
0
0
0
0
0
0
0
0
E C M AI
I
A
A
A
A
e
c
m
a
v
where;Ic, Id, In: Identity matrices of an order equal respectively to the number of ewes and records.
2
A
: Direct additive genetic variance,
M2 : Maternal genetic variance,
C2: Variance of the permanent environmental effect of the ewe,
E2: Residual variance.Genetic trends were estimated through averaging the estimated breeding values for birth year of BW, SFD and SMD for Karayaka lambs and regressing the average of breeding values against the year. Microsoft Excel® was used to graph genetic trends. Minitab Version 12.11 (1998) was used to determine genetic trends.
RESULTS AND DISCUSSION
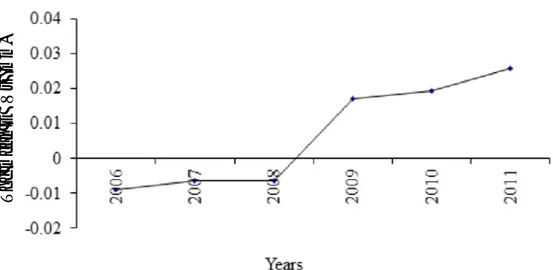
The mean estimated breeding values (EBVs) of BW for Karayaka lambs according to birth years are presented in Fig.1. There was an increase in the EBVs of BW according
Table 1: Basic statistics for each trait and covariate.
Mean s.e. Traits BW (kg) 30.32 0.17 SFD (mm) 1.84 0.02 SMD (mm) 17.55 0.09 Covariate Age at scanning 140 3.36
BW = body weight, SFD = scanning fat depth, SMD = scanning muscle depth
T
h
e
m
ea
n
E
B
V
s
(kg)
Fig 1: The mean estimated breeding values (EBVs) for body weight for Karayaka lambs according to birth years.
T
h
e
m
ea
n
E
B
V
s
(m
m
)
Fig 2: The mean estimated breeding values (EBVs) for scanning fat depth for Karayaka lambs according to birth years.
T
h
e
m
ea
n
E
B
V
s
(m
m
)
Karayaka lambs had higher variations in first year (2006) without selection. However, selecting of rams with low ultrasonic fat thickness and high ultrasonic muscle decreased variations in SFD, resulting in a decrease estimated breeding value of SFD in second year (2007) of selection program. The variation in breeding value of SFD was reduce in later years of selection program due to selection was made taking into consideration the same characteristics continuously. Genetic trends were expressed through regression of breeding values on birth years of lambs. Irregular fluctuations in breeding values for SFD were observed. The genetic trend for SFD was estimated as -0.00686±00002 mm/year (Table 2) and this value was negative and different from zero. Breeding values for SFD were positive in all years. Present results were smaller than the value found by Clarke et al. (1998) for Landcorp lambs (0.003 mm/year). A similar genetic trend was obtained by Simm et al. (2002) for Suffolk sheep in UK and by Milerski (2010) for Suffolk, Texel, to birth years from 2006 to 2011. The EBVs of BW for 2006, 2007, 2008, 2009, 2010 and 2011 birth years were -0.243 kg, -0.091 kg, 0.989 kg, 1.209 kg, 1.399 kg and 1.847 kg, respectively. Estimations were made for genetic trends through regression of breeding values on birth years of Karayaka lambs. Irregular fluctuations were observed in breeding values of BW Estimations were made for genetic trends through regression of breeding values on birth years of Karayaka lambs. The genetic trend for BW was estimated as 0.433±0.0486 kg/year (Table 2) and this value was different from zero. Breeding values for BW were negative in a couple of years (2006 and 2007) and the values were positive in other years (2008 to 2011). Clarke et al. (1998) reported that the average genetic trends of Landcorp lambs in EBVs were 1.00 kg/yr for 6 months of age. The genetic trend detected in the current study was smaller than the value reported by Clarke et al. (1998). However, a similar genetic trend was also obtained by Simm et al. (2002) for Suffolk sheep. The mean EBVs of SFD for Karayaka lambs according to birth years are presented in Fig.2. A decline was determined in EBVs of SFD between birth years. The EBVs of SFD for 2006, 2007, 2008, 2009, 2010 and 2011 birth years were 0.042 mm, 0.011 mm, 0.003 mm, 0.001 mm, 0.0007 mm and 0.0005 mm, respectively. The highest decrease in EBVs of SFD was observed from 2006 to 2007 birth years, when the lowest value was between the years from 2010 to 2011 birth years. SFD characteristic of
SFD (mm) -0.00686 00002
SMD (mm) 0.00787 0.0178
BW = body weight, SFD = scanning fat depth, SMD = scanning muscle depth
s.e. = standard error
(2002) for Suffolk sheep and Johnson et al. (2014) for Texel sheep. The genetic trends for SFD were reported to be -0.06, --0.06, -0.04, -0.03, -0.01, -0.05 and -0.04 mm/year respectively for Danish Oxford Down, Danish Shrop Shire, Danish Leicester, Danish Texel, Danish Marsh, Danish Dorset and Danish Suffolk sheep breeds (Pedersen and Lauridsen 2014).
The mean EBVs of SMD for Karayaka lambs according to birth years are presented in Fig.3. There was an increase in the EBVs of SMD according to birth years from 2006 to 2011. The maximum increase was detected between 2008 and 2009 birth years, while the minimum increase between 2007 and 2008 birth years. The EBVs of SMD for 2006, 2007, 2008, 2009, 2010 and 2011 birth years were -0.0090 mm, -0.0063 mm, -0.0062 mm, 0.0173 mm, 0.0195 mm and 0.0259 mm, respectively. Genetic trends for SMD were defined with the regression of breeding values on birth years of Karayaka lambs. Irregular fluctuations were observed in breeding values for SMD. The genetic trend for SMD was estimated as 0.00787±0.0178 mm/year (Table 2) and this value was different from zero. The breeding values for SMD were negative in a couple of years (2006 to 2008) and the values were positive in others (2008 to 2011). Genetic trend for the slope identified in this study was smaller than the value reported by Clarke et al. (1998) for Landcorp lambs. A similar genetic trend was obtained by Kvame and Vangen (2007)and Milerski (2010) for Suffolk, Texel, Charollais, Romney and Oxford Down breeds. Similar results were also reported by Kvame and Vangen (2007) for Norwegian White sheep and by Simm et al. (2002) for Suffolk sheep. The genetic trends for SMD were reported to be 0.08, 0.04, 0.012, 0.03, 0.01, 0.02 and 0.03mm/year respectively for Danish Oxford Down, Danish Shrop Shire, Danish Leicester, Danish Texel, Danish Marsk, Danish Dorset and Danish Suffolk sheep breeds (Pedersen and Lauridsen 2014). The fluctuation in the mean EBV for SMD between 2006 and 2008 could be selection procedure practiced within the lambs and design of the experiment. A number of factors differed between the present study and an ideal selection program. For instance, the number of animals was relatively small in the beginning year of selection. On the other hand, only twin lambs were selected in a study by Larsgard and Kolstad (2003), which reduced the number of lambs available for selection even more. These comments are in agreement with the argument of Kvame and Vangen (2007).
CONCLUSION
Higher number of animals should be included and scanned through to get more reliable and accur ate parameters. Selection response for BW, SMD and SFD
should be assessed for longer durations to make more accurate statements about the response to selection. As a conclusion, it can be stated that the breeding values for BW could be used in sheep breeding programs and present findings could reliably be used in genetic evaluation of Karayaka lambs in Turkey. The ultrasound procedure is a valuable device for genetic measuring carcass meat, fat and muscle ratio of Karayaka lambs.
ACKNOWLEDGEMENT
The authors wish to thank The Scientific and Technological Research Council of Turkey “TÜBİTAK” (Project number: 104O329) and General Directorate of Agricultural Research and Policy of Turkey (Project number: 60KYK2005-01) for their financial support for the present research.
REFERENCES
Aksoy, Y., Ulutas, Z., Sen, U., Sirin, E. and Sahin, A. (2016). Estimates of genetic parameters for different body weights and muscle and fat depths of Karayaka lambs. Turkish Journal of Veterinary and Animal Sciences, 40: 13-20.
Clarke, J.N., Nicoll, G.B. and Mowat, C.M. (1998). Genetic parameters for live weight and live animal ultra-sound fat and eye muscle dimensions in a synthetic terminal sire breed. Proceedings of the New Zealand Society of Animal Production, 5: 140-142 Gilmour, A.R., Cullis, B.R., Welham, S.J. and Thompson, R. (1998). ASReml (ASREML) User Guide, Release 2.0. Orange, Australia:
NBW Agriculture.
Johnson, P.L., Blair, H.T., Davidson, L., Amer, P.R. and McEwan, J.C. (2014). Genetic trends in the New Zealand Texel. Proceedings of
the Association for the Advancement of Animal Breeding and Genetics, 14: 107–110
Khan, K.M., Kumar, N., Chakraborty, D., Isfaq, F., Rajan, S., Bhatt, S.N., Kumar, D. and Taggar, R.K. (2017). Phenotypic characterization of Purky sheep population of Kargil district. Indian Journal of Animal Research, 51 (4): 625–629.
Khan, N.N., Kumar, N., Das, A.K., Chakraborty, D., Taggar, R.K., Gupta, P. (2015). Genetic studies on wool production traits in Rambouillet crossbred sheep in J & K State, India. Indian Journal of Animal Research, 49 (1): 40–43.
Kvame, T. and Vangen, O. (2007). Selection for lean weight based on ultrasound and CT in a meat line of sheep. Livestock Science, 106: 232–242.
Larsgard, A.G., Kolstad, K. (2003). Selection for ultrasonic muscle depth; direct and correlated response in a Norwegian experimental sheep flock. Small Ruminant Research, 48: 23–29
Malik, Z.S., Dalal, D.S., Patil, C.S. and Dahiya, S.P. (2017). Genetic studies on growth, reproduction and wool production traits in Harnali sheep. Indian Journal of Animal Research, 51 (5): 813–816.
Milerski, M. (2010). Ultrasound measurements of lamb loin muscle and back-fat depth in the Czech. Book of Abstracts of 59th Annual Meeting of EAAP, 16: 352.
Minitab for Windows (version 12.11) [Computer Program]. (1998). Available Distributor: Minitab Inc. 3081 Enterprise Drive State College, PA 16801-3008 USA.
Pedersen, J. and Lauridsen, J. (2014). Estimation of breeding values in Danish sheep breeding. https://www.landbrugsinfo.dk/Faar-og-geder/Avl-og-registrering/Sider/EBVsheep.pdf. (Access date: 05.01.2014).
Sen, U., Sirin, E., Ulutas, Z. and Kuran, M. (2011). Fattening performance, slaughter, carcass and meat quality traits of Karayaka lambs.
Tropical Animal Health and Production, 43: 409–416.
Simm, G., Lewis, R.M., Grundy, B. and Dingwall, W.S. (2002). Responses to selection for lean growth in sheep. Animal Science, 74: 39–50. Swatland, H., Ananthanarayanan, S. and Goldenberg, A. (1994). A review of probes and robots: implementing new technologies in meat
evaluation. Journal of Animal Science, 72: 1475–1486.
Turk Stat (Turkish Statistical Institute). (2015). Livestock Statistics. http://www.turkstat.gov.tr. (accessed December 27, 2015). Ulutas, Z., Aksoy, Y., Sirin, E. and Saatci, M. (2008). Introducing the Karayaka sheep breed with its traits and influencing factors. Pakistan
Journal of Biological Sciences, 11: 1051–1054.
Ulutas, Z., Sezer, M., Aksoy, Y., Sirin, E., Sen, U., Kuran, M. and Akbas, Y. (2010). The effect of birth types on growth curve parameters of Karayaka lambs. Journal of Animal and Veterinary Advances, 9: 1384–1388.