International Forum of Educational Technology & Society
Understanding University Students’ Thoughts and Practices about Digital Citizenship: A
Mixed Methods Study
Author(s): Nuri Kara
Source: Journal of Educational Technology & Society , Vol. 21, No. 1 (January 2018), pp.
172-185
Published by: International Forum of Educational Technology & Society
Stable URL: https://www.jstor.org/stable/10.2307/26273878
JSTOR is a not-for-profit service that helps scholars, researchers, and students discover, use, and build upon a wide range of content in a trusted digital archive. We use information technology and tools to increase productivity and facilitate new forms of scholarship. For more information about JSTOR, please contact [email protected].
Your use of the JSTOR archive indicates your acceptance of the Terms & Conditions of Use, available at https://about.jstor.org/terms
International Forum of Educational Technology & Society is collaborating with JSTOR to digitize, preserve and extend access to Journal of Educational Technology & Society
Kara, N. (2018). Understanding University Students’ Thoughts and Practices about Digital Citizenship: A Mixed Methods Study. Educational Technology & Society, 21 (1), 172–185.
Understanding University Students’ Thoughts and Practices about Digital
Citizenship: A Mixed Methods Study
Nuri Kara
Faculty of Communication, Istanbul Bilgi University, Turkey // [email protected]
ABSTRACT
The purpose of this study was to investigate university students’ thoughts and practices concerning digital citizenship. An explanatory mixed methods design was used, and it involved collecting qualitative data after a quantitative phase in order to follow up on the quantitative data in more depth. In the first quantitative phase of the study, a digital citizenship survey, including demographics and 5-point Likert scale questions, was conducted with 435 students of a private university. Factor analysis, descriptive statistics, and parametric test were used to analyze the data gathered by the survey. One of the important findings in the first phase was that university students do not prefer to engage in political activities online. The second qualitative phase was conducted to better understand the reasons behind university students’ thoughts and practices regarding digital citizenship. In this exploratory follow up, the data gathered in the first phase was tentatively explored with 10 students studying at the same university. Semi-structured interviews were conducted with the students and content analysis was used to analyze the data. Based on the findings, students indicated that they do not prefer to engage in political activities online because of emotional disturbance, pressure from society, and a fear of affecting their future lives in a negative way.
Keywords
Digital citizenship, University students, Mixed methods, Technology
Introduction
Digital citizenship has become a hot topic because of the mass use of information and communication technologies. Since younger generations spend most of their time with digital technologies, such as tablets and smartphones, there is a need to investigate digital citizenship (Hill, 2015). The integration of information technologies (IT) into people’s social and daily lives may contribute to digital citizenship practices. As Shelley et al. (2004) stated, IT helps citizens interact with government to accomplish their routine jobs. That is, citizens can conduct a variety of governmental tasks, such as paying taxes and traffic fines, through e-government applications (Simsek & Simsek, 2013). Online connection to services can be seen as a central point to perpetuate digital citizenship practices. The literature also supports that online access leads people to be involved in digital citizenship activities, such as online economic and political applications (Mossberger, Tolbert, & Hamilton, 2012).
There are several definitions for “digital citizenship.” The simple definition is that digital citizenship describes the norms of appropriate, responsible behavior with regard to technology (Ribble, 2008; Ribble, Bailey, & Ross, 2004). Gazi (2016) added the term “social” to the definition and defined it as “a socially constructed set of practices and the norms of behaviours where facilitates individual development and protects social values in digital society” (p. 139). Emejulu and McGregor (2016) also defined digital citizenship as “a reaction to technologies operating as disciplining devices compelling individuals and groups to adopt particular skills and ways of being in order to successfully exist in this newly and constantly disrupted world of work and leisure” (p. 3) According to Hollandsworth, Dowdy, and Donovan (2011), digital citizenship describes the electronic version of traditional society, in which people can trade, socialize, work, buy, entertain, and receive an education online. Ribble & Bailey (2004) identified nine areas that can be used to better understand digital citizenship: (1) Etiquette: Electronic standards of conduct or procedure, (2) Communication: Electronic exchange of information, (3) Education: The process of teaching and learning about technology and the use of technology, (4) Access: Full electronic participation in society, (5) Commerce: Electronic buying and selling of goods, (6) Responsibility: Electronic responsibility for actions and deeds, (7) Rights: Freedoms extended to everyone in a digital world, (8) Safety: Physical well-being in a digital technology world, (9) Security: Electronic precautions to guarantee safety. It can be inferred from these areas that the concept of digital citizenship covers terms from several fields, such as Psychology, Education, Technology, and Security.
The aim of this study is to understand university students’ thoughts and practices about digital citizenship. Studies on digital citizenship typically focus on K-12 students or teachers (Blevins, LeCompte, & Wells, 2014; Gazi, 2016; Hill, 2015; Hollandsworth et al., 2011; Ribble, 2008; Ribble, 2012; Ribble & Bailey, 2004; Ribble et al., 2004; Richards, 2010). Ribble et al. (2004) provide nine areas of digital citizenship and suggest several strategies for teachers to help K-12 students by using emerging technologies in an appropriate way. Richards (2010) wrote a conceptual paper exploring the potential of Web 2.0 tools, which can be used for middle school
educators to improve digital citizenship understanding and experiences of students. Hollandsworth et al. (2011) created a discussion paper focusing on the experiences of various practitioners and experts to help K-12 students become better digital citizens. Blevins et al. (2014) conducted a mixed methods study exploring the impact of an online civics education gaming program. The participants of the study were K-12 students and teachers. Hill (2015) conducted a descriptive study with a follow-up survey exploring a virtual, 3D-gaming environment, which was designed and built by fifth grade students to help them learn digital citizenship and information literacy. Gazi (2016) employed a qualitative case study to investigate high school students’ and teachers’ perceptions and awareness of digital citizenship. Since there has been limited digital citizenship-based research studies including university students, this study aims to fill this gap in the literature. As a conceptual framework, this study is based on four categories: Digital citizenship as Ethics, Media and Information Literacy (MIL), Participation/Engagement (P/E), and Critical Resistance (CR) (Choi, 2016). Digital citizenship as ethics refers to appropriate and responsible behaviors on the Internet (Choi, 2016; Ribble, 2012; Ribble, 2008; Ribble & Bailey, 2004; Ribble et al., 2004). Digital citizenship as MIL refers to handling and manipulating information and online communication (Choi, 2016; Mossberger et al., 2012; Simsek & Simsek, 2013). Digital citizenship as P/E refers to political, social, economic, and cultural participation in terms of online engagement (Choi, 2016; Crowe, 2006). Digital citizenship as CR “pursues more creative, innovative, non-linear, and non-hierarchal forms of participation, potentially leading to a deeper level of digital engagement” (Choi, 2016, p. 581). The main research questions of this study are presented below.
What are the factors affecting university students’ thoughts and practices regarding digital citizenship? What are the effects of gender, major, daily Internet use, devices used for Internet access, and following
e-government services on university students’ thoughts and practices regarding digital citizenship?
How do the factors affect university students’ thoughts and practices regarding digital citizenship?
Method
To answer the research questions, a mixed-methods approach was used to effectively understand the research problem by combining quantitative and qualitative inquiries (Creswell, 2014). The mixed methods sequential explanatory design consists of two distinct phases: Quantitative followed by qualitative (Creswell & Plano Clark, 2007; Creswell, Plano Clark, Gutmann, & Hanson, 2003). In this design, the researcher first collected and analyzed the quantitative data to produce statistical and numeric results. The qualitative data was collected and analyzed second in the sequence and helped explain, or elaborate, on the quantitative results obtained during the first phase. The second, qualitative phase built on the first, quantitative phase, and the two phases were connected while presenting the results and discussing them. The mixed methods sequential explanatory design allowed the researcher to better understand the reasons behind factors affecting university students’ thoughts and practices about digital citizenship by exploring participants’ views in more depth (Creswell & Plano Clark, 2007).
Quantitative phase
Participants
435 undergraduate students studying at a private university served as the participants of this study. After getting the required ethical form, the survey was administered to the university students and they voluntarily participated the study. This study was conducted during the Fall semester of 2016 – 2017. The mean age of the participants was 21.55. There were 238 females and 197 males. Most of the students’ major was Education (n = 219, 50.3%). The average of daily Internet use was around 6 hours. Nearly all of the students had access to the Internet via smartphones (n = 410, 94.3%). More than half of the students followed e-government services regularly (n = 244, 56.1%). Table 1 shows the detailed demographics of the participants.
Table 1. Demographics of participants
Demographics n % Gender Female 238 54.7 Male 197 45.3 Major Education Sciences 219 50.3
Applied Sciences (Engineering, Pharmacy, Architecture, Health) 134 30.9
Communication, Politics, Law) Daily Internet Use
0-2 hours 55 12.6 2-4 hours 74 17 4-6 hours 98 22.5 6-8 hours 65 14.9 8-10 hours 60 13.8 10 hours or more 83 19.1
Devices Used to Access the Internet
Smartphone 410 94.7 Laptop/Netbook 208 48 Desktop computer 37 8.5 Tablet PC 28 6.5 E-government Services Following regularly 244 56.5 Not Following 188 43.5 Data collection
For the quantitative phase, the survey method was applied. According to Fraenkel and Wallen (2006), implementing a survey is an effective way to understand the population’s common characteristics. As a survey instrument, The Digital Citizenship Scale (DCS), developed by Choi, Glassman, and Cristol (2017), was adapted for the current study. The scale included 26 items, and the items in the DCS were constructed based on the elements of the four categories that served as the basis for the conceptual framework of this study: Ethics, Media and Information Literacy, Participation/Engagement, and Critical Resistance (Choi et al., 2017).
A 5-point Likert-type scale was implemented in this study, although the original DCS scale was a 7-point Likert scale. The reason for this change was to increase the understandability of the scale, because students are more familiar with the 5-point Likert-type scale. After converting the scale, the language of the scale was translated into Turkish. To maintain the validity of the survey, the scale was reviewed by two experts, one from the Department of English Language Learning and one expert from the Department of Instructional Technology. After making the necessary revisions, the final version of the DCS scale, including 26 items with a 5-point Likert-type scale, was submitted to the participants. For reliability, Cronbach’s alpha for all the items was 0.88 for the original scale. Researchers also provided the construct validity of the scale (Choi et al., 2017). Cronbach’s alpha for all items was 0.89 in the current study.
Apart from the DCS scale, the instrument also included the demographic information of the participants. For the demographic information, gender, age, major, daily Internet use, purpose of using the Internet, devices used for online access, and following e-government applications were covered.
Data analysis
Both descriptive and inferential statistics were applied to analyze the survey data. The software of SPSS Statistics 20 was used to perform the necessary analyses. Factor analysis was conducted to reveal factors based on the data retrieved from the DCS scale. Mean scores and frequencies were used to understand the descriptives of the data. T-test and ANOVA were also performed to compare the groups to yield statistical results. Only meaningful statistical results of T-test and ANOVA were provided to see the effects of gender, major, daily Internet use, devices used for Internet access, and following e-government services on the digital citizenship factors.
Qualitative phase
The follow-up step of the explanatory sequential mixed-method design was the qualitative phase. After analyzing the data gathered in the quantitative phase, the qualitative phase was performed to better understand the statistical results (Creswell, 2014). Semi-structured interviews were conducted to better understand the factors affecting university students’ thoughts and practices regarding digital citizenship.
Participants
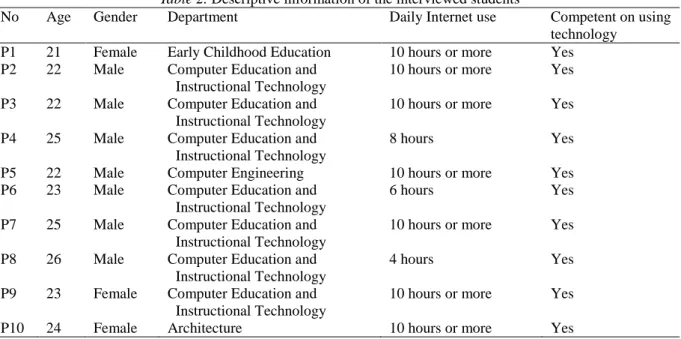
Purposeful sampling was applied to select the participants. As Patton (1990) indicated, purposeful sampling strengthens the study by including information-rich cases. Hence, 10 students who could give detailed answers to the questions and showed an interest in technology and the Internet were selected as participants. The majority of the students were from the Department of Computer Education and Instructional Technology. Three female and seven male students participated in the study. Most participants’ daily Internet use was more than 10 hours. All interviewed students declared their competency on using technology. This competency means being able to easily handle and fix the simple problems that occur while using a variety of technological devices, such as computers, tablets, and smartphones. Table 2 shows the demographic information of the participants.
Table 2. Descriptive information of the interviewed students
No Age Gender Department Daily Internet use Competent on using
technology
P1 21 Female Early Childhood Education 10 hours or more Yes
P2 22 Male Computer Education and
Instructional Technology
10 hours or more Yes
P3 22 Male Computer Education and
Instructional Technology
10 hours or more Yes
P4 25 Male Computer Education and
Instructional Technology
8 hours Yes
P5 22 Male Computer Engineering 10 hours or more Yes
P6 23 Male Computer Education and
Instructional Technology
6 hours Yes
P7 25 Male Computer Education and
Instructional Technology
10 hours or more Yes
P8 26 Male Computer Education and
Instructional Technology
4 hours Yes
P9 23 Female Computer Education and
Instructional Technology
10 hours or more Yes
P10 24 Female Architecture 10 hours or more Yes
Data collection
Semi-structured interviews were used to collect data during the qualitative phase. According to Brenner (2006), “a semi-structured protocol has the advantage of asking all informants the same core questions with the freedom to ask follow-up questions that build on the responses received” (p. 362). Since this qualitative phase was based upon the analysis results of the previous quantitative phase, an interview protocol was developed to better understand the specific points and factors. The interview protocol included two main parts, namely, demographic and content. In the demographic section, four questions were asked to determine students’ age, major, daily Internet use, and Internet activities. In the content section, 14 main questions were asked to students to understand their political, social, cultural, ethical, and collaborative activities in the context of digital citizenship. The interviews were conducted individually with participants in the office of the researcher. Participants attended the sessions voluntarily and a tape recorder was used with their permission. Interviews took 24 minutes on average.
Data analysis
For the analysis of data gathered via qualitative, semi-structured interviews, a content analysis technique was preferred. According to Krippendorff (2004), “in content analysis, data result from the procedures the researcher has chosen to answer specific questions concerning phenomena in the context of given texts” (p. 81). Similarly, Fraenkel and Wallen (2006) emphasized that content analysis allows researcher to derive meaning from written texts. Hence, in this study, tape-recorded interviews were transcribed to prepare them for qualitative analysis. Dey (1993) categorized qualitative analysis steps as reading and annotating, creating and assigning categories based on the coding process, splitting and linking data, and making connections. Based on these categories, the researcher read the interview transcripts carefully to fully understand the participants’ reflections. Then, the coding process was applied to find commonalities for the categories. These categories were put into related themes and meaningful connections were created based on these themes.
Results
Quantitative phase
Exploratory Factor Analysis (EFA)
Choi et al. (2017) found five factors based on the 26 items in the original DCS scale. The factors were Internet Political Activism, Technical Skills, Local/Global Awareness, Critical Perspective, and Networking Agency. An Exploratory Factor Analysis (EFA) was also conducted in this study to see whether the same factors appeared. Before conducting the EFA, the researched checked the KMO and Bartlett’s test. Since the KMO value was 0.87 and the p value of Bartlett’s test was 0.0, the EFA could be performed. For the extraction method, maximum likelihood, under the category of Common Factor Analysis, was preferred. As Preacher and MacCallum (2003) stated, “a factor’s success is gauged by how well it helps the researcher understand the sources of common variation underlying observed data” (p. 21). For the rotation technique, the Varimax method was preferred. Table 3 indicates the factor loadings. As presented in the study by Choi et al. (2017), five factors emerged based on the EFA. Compared with the original factor loadings, only 1 item loaded into a different factor.
Table 3. Summary of factor loadings for the 26-item scale
Factor loading
1 2 3 4 5
Factor 1: Internet Political Activism
I work or volunteer for a political party or candidate via online methods. .71
I regularly post thoughts related to political or social issues online. .71
I express my opinions online to challenge dominant perspectives or the status quo
with regard to political or social issues. .69
I belong to online groups that are involved in political or social issues. .64
I sometimes contact government officials about an issue that is important to me via
online methods. .64
I sign petitions about social, cultural, political, or economic issues online. .64
I organize petitions about social, cultural, political, or economic issues online. .60
I work with others online to solve local, national, or global issues. .58
I use the Internet in order to participate in social movement/change or protest. .49
I attend political meetings or public forums on local, town, or school affairs via
online methods. .45
Factor 2: Critical Perspective
I think online participation is an effective way to engage with political or social
issues. .62
I think I am given to rethink my beliefs regarding a particular issue/topic when I
use the Internet. .57
I think online participation promotes offline engagement. .54
I think online participation is an effective way to make a change to something I
believe to be unfair or unjust. .53
I think the Internet reflects the biases and dominance present in offline power
structures. .46
I am more socially or politically engaged when I am online than offline. .39
Factor 3: Technical Skills
I can use the Internet to find and download applications that are useful to me. .89
I can use the Internet to find information I need. .75
I am able to use digital technologies (e.g., mobile/smartphones, Tablet PCs,
Laptops, PCs) to achieve the goals I pursue. .64
I can access the Internet through digital technologies (e.g., mobile/smartphones,
Tablet PCs, Laptops, PCs) whenever I want. .53
Factor 4: Networking Agency
I enjoy communicating with others online. .70
I enjoy collaborating with others online more than I do offline. .50
Where possible, I comment on other people’s writing in news websites, blogs, or SNSs I visit.
.48 I post original messages, audio, pictures, or videos to express my
feelings/thoughts/ideas/opinions on the Internet.
.43
I am more aware of global issues through using the Internet. .82 I am more informed with regard to political or social issues through using the
Internet.
.76
Reliability analysis was conducted for each factor. The Cronbach’s alpha values were 0.88, 0.78, 0.80, 0.69, and 0.84 for Internet Political Activism, Critical Perspective, Technical Skills, Networking Agency, and Local/Global Awareness, respectively. Cronbach’s alpha for all items was 0.89. The following section reported statistical analysis for each factor.
Internet political activism
According to the findings presented in Table 4, the mean scores of the majority of items about Internet Political Activism were lower than 3. That is, university students, in general, do not prefer to engage in political activism on the Internet. 57.2% of university students do not work or volunteer for a political party or candidate on the Internet. More than half of the students (57.2%) do not belong to online political or social groups on the Internet. The findings also indicated that only 29% of university students contacted government officials online. An interesting finding based on the scores was related with petitions on the Internet. Although nearly half of the university students (45.7%) sign petitions for social, cultural, political, or economic causes online, only 24.4% of the students organize petitions online.
Table 4. Mean, frequencies and percentages of items for the factor of Internet Political Activism
Items for internet political activism Strongly
disagree
Disagree Undecided Agree Strongly
agree
Mean (SD) I work or volunteer for a political party or
candidate via online methods.
111 (25.6%) 137 (31.6%) 81 (18.7%) 80 (18.4%) 25 (5.8%) 2.47 (1.22) I regularly post thoughts related to political or
social issues online.
69 (15.9%) 115 (26.4%) 88 (20.2%) 124 (28.5%) 39 (9%) 2.88 (1.24) I express my opinions online to challenge
dominant perspectives or the status quo with regard to political or social issues.
58 (13.3%) 115 (26.4%) 82 (18.9%) 128 (29.4%) 52 (12%) 3 (1.25) I belong to online groups that are involved in
political or social issues.
101 (23.2%) 148 (34%) 59 (13.6%) 90 (20.7%) 37 (8.5%) 2.57 (1.28) I sometimes contact government officials
about an issue that is important to me via online methods. 80 (18.4%) 155 (35.7%) 73 (16.8%) 103 (23.7%) 23 (5.3%) 2.62 (1.18) I sign petitions about social, cultural,
political, or economic issues online.
58 (13.3%) 101 (23.2%) 77 (17.7%) 142 (32.6%) 57 (13.1%) 3.09 (1.27) I organize petitions about social, cultural,
political, or economic issues online.
73 (16.8%) 178 (41%) 77 (17.7%) 83 (19.1%) 23 (5.3%) 2.55 (1.14) I work with others online to solve local,
national, or global issues.
46 (10.6%) 168 (38.7%) 102 (23.5%) 98 (22.6%) 20 (4.6%) 2.72 (1.07) I use the Internet in order to participate in
social movement/change or protest.
105 (24.4%) 126 (29.2%) 95 (22%) 74 (17.2%) 31 (7.2%) 2.54 (1.23) I attend political meetings or public forums
on local, town, or school affairs via online methods. 57 (13.1%) 189 (43.4%) 79 (18.2%) 92 (21.1%) 18 (4.1%) 2.60 (1.09)
An independent samples t-test was used to compare the mean scores of Internet Political Activism for male and female university students. The results indicated that there was a statistically significant difference in the average mean score of Internet Political Activism between female (M = 2.62, SD = 0.85) and male (M = 2.80, SD = 0.81) university students (t (426) = -2.19, p < .05, r2 = .39). On average, Internet Political Activism scores of male university students were higher than females (see Table 5).
Table 5. Results of t-test for Internet Political Activism by Gender
Male Female
M SD n M SD n t df
Internet Political Activism 2.80 0.81 194 2.62 0.85 234 -2.19* 426
An independent samples t-test was used to compare the mean scores of Internet Political Activism for university students to determine whether they follow e-government services regularly. The results indicated that there was a statistically significant difference in the average mean score of Internet Political Activism between university students who follow e-government services regularly (M = 2.83, SD = 0.81) and those who do not (M = 2.54, SD = 0.84) (t (423) = 3.52, p < .05, r2 = .17). The Internet Political Activism scores of university students following e-government services regularly were higher than those who are not following e-government services regularly (see Table 6).
Table 6. Results of t-test for Internet Political Activism by e-Government Services
Following e-Government Services Regularly
Not Following e-Government Services Regularly
M SD n M SD n t df
Internet Political Activism 2.83 0.81 240 2.54 0.84 185 3.52* 423
Note. *p < .05.
Critical perspective
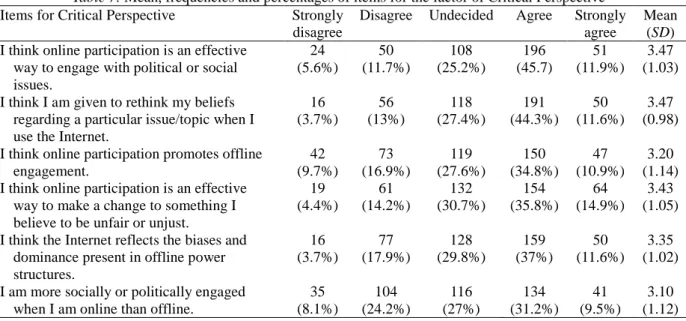
According to the findings presented in Table 7, the mean scores for all items relating to critical perspective were higher than 3. That is, university students, in general, have a critical perspective in terms of political and social issues on the Internet. For instance, 57.65% of university students believe in the effectiveness of engaging with political or social issues online. More than half of the students (55.9%) think that the Internet leads them to consider their beliefs. The findings also indicated that 50.7% of the students believe in the importance of the Internet in changing something which is unfair or unjust. One interesting finding related with the statistics was that nearly half of the university students (48.6%) believe the dominance of real-life power structures in online environments.
Table 7. Mean, frequencies and percentages of items for the factor of Critical Perspective
Items for Critical Perspective Strongly
disagree
Disagree Undecided Agree Strongly
agree
Mean (SD) I think online participation is an effective
way to engage with political or social issues. 24 (5.6%) 50 (11.7%) 108 (25.2%) 196 (45.7) 51 (11.9%) 3.47 (1.03) I think I am given to rethink my beliefs
regarding a particular issue/topic when I use the Internet.
16 (3.7%) 56 (13%) 118 (27.4%) 191 (44.3%) 50 (11.6%) 3.47 (0.98) I think online participation promotes offline
engagement. 42 (9.7%) 73 (16.9%) 119 (27.6%) 150 (34.8%) 47 (10.9%) 3.20 (1.14) I think online participation is an effective
way to make a change to something I believe to be unfair or unjust.
19 (4.4%) 61 (14.2%) 132 (30.7%) 154 (35.8%) 64 (14.9%) 3.43 (1.05) I think the Internet reflects the biases and
dominance present in offline power structures. 16 (3.7%) 77 (17.9%) 128 (29.8%) 159 (37%) 50 (11.6%) 3.35 (1.02) I am more socially or politically engaged
when I am online than offline.
35 (8.1%) 104 (24.2%) 116 (27%) 134 (31.2%) 41 (9.5%) 3.10 (1.12) An independent samples t-test was used to compare the mean scores of Critical Perspective for university students to determine whether they follow e-government services regularly. The results indicated that there was a statistically significant difference in the average mean score of Critical Perspective between university students who follow e-government services regularly (M = 3.46, SD = 0.69) and those who do not (M = 3.18, SD = 0.74)
(t (422) = 4.07, p < .05, r2 = .19). The Critical Perspective scores of university students following e-government
services regularly were higher than those who do not follow e-government services regularly (see Table 8).
Table 8. Results of t-test for Critical Perspective by e-Government Services
Following e-Government Services Regularly
Not Following e-Government Services Regularly
M SD n M SD n t df
Critical Perspective 3.46 0.69 239 3.18 0.74 185 4.07* 422
Technical skills
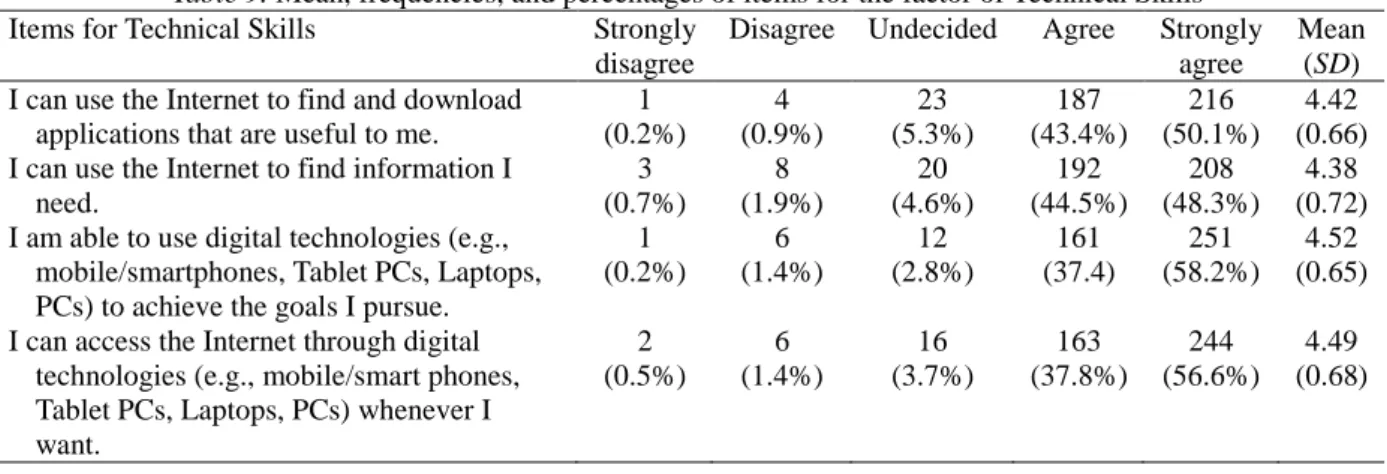
According to the findings presented in Table 9, the mean scores of all items relating to technical skills were higher than 4. That is, the majority of university students are good at using digital technologies. For instance, 93.5% of the students can connect to the Internet to find and download applications. In addition, 95.6% of the students are able to use digital technologies, such as smartphones, tablets, and laptops.
Table 9. Mean, frequencies, and percentages of items for the factor of Technical Skills
Items for Technical Skills Strongly
disagree
Disagree Undecided Agree Strongly
agree
Mean (SD) I can use the Internet to find and download
applications that are useful to me.
1 (0.2%) 4 (0.9%) 23 (5.3%) 187 (43.4%) 216 (50.1%) 4.42 (0.66) I can use the Internet to find information I
need. 3 (0.7%) 8 (1.9%) 20 (4.6%) 192 (44.5%) 208 (48.3%) 4.38 (0.72) I am able to use digital technologies (e.g.,
mobile/smartphones, Tablet PCs, Laptops, PCs) to achieve the goals I pursue.
1 (0.2%) 6 (1.4%) 12 (2.8%) 161 (37.4) 251 (58.2%) 4.52 (0.65) I can access the Internet through digital
technologies (e.g., mobile/smart phones, Tablet PCs, Laptops, PCs) whenever I want. 2 (0.5%) 6 (1.4%) 16 (3.7%) 163 (37.8%) 244 (56.6%) 4.49 (0.68) Networking agency
According to the findings presented in Table 10, the mean scores of the majority of items related to networking agency were higher than 3. That is, most of the university students prefer attending collaborative and social activities on the Internet. For instance, 73.7% of the students enjoy communicating with other people online. Additionally, 60.9% of the students react to other people’s posts in online environments. 61.8% of the students also post messages, audio, videos, etc. to express themselves. Based on the statistics, it was found that only 23% of the students enjoy collaborating with others online more than they do offline. It can be inferred from this finding that, university students, in general, prefer real-life collaborations supported with online collaboration.
Table 10. Mean, frequencies, and percentages of items for the factor of Networking Agency
Items for Networking Agency Strongly
disagree
Disagree Undecided Agree Strongly
agree
Mean (SD)
I enjoy communicating with others online. 17
(4%) 37 (8.7%) 58 (13.6%) 210 (49.3%) 104 (24.4%) 3.81 (1.03) I enjoy collaborating with others online more
than I do offline. 79 (18.5%) 146 (34.3%) 103 (24.2%) 56 (13.1%) 42 (9.9%) 2.62 (1.21) Where possible, I comment on other people’s
writings in news websites, blogs, or SNSs I visit. 22 (5.2%) 65 (15.2%) 80 (18.7%) 180 (42.2%) 80 (18.7%) 3.54 (1.11) I post original messages, audio, pictures, or
videos to express my feelings / thoughts / ideas / opinions on the Internet.
33 (7.7%) 67 (15.7%) 63 (14.8%) 178 (41.7%) 86 (20.1%) 3.51 (1.20)
Table 11. Summary of ANOVA
Source Sum of squares df Mean square F
Daily internet use 12.88 5 2.58 3.97*
Error 272.26 419 0.65
Total 285.14 424 4.98
Note. *p < .05.
One way analysis of variance was conducted to examine the effect of daily Internet use on the mean scores of Networking Agency. The independent variable, daily Internet use, included six levels: 0-2 hours, 2-4 hours, 4-6 hours, 6-8 hours, 8-10 hours, and 10 hours or more. The dependent variable was the mean scores of the Networking Agency factor. The ANOVA was significant, F(5, 419) = 3.97, p = .002. Post-hoc comparisons using the Tukey HSD test indicated that the mean score for the group of 10 hours or more (Md = 3.58, SD = 0.83) was
significantly different from the group of 0-2 hours (Md = 3.05, SD = 0.92) and the group of 2-4 hours (Md = 3.19,
SD = 0.87) (see Table 11).
Local/Global awareness
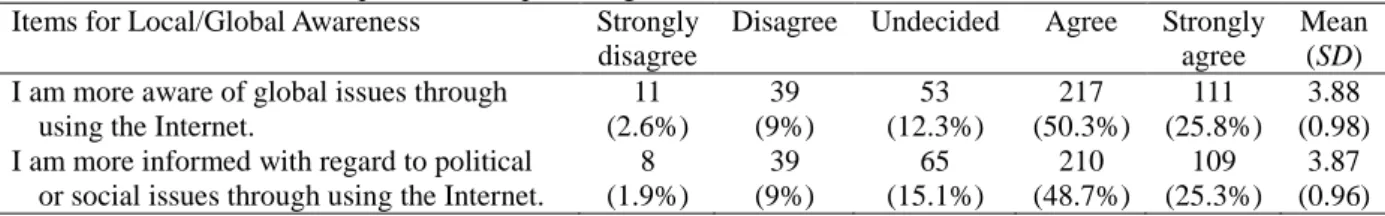
According to the findings presented in Table 12, the mean scores of all items related to local/global awareness were higher than 3. That is, the majority of university students use the Internet to get information and stay aware of local and global issues. For instance, 76.1% of the students are more aware of global issues through using the Internet. Additionally, 74% of the students are more informed with regard to political or social issues through using the Internet.
Table 12. Mean, frequencies, and percentages of items for the factor of Local/Global Awareness
Items for Local/Global Awareness Strongly
disagree
Disagree Undecided Agree Strongly
agree
Mean (SD) I am more aware of global issues through
using the Internet.
11 (2.6%) 39 (9%) 53 (12.3%) 217 (50.3%) 111 (25.8%) 3.88 (0.98) I am more informed with regard to political
or social issues through using the Internet.
8 (1.9%) 39 (9%) 65 (15.1%) 210 (48.7%) 109 (25.3%) 3.87 (0.96) An independent-samples t-test was used to compare the mean scores of Local/Global Awareness for university students to determine whether they follow e-government services regularly. The results indicated that there was a statistically significant difference in the average mean score of Local/Global Awareness between university students who follow e-government services regularly (M = 4.06, SD = 0.83) and those who do not (M = 3.62, SD
= 0.94) (t (370) = 5.11, p < .05, r2 = .24). The Local/Global Awareness scores of university students following
e-government services regularly were higher than those who do not follow e-e-government services regularly (see Table 13).
Table 13. Results of t-test for Local/Global Awareness by e-Government Services
Following e-Government Services Regularly
Not Following e-Government Services Regularly
M SD n M SD n t df
Local/Global Awareness 4.06 0.83 242 3.62 0.94 186 5.11* 370
Note. *p < .05.
Qualitative phase
Semi-structured interviews were conducted with 10 university students to better understand the results analyzed via quantitative techniques. 8 out of 10 students had not heard the term “digital citizenship” before. When asked about the meaning of digital citizenship, the majority of students described the idea of people’s online identities. Eight main digital citizenship-related themes emerged by conducting content analysis of the interview transcripts. These themes were:
Using Online Services
Political Activities on the Internet
Social and Cultural Activities on the Internet Ethical and Moral Issues on the Internet Safety on the Internet
Networking Activities on the Internet Digital Rights on the Internet
Advantages and Disadvantages of Digital Citizenship
Using online services
Survey results indicated that social media is the most preferred online activity of university students. Qualitative findings confirmed that the interviewed students spend most of their time using social media applications, such as Facebook, Instagram, and Twitter. Based on the survey results, 56.5% of university students follow e-government services regularly. The qualitative findings showed that 7 out of 10 students follow e-e-government services. For instance, one student stated:
“I check my military and student status, use vehicle services, and register my IMEI number on the e-government Web portal” (P2).
Qualitative findings also pointed out that 9 out of 10 students use at least one online service, such as online shopping, online banking, and online appointment systems.
Political activities on the Internet
Quantitative findings showed that university students, in general, do not prefer being involved with political activism on the Internet. Content analysis in qualitative phase found out why university students hesitate to attend political activities on the Internet. First, 4 out of 10 students indicated that they feel uncomfortable with online political activities. For example, one student stated:
“Everyone supports their own ideology or political party on the Internet. Hence, politics can lead people to
argue and use bad words. Since I believe in equality, these political arguments make me feel uncomfortable”
(P1).
Secondly, another reason for not participating in online political activities was related to the fear of it affecting their future lives. 7 out of 10 students mentioned this fear. For instance, one student explained it as follow:
“I may have problems if I express my political views on the Internet. I would like to become an academic in future, so these political posts may harm my career” (P8).
The last finding related with the reasons for not participating in online political activities was related to pressure from society. More than half of the students mentioned this pressure when discussing political activities on the Internet. For instance, one student stated:
“People cannot freely share their political views online because of the pressure. If they share or support opposing views, they may have problems” (P5).
Social and cultural activities on the Internet
Based on the statistical findings, nearly half of the university students (45.7%) have signed online petitions related to social, cultural, political, or economic issues. The qualitative phase elaborated on this finding by concluding that all of the university students sign petitions that are useful for people. Students emphasized petitions relating to social issues rather than political ones. For instance, one student said:
“I sign petitions which can be helpful for people. These petitions can create social pressure on organizations. I signed a petition about protesting a thermal power station because it can damage people’s health” (P4). In addition, survey results indicated that the majority of students are more aware of global issues and informed with regard to political or social issues through using the Internet. Similar to these findings, interview results revealed that nearly all of the students support social actions to improve the awareness of people. However, more than half of the students are not sure whether social actions on the Internet work or not. For example, one student stated:
“I participate in social actions and support social organizations online, but I don’t believe that it works because I have not seen any positive results yet” (P3).
The last finding was about cultural exchange. All of the university students support finding information about other cultures and sharing cultural posts through online methods.
Ethical and moral issues on the Internet
Another topic related with digital citizenship practices concerned ethical and moral issues. Based on the interview results, all of the students indicated that there is a need for ethical and moral values on the Internet, because people do not follow these values. Additionally, more than half of the students emphasized that there should be limitations or filtering of information on the Internet. Although 2 out of 10 students consider downloading unregistered copies of products as an unethical behavior, the majority of students see themselves as following ethical rules because they respect others and do not swear on the Internet. Lastly, 4 out of 10 students supported engaging in discussions about laws that affect people’s lives on the Internet. For instance, one student stated:
“People can criticize others on the Internet, but they do not have a right to swear or harass others. Additionally, we should have extended rights on the Internet. That’s why laws, valid in real life, should be discussed on the Internet” (P7).
Safety on the Internet
According to all of the university students, there is a need for safety on the Internet, because the Internet and social media are not secure. Safety can be a problem affecting their online engagement. Students use several strategies to keep themselves secure in online environments. All of the students emphasized that they use popular or well-known websites for online shopping or other e-services. Additionally, keeping information on Facebook private and checking for https icons or green-colored browser icons are the other strategies.
Networking activities on the Internet
Based on the quantitative results, most of the university students prefer participating in collaborative and social activities on the Internet. 73.7% of the students enjoy communicating with other people online. Interview results supported this finding that the Internet is useful for collaboration and communication. For instance, one student stated:
“I find the Internet useful because I can communicate with my friend in Germany. I can also get the latest news via the Internet” (P10).
Based on the statistics, one interesting finding was that only 23% of the students enjoy collaborating with others online more than they do offline. Half of the interviewed students explained that they communicate online with people they have met offline. It can be inferred from this finding that university students place importance on real-world collaboration. Quantitative results also showed that nearly 60% of the university students make comments and posts on the Internet. Interview results indicated that 7 out of 10 students share personal posts and use Facebook and WhatsApp groups to communicate and make comments on others’ posts. For example, one student said:
“We have a WhatsApp group to communicate with friends from the department. I generally post personal things, such as pictures of places I’m visiting, songs, or animations that I like” (P6).
Digital rights on the Internet
4 out of 10 students stated that people are not aware of their rights on the Internet. Additionally, students emphasized that they block people who show disrespectful behavior online. Moreover, students prefer penalizing people who do not respect others online rather than taking them to court. Lastly, the majority of students support an online governmental institution for maintaining the rights of people. For example, one student emphasized:
“I would like to complain about people to an online government institution if they steal my private information” (P3).
Advantages and disadvantages of digital citizenship
For the advantages, all of the students stated that online services make people’s life easier and enhance time management. For instance, one student said:
“I can pay taxes and tuition through the Internet. I do not need to go to institutions in person. This is very convenient for me, because I do not have to go out. It also saves my time” (P4).
For the disadvantages, more than half of the students mentioned that online services make people lazy and antisocial. They also emphasized their concerns about safety on the Internet.
Discussion
An explanatory mixed-method design was used to understand university students’ thoughts and practices regarding digital citizenship. Based on the descriptive statistics, 94.7% of university students use smartphones to access the Internet and nearly half of them are online at least 6 hours a day. As Mossberger et al. (2012) stated, young people prefer smartphones for Internet access because of their portability, popularity, and simplicity.
Survey results indicated that university students do not prefer to engage in political activities on the Internet. Qualitative results also explained the reasons for not participating in online political activities as feeling discomfort, fear of affecting their future lives, and pressure from society. This can be linked to the finding that less educated people tend to engage in online political activity more than highly educated people (Chatur, 2011). The results can also be linked to the interests of university students because young people’s interest and commitment to the news and politics is very limited (D'Haenens, Koeman, & Saeys, 2007).
For Internet political activism, gender produced significant statistical results. Based on the findings, male university students are more politically active than female students on the Internet. This is similar to the finding that men tend to create posts about politics on social media more than women (Bode, 2017). Findings also indicated that following e-government services has significant effects on the factors of Internet political activism, critical perspective, and local/global awareness. The scores of university students following e-government services regularly are higher than those who are not. It can be inferred from this finding that the university students using e-government services regularly tend to be more active than other students in political and social issues on the Internet. Based on the statistics, only 40.7% of university students stated that they are more socially or politically engaged when they are online than offline. In addition, only 23% of students said that they enjoy collaborating with others online more than they do offline. Qualitative results showed that university students communicate online with people they have met offline. It can be inferred from these findings that university students see online communication or engagement as a support mechanism for offline engagement. Similarly, Chatur (2011) found out that people involved in offline participation are more likely to be engaged in online activities.
According to the quantitative findings, daily Internet use has significant statistical effect on the Networking Agency factor. The university students whose daily Internet use is at least 10 hours are more socially active on the Internet than students who use the Internet for a maximum of 4 hours a day. It can be understood from this finding that students spend a vast amount of time on the Internet for engaging in online activities, such as commenting, posting, and communicating. Quantitative results also revealed that the majority of university students prefer participating in collaborative and social activities on the Internet. Qualitative interview results proved that students use the Internet for collaborative and communicative purposes. They also communicate via social media groups and share personal posts, in general. Similarly, D’Haenens et al. (2007) described young people as e-communicating citizens, because they mostly use email and chatting on the Internet. Based on the survey results, the majority of university students use the Internet to get information and become more aware of local and global issues. To support this finding, most of the students mentioned cultural exchange on the Internet. This can be linked to the view that social involvement should be provided in online environments to make people informed and access to digital world (Missingham, 2009). According to the views of participants, most of the students are not aware of the term digital citizenship. Although they use online services and have some level of awareness on ethical, moral, safety issues, and digital rights, most of them can only define digital citizenship as a person’s identity on the Internet. Since the majority of interview participants were from the Department of Education, this lack of awareness about what digital citizenship is can be linked to the finding that teachers are not totally aware of digital citizenship (Gazi, 2016; Hollandsworth et al., 2011). Based on the statistics and qualitative results of this study, students are closely engaged in digital environments, especially social media. Hence, improving the awareness of digital citizenship can be seen as an important goal of education (Choi, 2016).
Conclusion
University students’ thoughts and practices concerning digital citizenship were investigated via mixed methods. Quantitative results indicated that university students’ online political activism is low while their online critical thinking, technical skills, networking, and local/global awareness are relatively high. Results also showed that students prefer collaborative activities with an element of Internet usage. Additionally, students following e-government services regularly are more engaged in online political activities. These students also show more critical perspectives and have local/global awareness than students who do not follow e-government services regularly. Another finding was that male university students prefer to participate in online political activities more than females.
The qualitative phase was conducted to better understand and explain the quantitative findings. Based on the qualitative results, university students are comfortable with using online services like online shopping and e-government. They prefer not to participate in online political activities because of discomfort, pressure from society, and fear of future ramifications on their lives. They support signing petitions and social actions to
improve awareness about human needs. They believe that ethical and moral values should be integrated into online environments because people, in general, do not follow these values. They emphasized that there is a need for safety on the Internet because the Internet and social media are not secure. The qualitative results showed that university students prefer to attend online collaborative and social activities, share personal posts, and use online groups to communicate with each other. Students also pointed out that they can penalize their peers online, and they believe a governmental institution should be established to preserve the rights of people on the Internet. The last qualitative result was that university students consider digital citizenship practices useful in terms of effective time management and making life easier, while they are also aware of the disadvantages, such as concerns about safety and increased antisocial behavior.
The term “digital citizenship” can be integrated into the content of several courses to improve the awareness of university students. Additionally, the results can be guide for researchers to investigate the practices and thoughts of university students related to online environments. Lastly, future studies can be conducted to deeply analyze students’ digital citizenship practices.
This study also has limitations. First, interviews were conducted only with a small number of students. Secondly, all the students who participated in this study were selected from a private university. Finally, the researcher was the main person doing all the transcriptions and data analysis.
References
Blevins, B., LeCompte, K., & Wells, S. (2014). Citizenship education goes digital. The Journal of Social Studies Research, 38(1), 33-44.
Bode, L. (2017). Closing the gap: Gender parity in political engagement on social media. Information, Communication & Society, 20(4), 587-603.
Brenner, M. E. (2006). Interviewing in educational research. In J. L. Green, G. Camilli, & P. B. Elmore (Eds.), Handbook of complementary methods in education research (pp. 357–370). Mahwah, NJ: Lawrence Erlbaum.
Chatur, N. (2011). Political outcomes of digital conversations: A case study of the facebook group “Canadians against proroguing parliament” (Unpublished doctoral dissertation). University of Lethbridge, Lethbridge, AB.
Choi, M. (2016). A concept analysis of digital citizenship for democratic citizenship education in the internet age. Theory & Research in Social Education, 44(4), 565-607.
Choi, M., Glassman, M., & Cristol, D. (2017). What it means to be a citizen in the internet age: Development of a reliable and valid digital citizenship scale. Computers & Education, 107, 100-112.
Creswell, J. W. (2014). Research design: Qualitative, quantitative, and mixed methods approaches (4th ed.). Thousand Oaks, CA: Sage.
Creswell, J. W., & Plano Clark, V. L. (2007). Designing and conducting mixed methods research. Thousand Oaks, CA: Sage. Creswell, J. W., Plano Clark, V. L., Gutmann, M. L., & Hanson, W. E. (2003). Advanced mixed methods research designs. In A. Tashakkori & C. Teddlie (Eds.,), Handbook of mixed methods in social and behavioral research (pp. 209-240). Thousand Oaks, CA: Sage.
Crowe, A. R. (2006). Technology, citizenship, and the social studies classroom: Education for democracy in a technological age. International Journal of Social Education, 21(1), 111-121.
Dey, I. (1993). Qualitative data analysis: A user friendly guide for social scientists. London, UK: Routledge.
D’Haenens, L., Koeman, J., & Saeys, F. (2007). Digital citizenship among ethnic minority youths in the Netherlands and Flanders. New Media & Society, 9(2), 278-299.
Emejulu, A., & McGregor, C. (2016). Towards a radical digital citizenship in digital education. Critical Studies in Education, 1-17.
Fraenkel, J. R., & Wallen, N. E. (2006). How to design and evaluate research in education (6th ed.). New York, NY: McGraw-Hill.
Gazi, Z. A. (2016). Internalization of digital citizenship for the future of all levels of education. Education and Science, 41(186), 137-148.
Hollandsworth, R., Dowdy, L., & Donovan, J. (2011). Digital citizenship in K-12: It takes a village. TechTrends, 55(4), 37-47.
Krippendorff, K. (2004). Content analysis: An introduction to its methodology (2nd ed.). London, UK: Sage.
Missingham, R. (2009). Encouraging the digital economy and digital citizenship. The Australian Library Journal, 58(4), 386-399.
Mossberger, K., Tolbert, C. J., & Hamilton, A. (2012). Broadband adoption measuring digital citizenship: Mobile access and broadband. International Journal of Communication, 6, 2492-2528.
Patton, M. Q. (1990). Qualitative evaluation and research methods (2nd ed.). Newbury Park, CA: Sage.
Preacher, K. J., & MacCallum, R. C. (2003). Repairing Tom Swift’s electric factor analysis machine. Understanding Statistics, 2, 13–32.
Ribble, M. (2012). Digital citizenship for educational change. Kappa Delta Pi Record, 48(4), 148-151. Ribble, M. (2008). Passport to digital citizenship. Learning & Leading with Technology, 36(4), 14-17.
Ribble, M. S., & Bailey, G. D. (2004). Digital citizenship focus questions for implementation. Learning & Leading with Technology, 32(2), 12-15.
Ribble, M. S., Bailey, G. D., & Ross, T. W. (2004). Digital citizenship: Addressing appropriate technology behavior. Learning & Leading with Technology, 32(1), 7-12.
Richards, R. (2010). Digital citizenship and web 2.0 tools. Journal of Online Learning and Teaching, 6(2), 516-522.
Shelley, M., Thrane, L., Shulman, S., Lang, E., Beisser, S., Larson, T., & Mutiti, J. (2004). Digital citizenship: Parameters of the digital divide. Social Science Computer Review, 22(2), 256-269.
Simsek, E., & Simsek, A. (2013). New literacies for digital citizenship. Contemporary Educational Technology, 4(2), 126-137.