International Journal of
Intelligent Systems and Applications in Engineering
ISSN:2147-67992147-6799 www.ijisae.org Original Research Paper
International Journal of Intelligent Systems and Applications in Engineering IJISAE, 2017, 5(4), 252-255 |252
Training Product-Unit Neural Networks with Cuckoo Optimization
Algorithm for Classification
Humar KAHRAMANLI
1*DOI: 10.1039/b0000
Accepted : 23/10/2017 Published: 30/12/2017
Abstract: In this study Product-Unit Neural Networks (PUNN) which is the special class of feed-forward neural network has been trained using Cuckoo Optimization algorithm. The trained model has been applied to two classification problems. BUPA liver disorders and Haberman's Survival Data have been used for application. The both data have been obtained from UCI machine Learning Repository. For comparison, Backpropagation (BP) and Levenberg–Marquardt (LM) algorithms have been used. Classification accuracy, sensitivity, specificity and F1 score have been used as statistics to evaluate the success of algorithms. The application results show that the PUNN trained with Cuckoo Optimization algorithm is achieved better classification accuracy, sensitivity, specificity and F1 score.
Keywords: Artificial Neural Network (ANN), Classification, Backpropagation (BP), Levenberg–Marquardt (LM), Cuckoo algorithm,
Product-Unit Neural Networks (PUNN).
1. Introduction
Artificial neural network (ANN) is a mathematical model which was inspired from the biological neural networks. ANN is an artificial intelligent model that utilizes information coming from different nodes known as neurons in this model [1]. ANNs are very helpful to solve complex problems. They also show good performances on analysing non-linear systems. ANNs have been applied over a wide range of fields for modelling and predicting. The reason why the ANN is frequently used is presenting some properties such as learning from examples and showing some ability for generalization beyond the training data [2].
A Product unit neural network (PUNN) a special type of an artificial neural network. PUNNs are an alternative to classical neural networks. In PUNNs, additive nodes were replaced by multiplicative ones. [3].
PUNNs have a number of advantages. • They have great predictive power.
• They are a product network allows for simplification. • They enable insight in relation between inputs and
outputs.
• They are transportable [4].
Guerrero-Enamorado and Ceballos-Gastell [5] intended aims to obtain empirical information about the behavior of an Evolutionary Product-Unit Neural Network (EPUNN). In the application part they used 21 data….sonra hangi fiil olacak 21 data sets for the classification task, eleven noisy data sets, sixteen imbalanced data sets, and ten missing values data sets. Hervás et al. [3] proposed a classification method based on product-unit neural networks. They applied an evolutionary algorithm to specify the structure of PUNN and to estimate the model’s coefficients. Zhang et al. [6] investigated the convergence of BP algorithm for PUNN. Martı´nez-Estudillo et al. [7] presented a model of evolution of PUNN to cope the local minima on the error surface problem. The presented model improves both the weights and the structure of
these networks by means of an evolutionary programming algorithm. The performance of the model is evaluated using five benchmark functions. Dulakshi et al. [8] investigated the applicability of PUNN to hydrological time series prediction. They noted that PUNN achieved more accurate results than ANN. Martı´nez-Estudillo et al. [9] proposed a classification method based on PUNN. They applied an evolutionary algorithm to specify the basic structure of the PUNN model.
The paper is arranged as follows: Section 2 briefly reviews the theoretical background of study. Section 3 introduces the databases which are used for application aim. Section 4 describes the application results. In the section 5 the paper is concluded.
2. Theoretical Background
2.1. Product-Unit Neural Networks
In PUNN, the summation units of the hidden layer are replaced by the product units with weights.
∑𝑵𝑵𝒊𝒊=𝟏𝟏𝒙𝒙𝒊𝒊𝒘𝒘𝒊𝒊 ∏𝑵𝑵𝒊𝒊=𝟏𝟏𝒙𝒙𝒊𝒊𝒘𝒘𝒊𝒊 (1)
Fig. 1 shows the basic PUNN structure. Let the network has 𝑵𝑵 inputs. Assume that {𝒙𝒙𝟏𝟏, 𝒙𝒙𝟐𝟐, … , 𝒙𝒙𝑵𝑵} is an input vector, where N
is a number of input variables. There are 𝑴𝑴 neurons in hidden layer and 𝑲𝑲 outputs. 𝒘𝒘𝒊𝒊𝒊𝒊 is a weight between 𝒊𝒊th neuron of input vector
and 𝒊𝒊th neuron of hidden layer. Thus the 𝒊𝒊th neuron of hidden layer is
𝒂𝒂𝒊𝒊= ∏𝑵𝑵𝒊𝒊=𝟏𝟏𝒙𝒙𝒊𝒊𝒘𝒘𝒊𝒊𝒊𝒊 (2)
where 𝒊𝒊 = 𝟏𝟏, 𝟐𝟐, … , 𝑴𝑴. 𝒗𝒗𝒊𝒊𝒊𝒊 is a weight between 𝒊𝒊th neuron of hidden
layer and 𝒊𝒊th neuron of output layer. Thus the input of 𝒊𝒊th neuron of output layer is
𝒃𝒃𝒊𝒊= ∑𝑴𝑴𝒊𝒊=𝟏𝟏𝒂𝒂𝒊𝒊𝒗𝒗𝒊𝒊𝒊𝒊+ 𝒗𝒗𝟎𝟎𝒊𝒊 (3)
_______________________________________________________________________________________________________________________________________________________________
1 Computer Eng., Selcuk University, Konya – 42002, TURKEY
International Journal of Intelligent Systems and Applications in Engineering IJISAE, 2017, 5(4), 252-255 |253 Fig. 1. Structure of PUNN
where, 𝒊𝒊 = 𝟏𝟏, 𝟐𝟐, … , 𝑲𝑲. Here 𝒗𝒗𝟎𝟎𝒊𝒊 is a bias of 𝒊𝒊th output. And
output of 𝒊𝒊th neuron of output layer is
𝒚𝒚𝒊𝒊= 𝒇𝒇(𝒃𝒃𝒊𝒊) (4)
Where 𝒇𝒇 is an activation function. 2.2. Cuckoo Optimization Algorithm
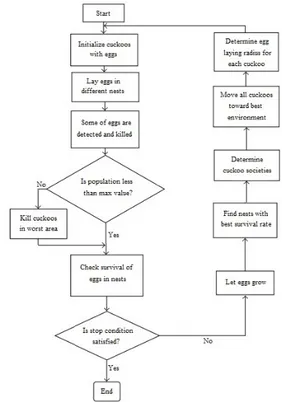
Cuckoo Optimization Algorithm (COA) inspired by the life of a bird family which is called cuckoo has been presented by Rajabioun [10]. Fig. 2 shows a flowchart of the COA. The basic motivation of this algorithm was a cuckoos special egg laying and breeding style. The algorithm starts with an initial cuckoo population. The initial cuckoos lay eggs to nest of host bird. Some of these laid eggs are more alike to the eggs of host bird’s and thus they have the chance to grow up. The less alike eggs are determined and are killed by host birds. The suitability of the nests in the area is determined through the number of grown eggs reveal. So the task of COA is to find better location in which more eggs can survive.
In this study COA has been used to determine the weights of PUNN. The method begins with a random initial population and in each iteration, the population modifies via COA principles. The each individual presents the weights of PUNN. Accuracy (5) equation has been used as fitness function.
𝐴𝐴𝐴𝐴𝐴𝐴𝐴𝐴𝐴𝐴𝐴𝐴𝐴𝐴𝐴𝐴 =𝑇𝑇𝑇𝑇+𝑇𝑇𝑇𝑇+𝐹𝐹𝑇𝑇+𝐹𝐹𝑇𝑇𝑇𝑇𝑇𝑇+𝑇𝑇𝑇𝑇 (5) Where TP and FP are the number of correctly and incorrectly identified, TN and FN are the number of correctly rejected and incorrectly rejected cases, respectively.
3. Used Databases
3.1. BUPA liver disorders
BUPA liver disorders dataset has been used in implementation phase. The data sets have been obtained from the UCI Machine Learning Repository [11].
Table 1. BUPA liver disorders dataset
Feature No Feature explanations
1 mean corpuscular volume (mcv) 2 alkaline phosphotase (alkphos) 3 alamine aminotransferase (sgpt) 4 aspartate aminotransferase (sgot) 5 gamma-glutamyl transpeptidase (gammagt)
6 number of half-pint equivalents of alcoholic beverages drunk per day (drinks)
The data were collected by Richard S. Forsyth in BUPA Medical Research Ltd. The data set consists of 345 data. Data has 6 features which can be seen in Table 1.
Of these, 200 individuals suffer from alcoholism and 145 don’t have this problem.
Fig. 2. Flowchart of COA 3.2. Haberman's Survival Data
Haberman's Survival Data is other database which was used in implementation phase. The data sets have been obtained from the UCI Machine Learning Repository [11]. The data were collected by Tjen-Sien Lim. The data set consists of 306 data. Data has 3 features which can be seen in Table 2.
Of these, 225 individuals survived 5 years or longer and 81 are the patients which died within 5 year.
Table 2. Haberman's Survival Data
Feature No Feature explanations
1 Age of patient at the operation time (numerical) 2 Patient's year of operation
3 Number of detected positive axillary nodes (numerical) 3.3. Performance Metrics
Accuracy, sensitivity, specificity and F1 score have been used as performance metrics in this study. These statistics are calculated as follows:
𝑆𝑆𝑆𝑆𝑆𝑆𝑆𝑆𝑆𝑆𝑆𝑆𝑆𝑆𝑆𝑆𝑆𝑆𝑆𝑆𝐴𝐴 =𝑇𝑇𝑇𝑇+𝐹𝐹𝑇𝑇𝑇𝑇𝑇𝑇 (6) 𝑆𝑆𝑆𝑆𝑆𝑆𝐴𝐴𝑆𝑆𝑆𝑆𝑆𝑆𝐴𝐴𝑆𝑆𝑆𝑆𝐴𝐴 =𝑇𝑇𝑇𝑇+𝐹𝐹𝑇𝑇𝑇𝑇𝑇𝑇 (7) 𝐹𝐹1 𝑆𝑆𝐴𝐴𝑆𝑆𝐴𝐴𝑆𝑆 =2𝑇𝑇𝑇𝑇+𝐹𝐹𝑇𝑇+𝐹𝐹𝑇𝑇2𝑇𝑇𝑇𝑇 (8) Here TP and FP are the number of correctly and incorrectly identified, TN and FN are the number of correctly rejected and incorrectly rejected cases, respectively.
International Journal of Intelligent Systems and Applications in Engineering IJISAE, 2017, 5(4), 252-255 |254
4. Application Results
4.1. Application of BUPA liver disorders
Dataset of BUPA liver disorders has 345 patients. The dataset has been split into two subsets as training and testing.
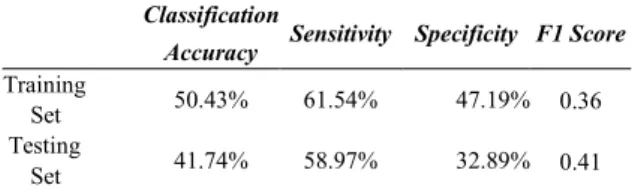
Table 3: The application result with BP algorithm for BUPA liver disorders Dataset
Classification
Accuracy Sensitivity Specificity F1 Score
Training
Set 50.43% 61.54% 47.19% 0.36 Testing
Set 41.74% 58.97% 32.89% 0.41 Table 4: The application result with LM algorithm for BUPA liver disorders Dataset
Classification
Accuracy Sensitivity Specificity F1 Score Training Set 72.17% 73.13% 70.83% 0.75 Testing Set 68.70% 76.39% 55.80% 0.75 Table 5: The application result with proposed algorithm for BUPA liver disorders Dataset
Classification
Accuracy Sensitivity Specificity F1 Score Training Set 75.22% 74.50% 81.48% 0.81 Testing Set 71.30% 78.48% 66.67% 0.81 Table 6: The application result with BP algorithm for Haberman's Survival Data
Classification
Accuracy Sensitivity Specificity F1 Score Training Set 78.43% 71.43% 79.5% 0.48 Testing Set 75.49% 50% 79.55% 0.36
Table 7: The application result with LM algorithm for Haberman's Survival Data
Classification
Accuracy Sensitivity Specificity F1 Score Training Set 73.53% 54.55% 75.82% 0.31 Testing Set 75.49% 50% 78.89% 0.32
Table 8: The application result with proposed algorithm for Haberman's Survival Data
Classification
Accuracy Sensitivity Specificity F1 Score Training Set 77.45% 75% 78.89% 0.45 Testing Set 78.43% 64.71% 83.53% 0.52
The training and testing dataset have 230 and 115 records respectively. The three-layer architecture has been used. The network has been trained using BP, LM and proposed algorithms.
The neurons in hidden layer have been used between 2-12. The results of application are shown in Table 3, Table 4 and Table 5. As it seen from Table 3 the BP algorithm failed in classification of BUPA. From Table 4, it can be seen that LM is more successful than BP for BUPA classification. LM is more successful in accuracy and both sensitivity and specificity. What is more, the F1 score is increased by LM. However, PUNN trained using COA is more successful than both LM and BP for both training and testing sets. The PUNN trained with COA is also achieved a successful result for sensitivity, specificity and F1 score.
4.2. Application of Haberman's Survival Data
Haberman's Survival Data Dataset has 306 patients. The dataset has been split into two subsets as training and testing. The training and testing dataset have 204 and 102 records respectively. The three-layer architecture has been used. The network has been trained using BP, LM and proposed algorithms. The neurons in hidden layer have been used between 2 and 12. The results of application are shown in Table 6-8.
As it seen from Table 6 and Table 7 the BP and LM algorithms both produced a successful result for Haberman Survival Data while BP is better than LM for training set. From Table 8, PUNN trained using COA is seen as more unsuccessful than LM, while it produced best results for training set, which is more important. Furthermore, sensitivity, specificity and F1 Score are better.
5. Conclusion
In this paper, product unit neural network has been trained using Cuckoo optimization algorithm. BUPA liver disorders and Haberman's Survival Data have been used for the application stage. For comparison aims, BP and LM algorithm have been used. The results show that PUNN trained with COA produced best accuracy for BUPA liver disorders. It achieved 71.30% of accuracy for testing set. Thus, the LM algorithm outperformed BP. For Haberman's Survival Data, the best was PUNN trained with COA. It achieved 78.43% of classification accuracy for testing set. BP and LM achieved equal accuracy as 75.49%. Therefore, the results showed that PUNN reaches better performance than BP and LM.
References
[1] S. Alwaisi, Ö. K. Baykan, “Training Of Artificial Neural Network Using Metaheuristic Algorithm”, International Journal of Intelligent Systems and Applications in Engineering, IJISAE, Special Issue, 12–16, 2017.
[2] S. Mukhopadhyay, C. Tang, J. Huang, M. Yu, M. Palakal, “A comparative study of genetic sequence classification algorithms”, Neural networks for signal processing. In Proceedings of the 2002 12th IEEE workshop on 4–6 September 2002, pp. 57–66.
[3] C. Hervás, F. J. Martínez, P. A. Gutiérrez, “Classification by means of Evolutionary Product-Unit Neural Networks”, 2006 International Joint Conference on Neural Networks Sheraton Vancouver Wall Centre Hotel, Vancouver, BC, Canada July 16-21, 2006.
[4] de N. Arie, M. Erwin, S. Sebastiaan, "Accurate Prediction Of Ecological Quality Ratio With Product Unit Neural Networks" , CUNY Academic Works, 2014.
[5] A. Guerrero-Enamorado, D. Ceballos-Gastell, “An Experimental Study of Evolutionary Product-Unit Neural Network Algorithm”, Computación y Sistemas, Vol. 20, No. 2, 2016, pp. 205–218, doi: 10.13053/CyS-20-2-2218
[6] C. Zhang, W. Wu, X. H. Chen, Y. Xiong, “Convergence of BP algorithm for product unit neural networks with exponential, weights, Neurocomputing”, Volume 72, Issues 1–3, Pp 513-520, 2008.
[7] A. Martı´nez-Estudillo, F. Martı´nez-Estudillo, C. Herva´s-Martı´nez, N. Garcı´a-Pedrajas, “Evolutionary product unit based neural networks for regression”, Neural Networks 19, 477–486, 2006.
[8] K. Dulakshi, A. W. Jayawardena and W. K. Li, “Evolutionary product unit based neural networks for hydrological time series analysis”, Journal of Hydroinformatics, 13(4), 825-841,2011.
International Journal of Intelligent Systems and Applications in Engineering IJISAE, 2017, 5(4), 252-255 |255 [9] F.J. Martı´nez-Estudillo, C. Herva´s-Martı´nez, P. A. Gutie´rrez, A. C.
Martı´nez-Estudillo, “Evolutionary product-unit neural networks classifiers”, Neurocomputing 72, 548–561, 2008.
[10] R. Rajabioun, “Cuckoo Optimization Algorithm”, Applied Soft Computing, Volume 11, Issue 8, pp. 5508-5518, 2011.
[11] M. Lichman, UCI Machine Learning Repository [http://archive.ics.uci.edu/ml]. Irvine, CA: University of California, School of Information and Computer Science, last accessed 15.08.2017.