https://doi.org/10.1007/s10157-019-01794-7 ORIGINAL ARTICLE
Association of depressive symptoms with 25(OH) vitamin D
in hemodialysis patients and effect of gender
Yasemin Coskun Yavuz1,6 · Zeynep Biyik1 · Durmus Ozkul2 · Sedat Abusoglu3 · Duygu Eryavuz3 · Mikail Dag3 ·
Muslu Kazim Korez5 · Ibrahim Guney4 · Lutfullah Altintepe1
Received: 17 June 2019 / Accepted: 11 September 2019 / Published online: 23 September 2019 © Japanese Society of Nephrology 2019
Abstract
Background Depression is common in chronic kidney disease (CKD) patients and associated with significant increase in morbidity and mortality. In recent years, a relationship between vitamin D deficiency and depression has been shown. The aim of this study is to investigate the relationship between 25-hydroxy (OH) vitamin D and depression in hemodialysis patients.
Methods A total of 140 patients were included in the study. Hamilton depression scale (HAM-D) was completed by all patients. 25(OH) vitamin D levels were compared between patients with and without depressive symptoms.
Results Patients who had depressive symptoms had significantly lower 25(OH) vitamin D levels (13.70 [24.3–8.25] vs. 18.20 [29.2–11.7] ng/mL, p = 0.016). HAM-D score showed significant association with gender (p = 0.011) and 25(OH) vitamin D level (p = 0.011). Univariate logistic regression analysis showed that males had lower risk of depression by a ratio of 61.1% (OR 0.389, p = 0.012) and vitamin D-deficient patients had 2.88 times greater risk of depression compared to non-deficient patients (OR 2.885, p = 0.013). Multivariate logistic regression analysis showed that males had 53.7% less risk of depres-sion (OR 0.463, p = 0.046) and vitamin D-deficient patients had 2.39 times greater risk of depresdepres-sion (OR 2.397, p = 0.047). When evaluated by gender, univariate logistic regression analysis showed that 25(OH) vitamin D and other variables were not associated with depression in females (p > 0.05), while only vitamin D level had a significant effect on depression in males (OR 8.207, p = 0.008).
Conclusions We found a significant association between vitamin D level and depressive symptoms in hemodialysis patients. When analyzed according to gender, this association was found to stand independent of other variables only in males.
Keywords Depression · Gender · Hemodialysis · Vitamin D
Introduction
In recent years, studies have shown that vitamin D deficiency has a role in many diseases including cancer and cardiovas-cular diseases. The association of depression with vitamin D deficiency has also been shown in several studies. The widespread presence of vitamin D receptors in the brain, the role of vitamin D in immune and anti-inflammatory path-ways that are thought to play a role in the pathophysiology of depression and the low level of vitamin D in people with depression in various studies has been shown as a reason for this association [1, 2]. The vitamin D level begins to decrease beginning with stage 2 in CKD patients, and its prevalence reaches 80% in CKD patients [3]. Depression is also common in dialysis patients, with a rate of 30–60% found in various studies. Known causes of increased preva-lence of depression in hemodialysis patients include loss of
* Yasemin Coskun Yavuz [email protected]
1 Internal Medicine Department, Selcuk University Faculty
of Medicine, Konya, Turkey
2 Internal Medicine Department, Konya Training and Research
Hospital, Konya, Turkey
3 Biochemistry Department, Selcuk University Faculty
of Medicine, Konya, Turkey
4 Nephrology Department, Konya Training and Research
Hospital, Konya, Turkey
5 Statistics Department, Selcuk University Faculty of Science,
Konya, Turkey
6 Nephrology Department, Selcuk University Faculty
physical function and mobility, dietary restrictions, frequent hospitalizations, reduced life expectancy, anemia, uremic bone disease and increased proinflammatory cytokines [4]. Since depression causes a significant increase in morbid-ity and mortalmorbid-ity in this group of patients, it is important for patient survival to detect and treat underlying causes of depression. The low response to antidepressants in patients with depression leads to the continuation of different searches for depression treatment. The recent investigation of association between depression and vitamin D in vari-ous patient populations has suggested that vitamin D sup-port may be beneficial in depressive patients. Vitamin D treatment was observed to decrease depressive symptoms in some studies. This effect is probably caused by antioxi-dant effect and anti-inflammatory effect against inflamma-tion, which is thought to be effective in the physiopathol-ogy of depression in recent years [1–3]. In this study, we investigated the relationship between vitamin D deficiency and depression, which are both common in the hemodialy-sis patient population, including comorbidity, demographic and other laboratory data.
Methods
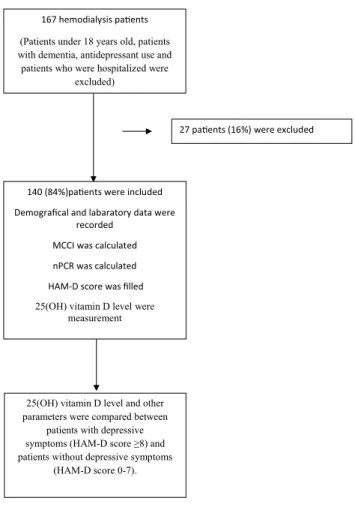
Before conducting this study, ethics committee approval was obtained from the local ethics committee (approval number: 2019/44) and oral and written consents were obtained from all patients. A total of 140 patients who had been on hemodi-alysis for at least 3 months in the university or public hospi-tal dialysis units were included in this study (Fig. 1). Patients under 18 years old, patients with dementia, antidepressant use and patients who were hospitalized were excluded from the study. Patients’ age, sex, dialysis duration, other systemic diseases, marital status, educational status, smoking status, use of vitamin D therapy and Kt/V values were recorded. Laboratory data such as serum predialysis and postdialy-sis BUN (blood urea nitrogen), creatinine, total cholesterol, albumin, calcium, phosphorus, albumin, parathormone (PTH) and hemoglobin levels were also recorded.
Normalized protein catabolic rate (nPCR) was calculated using the following formula [5]:
Body mass index (BMI) was calculated as body weight/ height2 (kg/m2) [6].
The depressive symptoms of patients were evaluated using the Turkish version of the Hamilton depression scale, which has 17 questions and of which a reliability and valid-ity study was already conducted. A HAM-D score of 8 or higher was accepted as presence of depressive symptoms [7, nPCR(g∕kg∕day) = (0.0136 × [Kt∕V × ([predialysis BUN
+ postdialysis BUN]�2)]) + 0.251.
8]. This scale is a scale used in various studies in dialysis patients [9, 10, 11].
Modified Charlson comorbidity index (MCCI)
MCCI was calculated in all patients. Since they were hemo-dialysis patients, the lowest possible score was 2. Patients were scanned for coronary artery disease, congestive heart failure, peripheral vascular disease, cerebrovascular acci-dent, dementia, chronic obstructive pulmonary disease, gas-tric ulcer, chronic liver disease, diabetes mellitus and cancer (including hematological malignancies). An additional point was added to the score for every decade over 40 years of age [12].
25(OH) vitamin D level measurement
25-OH D analyzes were made with liquid chromatogra-phy–mass spectrometry (LC–MS/MS) in the biochemistry laboratory of Selcuk University. In 25-OH D measurement with liquid chromatography–tandem mass spectrometry, lin-earity was 100% for 240 µg/L and 94% for 7.5 µg/L, intra-day assay precision was 5% and interintra-day assay precision
167 hemodialysis pa ents (Patients under 18 years old, patients with dementia, antidepressant use and
patients who were hospitalized were excluded)
140 (84%)pa ents were included Demografical and labaratory data were
recorded MCCI was calculated nPCR was calculated HAM-D score was filled 25(OH) vitamin D level were
measurement
25(OH) vitamin D level and other parameters were compared between
patients with depressive symptoms (HAM-D score ≥8) and patients without depressive symptoms
(HAM-D score 0-7).
27 pa ents (16%) were excluded
was 6.7% and obtained substance concentration in µg/L was around 94–98% 0.25-OH D analyses were made with liquid chromatography–mass spectrometry (LC–MS/MS) in the biochemistry laboratory of Selcuk University. In 25(OH) D vitamin measurement with liquid chromatography–tan-dem mass spectrometry, linearity was 100% for 240 µg/L and 94% for 7.5 µg/L, intraday assay precision was 5% and interday assay precision was 6.7% and obtained substance concentration in µg/L was around 94–98%.
Blood samples were obtained from all patients after 10 h fasting just before the mid-week dialysis session. All patients provided blood samples within the same season and same week (February 2019). Ten milliliters of blood sample were drawn into serum separator tubes by venipuncture from each subject and processed within 3 days. After centrifug-ing the samples at 4000×g for 10 min at 4 °C, sera samples were aliquoted and stored at − 80 °C further until analysis. 25(OH) vitamin D analyses were made with liquid chroma-tography–mass spectrometry (LC–MS/MS) in the biochem-istry laboratory of Selcuk University. In 25(OH) vitamin D measurement with liquid chromatography–tandem mass spectrometry, linearity was 100% for 240 ng/mL and 94% for 7.5 ng/mL, intraday assay precision was 5%, interday assay precision was 6.7%, and obtained substance concentration in µg/L was around 94–98%.
Statistical analysis
All statistical analyses were performed with R Version 3.6.0 software. Each variable was tested for normality before sta-tistical analyses. Continuous variables were expressed as mean ± standard deviation and median (interquartile range), and tested by Student’s t test and Mann–Whitney test. Cat-egorical variables were described as numbers and percent-ages, and tested by Chi square tests. The risk of depression in association with the risk factors was assessed using two sets of logistic regression: a univariate model for each of the predictors to explore its independent contribution to depres-sion and multiple logistic models to determine joint predic-tors for the depression. p < 0.05 was considered statistically significant.
Results
The mean age of the 140 patients was 55.4 ± 16.1 years (18–85 years). Of the participants, 61 (43.6%) were female and 79 (56.4%) were male. The mean vitamin D level of all patients was 18.8 ± 12.8 ng/mL. Since 25 (OH) vita-min D did not conform to the normal distribution, group comparisons were performed after log-transformation. A 25(OH) vitamin D level of less than 10 ng/mL was defined
as vitamin D deficiency [14–16]. The mean HAM-D score of all patients was 11.3 ± 7.7.
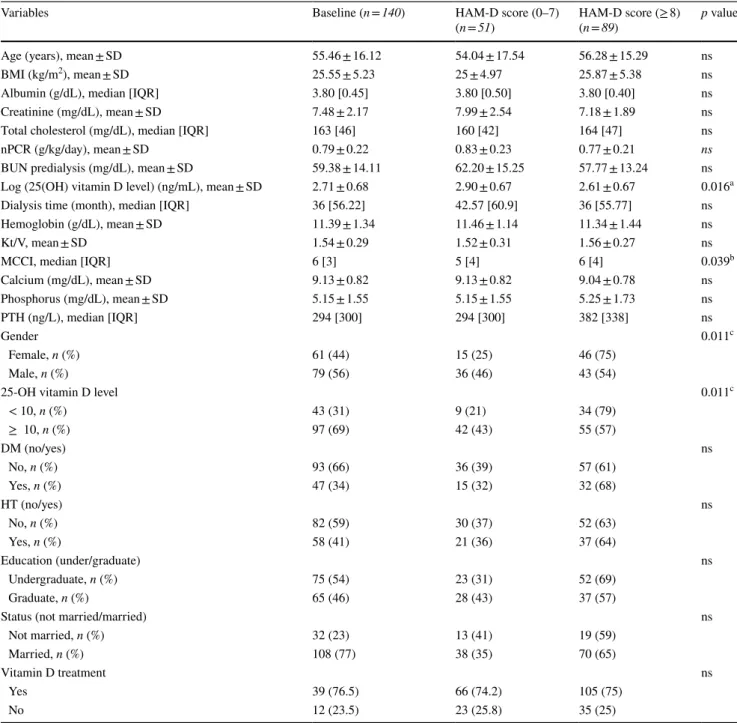
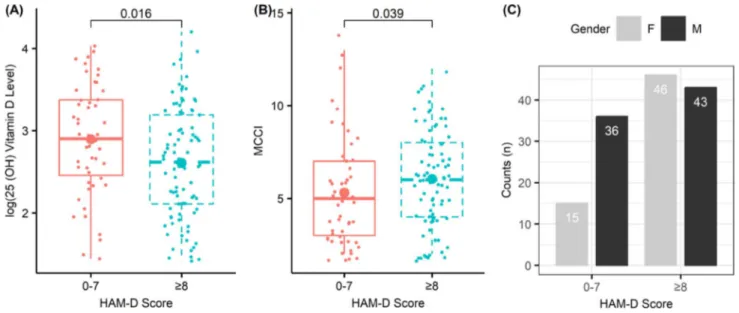
25(OH) vitamin D level and other parameters were compared between patients with depressive symptoms (HAM-D score ≥ 8) and patients without depressive symp-toms (HAM-D score 0–7), and the results are summarized in the table showing a comparison between numerical and categorical (Table 1) variables. Those with depressive symp-toms had significantly lower 25(OH) vitamin D levels than those without depressive symptoms (13.70 [24.3–8.25] vs 18.20 [29.2–11.7] ng/mL; p = 0.016). Patients with depres-sive symptoms had significantly higher MCCI scores com-pared to those without depressive symptoms (6 [8–4] vs. 5 [7–3]; p = 0.039) (Fig. 2). Other parameters did not show significant differences between the two groups (p > 0.05).
As shown in Table 1, there was a significant association between HAM-D score and gender (p = 0.011) and 25(OH) vitamin D level (p = 0.011). Prevalence of depressive symp-toms was significantly higher among females. Prevalence of depressive symptoms was also significantly higher among vitamin D-deficient patients.
Variables that showed significant differences were included in univariate logistic regression analysis. Males had 61.1% lower risk of depression than females, and this ratio was significant (OR 0.389, p = 0.012). Risk of depression was analyzed after stratification for vitamin 25(OH) vitamin D level, and patients with vitamin D deficiency [25(OH) vitamin D < 10 ng/mL] had 2.88 times greater risk of depres-sion than those who did not have deficiency [25 (OH) vita-min D ≥ 10 ng/mL], and this ratio was significant (OR 2.885,
p = 0.013). As for MCCI scores, there was no significant
effect of MCCI score on depression (OR 1.112, p = 0.120). To analyze variables that were found to be significant in univariate analysis, multiple logistic regression analysis was applied to these variables. Gender and vitamin D level, which are the two variables that were found as significant in univariate analysis, showed significant effects on depres-sion. Depression risk was 53.7% lower in males compared to females (OR 0.463, p = 0.046), and 2.39 times greater in vitamin D-deficient patients compared to non-deficient patients (OR 2.397, p = 0.047) (Table 2).
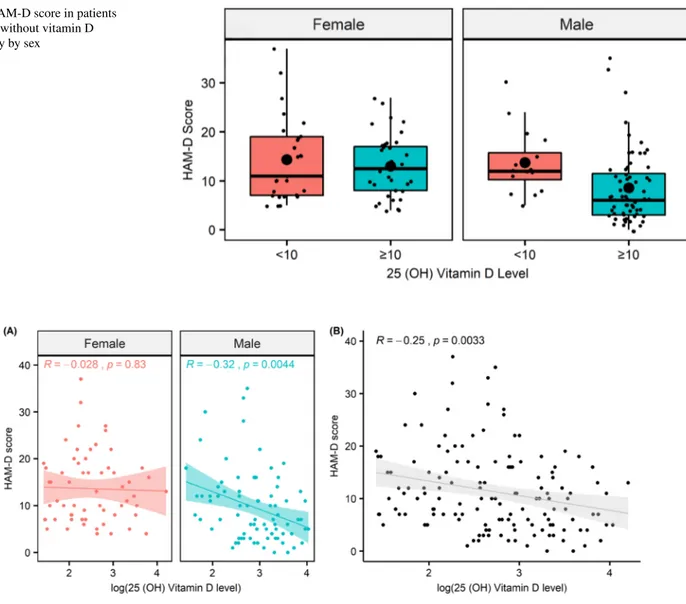
Patients were compared according to their gender, and the results are summarized in the table showing a comparison between numerical and categorical variables. 25(OH) vita-min D level was significantly lower (10.70, IQR 11.7) and Kt/V value was significantly higher (1.76, IQR 0.28) among females. As for categorical variables, the number of patients with vitamin D deficiency was significantly higher among females (p = 0.002). Additionally, the number of married individuals was significantly higher among females com-pared to males (p = 0.014) (Table 3). Other numerical and categorical variables did not show significant differences between females and males.
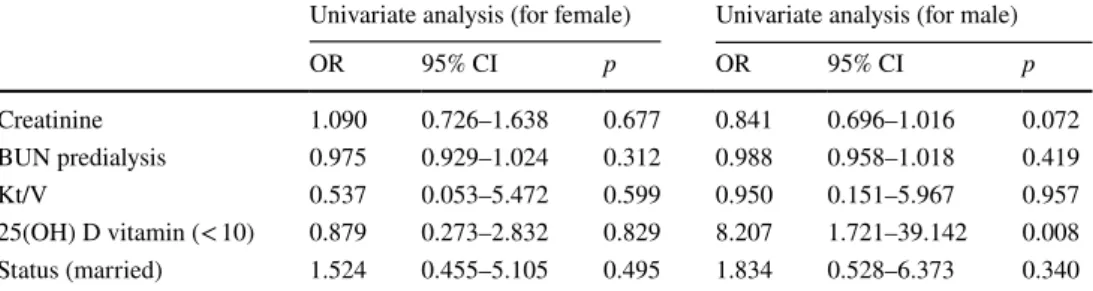
Variables that were found to show significant differences between genders were analyzed with univariate logistic regression analysis, and accordingly, predialysis BUN, cre-atinine, Kt/V, 25(OH) vitamin D deficiency and marital sta-tus in females were not found to be associated with depres-sion (p > 0.05). In males however, only vitamin D deficiency
had a significant effect on depression (OR 8.207, p = 0.008) (Table 4) (Fig. 3).
A Spearman’s rho correlation was run to determine the relationship between 25(OH) vitamin level and HAM-D score in pooled gender, female and male. There was a nega-tive correlation and significant relationship between 25(OH)
Table 1 Comparison of variables according to the presence of depressive symptoms
Data are presented as mean ± standard deviation, median [interquartile range] or number (percentage)
ns not significant, p < 0.05 was considered statistically significant
A student’s t test b Mann–Whitney U test c Chi square test
Variables Baseline (n = 140) HAM-D score (0–7)
(n = 51) HAM-D score (≥ 8) (n = 89) p value
Age (years), mean ± SD 55.46 ± 16.12 54.04 ± 17.54 56.28 ± 15.29 ns
BMI (kg/m2), mean ± SD 25.55 ± 5.23 25 ± 4.97 25.87 ± 5.38 ns
Albumin (g/dL), median [IQR] 3.80 [0.45] 3.80 [0.50] 3.80 [0.40] ns
Creatinine (mg/dL), mean ± SD 7.48 ± 2.17 7.99 ± 2.54 7.18 ± 1.89 ns
Total cholesterol (mg/dL), median [IQR] 163 [46] 160 [42] 164 [47] ns
nPCR (g/kg/day), mean ± SD 0.79 ± 0.22 0.83 ± 0.23 0.77 ± 0.21 ns
BUN predialysis (mg/dL), mean ± SD 59.38 ± 14.11 62.20 ± 15.25 57.77 ± 13.24 ns
Log (25(OH) vitamin D level) (ng/mL), mean ± SD 2.71 ± 0.68 2.90 ± 0.67 2.61 ± 0.67 0.016a
Dialysis time (month), median [IQR] 36 [56.22] 42.57 [60.9] 36 [55.77] ns
Hemoglobin (g/dL), mean ± SD 11.39 ± 1.34 11.46 ± 1.14 11.34 ± 1.44 ns
Kt/V, mean ± SD 1.54 ± 0.29 1.52 ± 0.31 1.56 ± 0.27 ns
MCCI, median [IQR] 6 [3] 5 [4] 6 [4] 0.039b
Calcium (mg/dL), mean ± SD 9.13 ± 0.82 9.13 ± 0.82 9.04 ± 0.78 ns Phosphorus (mg/dL), mean ± SD 5.15 ± 1.55 5.15 ± 1.55 5.25 ± 1.73 ns PTH (ng/L), median [IQR] 294 [300] 294 [300] 382 [338] ns Gender 0.011c Female, n (%) 61 (44) 15 (25) 46 (75) Male, n (%) 79 (56) 36 (46) 43 (54)
25-OH vitamin D level 0.011c
< 10, n (%) 43 (31) 9 (21) 34 (79) ≥ 10, n (%) 97 (69) 42 (43) 55 (57) DM (no/yes) ns No, n (%) 93 (66) 36 (39) 57 (61) Yes, n (%) 47 (34) 15 (32) 32 (68) HT (no/yes) ns No, n (%) 82 (59) 30 (37) 52 (63) Yes, n (%) 58 (41) 21 (36) 37 (64) Education (under/graduate) ns Undergraduate, n (%) 75 (54) 23 (31) 52 (69) Graduate, n (%) 65 (46) 28 (43) 37 (57)
Status (not married/married) ns
Not married, n (%) 32 (23) 13 (41) 19 (59)
Married, n (%) 108 (77) 38 (35) 70 (65)
Vitamin D treatment ns
Yes 39 (76.5) 66 (74.2) 105 (75)
vitamin D level and HAM-D score (r = −0.25, p < 0.05). Analysis of this relationship according to gender showed that this relationship was not significant in females (r = −0.028,
p = 0.83); however, a negative correlation and significant
relationship was found in males (r = −0.32, p = 0.0044) (Fig. 4).
Discussion
Vitamin D formed on the skin and taken with diet are not active. Vitamin D is transported to the liver by binding protein to 25 (OH) vitamin D. 25 (OH) vitamin D is the most common form of vitamin D with the longest half-life (2–4 weeks). Therefore, this form is used to determine the vitamin D level in the clinic. 25 (OH) vitamin D is trans-ported to the proximal tubules of the kidney, where it becomes 1,25 (OH) vitamin D. The half-life of 1,25 (OH) vitamin D is 2–4 h and the serum level is very low compared to 25 (OH) vitamin D. In moderate and advanced chronic renal failure, it goes down to immeasurable levels [13, 14]. Therefore, in chronic renal failure, 25 (OH) vitamin D is
measured to determine vitamin D level and we used 25 (OH) vitamin D levels in our study.
A significant relationship between vitamin D levels and many diseases has been shown in recent years. In this study, we investigated the relationship between depression and 25(OH) vitamin D levels in hemodialysis patient popula-tion because of the frequent presence of both depression and vitamin D deficiency in patients with chronic renal failure. Vitamin D deficiency in CKD is multifactorial. Particularly in hemodialysis patients, many reasons such as insufficient sunlight exposure, hyperpigmentation, lack of oral intake, decrease in gastrointestinal absorption due to uremia, pro-teinuria, and low physical activity have been discovered [3,
17, 18]. In the present study, we found a mean 25(OH) vita-min D level of 18.8 ± 12.8 ng/mL in our study patients. This result is similar to reports of previous studies on hemodialy-sis patients [19, 20]. As expected, we found vitamin D levels were significantly lower in females, similar to many studies [21, 22]. Factors contributing to vitamin D deficiency in females are insufficient sunlight exposure, higher body mass index, more fat tissue, and more sedentary life [21].
Depression is observed in a wide range, 30–60%, of the hemodialysis patient population [23]. Depression is more
Fig. 2 Box plot of variables that are found to have a significant association with HAM-D score Table 2 Univariate and multiple
logistic regression analyses of risk factors associated with depression
OR odds ratio, CI confidence interval (lower and upper bound), MCCI modified Charlson comorbidity
index
Univariate analysis Multiple analysis (backward)
OR 95% CI p OR 95% CI p
Gender (male) 0.389 0.187–0.810 0.012 0.463 0.217–0.985 0.046
25(OH) D vitamin (< 10) 2.885 1.249–6.665 0.013 2.397 1.012–5.680 0.047
Table 3 Comparison of variables according to gender
Data are presented as mean ± standard deviation, median [interquartile range] or number (percentage)
ns not significant, p < 0.05 was considered statistically significant
a Student’s t test b Chi square test
Variables Female (n = 61) Male (n = 79) p value
Age (years), median [IQR] 59 [21] 55 [20.5] ns
BMI (kg/m2), mean ± SD 26.14 ± 5.91 25.10 ± 4.63 ns
Albumin (g/dL), median [IQR] 3.82 [0.50] 3.80 [0.40] ns
Creatinine (mg/dL), mean ± SD 6.82 ± 1.47 7.98 ± 2.49 0.001a
Total cholesterol (mg/dL), median [IQR] 172 [53] 155 [44] ns
nPCR (g/kg/day), mean ± SD 0.79 ± 0.21 0.79 ± 0.22 ns
BUN predialysis (mg/dL), mean ± SD 55.52 ± 12.31 62.36 ± 14.75 0.004a
Log (25(OH) vitamin D level) (ng/mL), mean ± SD 2.49 ± 0.69 2.89 ± 0.63 < 0.001a
Dialysis time (month), median [IQR] 41.53 [48] 33.47 [63.38] ns
Hemoglobin (g/dL), median [IQR] 11.30 [1.3] 11.50 [1.6] ns
Kt/V, mean ± SD 1.70 ± 0.26 1.42 ± 0.24 0.001a
MCCI, median [IQR] 6 [4] 5 [4] ns
Calcium (mg/dL), mean ± SD 9.22 ± 0.82 8.96 ± 0.76 ns
Phosphorus (mg/dL), mean ± SD 4.95 ± 1.63 5.41 ± 1.67 ns
PTH (ng/L), median [IQR] 342 [290] 324 [358] ns
25(OH) vitamin D level 0.002b
< 10, n (%) 27 (63) 16 (37) ≥ 10, n (%) 34 (35) 63 (65) DM (no/yes) ns No, n (%) 40 (43) 53 (57) Yes, n (%) 21 (45) 26 (55) HT (no/yes) ns No, n (%) 36 (44) 46 (56) Yes, n (%) 25 (43) 33 (57) Education (under/graduate) ns Undergraduate, n (%) 31 (41) 44 (59) Graduate, n (%) 30 (46) 35 (54)
Status (not married/married) 0.014b
Not married, n (%) 20 (63) 12 (38)
Married, n (%) 41 (38) 67 (62)
Vitamin D treatment ns
Yes 49 (80.3) 56 (70.9) 105 (75)
No 12 (19.7) 23 (29.1) 35 (25)
Table 4 Univariate logistic regression analyses of risk factors associated with depression
OR odds ratio, CI confidence interval (lower and upper bound)
Univariate analysis (for female) Univariate analysis (for male)
OR 95% CI p OR 95% CI p Creatinine 1.090 0.726–1.638 0.677 0.841 0.696–1.016 0.072 BUN predialysis 0.975 0.929–1.024 0.312 0.988 0.958–1.018 0.419 Kt/V 0.537 0.053–5.472 0.599 0.950 0.151–5.967 0.957 25(OH) D vitamin (< 10) 0.879 0.273–2.832 0.829 8.207 1.721–39.142 0.008 Status (married) 1.524 0.455–5.105 0.495 1.834 0.528–6.373 0.340
common in females in the healthy population and in other patient groups [24]. This frequency is 1.7–2 times more compared to males. Many factors have been charged for the high frequency of depression in females. These fac-tors are genetic facfac-tors, effects of environment on genes, ovarian hormones, changes in hypo-pituitary-adrenal axis (HPA), especially limbic changes in central nervous system, increased proinflammatory cytokines in females, effects of sex hormones on immune system, environmental factors, lack of an environment for self-expression, social pressure, and a higher rate of exposure to psychological, mental, and physical violence [25]. In our study, the mean depression score was 13.6 ± 7.4 in females and 9.6 ± 7.52 in males, and it was significantly higher in females (p = 0.002).
The relationship between vitamin D level and depression has previously been studied in the general population as well as in various patient groups [26]. In the study by Milaneschi et al. that included nearly 1000 elderly patients, vitamin
D deficiency was found to be associated with depressive symptoms [27]. In another study including over 3000 male participants with an age range of 40–80 years from vari-ous countries in Europe, increased depressive symptoms were observed in those with vitamin D deficiency [28]. Reduced vitamin D levels in various patient groups, includ-ing obese individuals [29], postpartum women [30] and gout patients [31], were found to be associated with depres-sion. In our study, we also found a significant relationship between vitamin D deficiency and depressive symptoms independent of other variables in hemodialysis patients (OR 2.397, p = 0.047). We also investigated this relationship in the hemodialysis patient population and found a negative correlation between HAM-D score and 25 (OH) vitamin D (r = − 0.25, p = 0.0029). The association of vitamin D level with depression has been explained by several mecha-nisms. Vitamin D receptors are present in the hippocampus, hypothalamus, amygdala and substantia nigra in the brain.
Fig. 3 HAM-D score in patients with and without vitamin D deficiency by sex
Reduced serotonin levels in the hippocampus were shown to be present during depression, and some anatomical changes in the hippocampus were documented in case of vitamin D deficiency [32, 33]. As another mechanism, vitamin D has been shown to cause a decrease in neuronal calcium levels, which plays an important role in depression [25]. Recently, there have been studies suggesting a possible role of inflam-mation in depression. Increased proinflammatory cytokines such as TNF-α in particular, IL1α and β, and IL6, and addi-tionally reactive oxygen species have been documented in certain areas of brain in depression; the observation that vitamin D supplementation caused reduction in these proin-flammatory cytokines has led to the thought that vitamin D reduces depression via an anti-inflammatory mechanism [15,
33]. Chronic kidney disease is a process involving chronic low-grade inflammation. In hemodialysis patients, vitamin D deficiency, which is a common condition among these patients, may be an aggravating factor for development of depressive symptoms by contributing to this inflammatory process [34]. Additionally, it was shown by Nanri et al. that vitamin D-associated depressive symptoms occur during the winter season and disappear in summer [35]. In our study, we measured vitamin D levels of our patients in Febru-ary. This seasonal difference may also have influenced the results.
There are several studies investigating the relationship between nutritional deficiency and depression in hemodialy-sis patients. While some of these studies have found a rela-tionship between these two parameters [3, 36], some have not found any relationship. Alston et al. found a negative relationship between depression and appendicular muscle mass, and found no relationship between BMI and sion. Oliveira et al. found no relationship between depres-sion and nutritional parameters in hemodialysis patients [37,
38]. In our study, we did not find any nutritional factors (BMI, albumin, total cholesterol nPCR) between patients with and without depressive symptoms.
In a study on the relationship between vitamin D and depression in CKD patients, Jhee et al. found a high depression score in patients with vitamin D deficiency. However, the patient group was not only composed of hemodialysis patients in their study. Excluding confound-ing factors and considerconfound-ing gender, they still observed a significant relationship between vitamin D and depression in females but not in males [16]. In a study by Kgaer-gard et al., the relationship between vitamin D levels and depression among Norwegian adults was found to be sig-nificant in females [2]. Unlike the results of those studies, we found that this association persisted in being signifi-cant only in males when patients were grouped by gender. There are other studies in literature that support our find-ings. Black et al. found the relationship between depres-sion and 25 (OH) vitamin D significant only in males in a
study conducted on young adults. Even if the factors such as race, age, BMI, and physical activity were adjusted, this relationship remained significant. Depression score was observed to decrease as vitamin D increased [40]. In a study conducted on Koreans over 65 years old, there was a significant negative correlation between vitamin D level and depression in males but not in females. The authors attributed this result to psychosocial factors being more important for females, whereas physical factors play more important roles in males with regard to depression [39]. That may be a compelling reason. In males, androgens suppress the inflammatory response and immune sys-tem. Therefore, activation of inflammatory response and immune system in case of low androgen levels may trigger mood changes in males [41]. Androgen levels are reduced in males with chronic kidney disease [42]. This results in activation of the immune system and development of inflammation. Vitamin D deficiency may aggravate inflam-mation caused by reduced androgen levels in chronic kid-ney disease and thus potentiate depressive symptoms. Nevertheless, these possible causes are interpretations deduced from the existing studies, and more comprehen-sive studies are needed to explain the association between vitamin D deficiency and depressive symptoms in male dialysis patients. Moreover, in our study, male patients had no androgen level results. This further strengthens the need for further work.
There are some limitations of this study. It is a cross-sectional study. It does not include some factors of pos-sible importance such as physical activity and sunlight exposure. Our small number of patients may be one factor reducing its strength. Another limitation is that depres-sion state of patients was assessed with a scale. While this method is not diagnostic on its own, it gives an idea of whether depressive symptoms are present.
Conclusion
There are few studies in the literature examining the rela-tionship between depression and vitamin D in chronic kidney disease. To our knowledge, this is the first study to focus on the relationship between vitamin D and depres-sion in the hemodialysis population. Our results showed that vitamin D deficiency was associated with increased prevalence of depressive symptoms, and analysis of this relationship according to gender showed that this associa-tion was significant in males. We believe the cause–effect relationship of this association should be investigated with prospective studies on larger numbers of patients.
Compliance with ethical standards
Conflict of interest The authors have declared that no conflict of inter-est exists.
Ethics standards The study was approved by the Ethics Advisory Com-mittee of the Selcuk University (approval number: 201944).
Informed consent Informed consent was obtained from all patients (oral and written).
References
1. Vellekkatt F, Menon V. Efficacy of vitamin D supplementation in major depression: a meta-analysis of randomized controlled trials. J Postgrad Med. 2018. https ://doi.org/10.4103/jpgm. JPGM_571_17.
2. Kgaergard M, Joakimsen R, Jorde R. Low serum 25-hydroxyvita-min D levels are associated with depression in an adult Norwegian population. Psychiatry Res. 2011;190(2–3):221–5.
3. Gois PHF, Wolley M, Ranganathan D, Seguro AC. Vitamin D deficiency in chronic kidney disease: recent evidence and contro-versies. Int J Environ Res Public Health. 2018;15:1773.
4. Semaan V, Noureddine S, Farhood L. Prevelance od depression and anxiety in end-stage renal disease: a survey of patients under-going hemodialysis. Appl Nurs Res. 2018;43:80–5.
5. Kaynar K, Songul Tat T, Ulusoy S, Cansiz M, Ozkan G, Gul S, Bektas O. Evaluation of nutritional parameters of hemodialysis patients. Hippokratia. 2012;16(3):236–40.
6. Kittiskulnam P, Carrero JJ, Chertow GM, Kaysen GA, Delgado C, Johansen KL. Sarcopenia among patients receiving hemodi-alysis: weighing the evidence. J Cachexia Sarcopenia Muscle. 2017;8(1):57–68.
7. Aydemir O, Ergun H, Soygur H, Kesebir S, Tulunay C. Major depresif bozuklukta yaşam kalitesi. Türk Psikiyatri Derg. 2009;20(3):205–2012.
8. Ozyuksel B, Ulug B. Depresyon tanısı alan hastalarda kalıntı belirtilerin yetiyitimi ile ilişkisi. Türk Psikiyatri Derg. 2007;18(3):161–9.
9. Al Saraireh FA, Aloush SM, Al Azzam M, Al Bashtawy M. The effectiveness of cognitive behavioral therapy versus psychoeduca-tion in the management of depression among patients undergoing haemodialysis. Issues Ment Healthy Nurs. 2018;39(6):514–8. 10. Coulibaly G, Goumbri P, Ouedraogo N, Dabilgou A, Napon
C, Karfo K, et al. Factors associated with depressive symp-toms in chronic hemodialysis patients of centre hospitalier uni-versitaire Yalgado Ouedraogo (Burkino Faso). Nephrol Ther. 2016;12(4):210–4.
11. Hu A, Xue Z, Mwansisya TE, Zhou A, Pu W, Chen X, et al. Major depressive disorders in hemodialysis patients in China. Asia Pac Psychiatry. 2015;7(1):78–84.
12. Hemmelgarn BR, Manns BJ, Quan H, Ghali WA. Adapting the Charlson Comorbidity Index for use in patients with ESRD. Am J Kidney Dis. 2003;42:125–32.
13. Holick MF. Vitamin D: its role in cancer prevention and treatment. Prog Biophys Mol Biol. 2006;92(1):49–59.
14. Ishimura E, Nishizawa Y, Inaba M, Matsumoto N, Emoto M, et al. Serum levels of 1,25-dihydroxyvitamin D, 24-25-dihydroxyvita-min D in nondialyzed patients with chronic renal failure. Kidney Int. 1999;55:1019–27.
15. Stefanowski B, Wojcinska AA, Swiecicki L. The effect of vitamin D3 deficiency on the severity of depressive symptoms. Overview of current research. Psychiatry Pol. 2017;51(3):437–54.
16. Jhee JH, Kim H, Park S, Yun HR, Jung SY, Kee YK, et al. Vitamin D deficiency is significantly associated with depres-sion in patients with chronic kidney disease. PLoS One. 2017;12(2):e0171009.
17. Kim JK, Park MJ, Song YR, Kim HJ, Kim SG. Vitamin D: a pos-sible modifying factor linking obesity to vascular calcification in hemodialysis patients. Nutr Metab. 2017;14(1):27.
18. Jean G, Souberbielle JC, Chazot C. Vitamin D in chronic kidney disease and dialysis patients. Nutrients. 2017;9(4):328.
19. Ravani P, Malbarti F, Tripepi G, Pecchini P, Cutrupi S, Pizzini P, et al. Vitamin D levels and patient outcome in chronic kidney disease. Kidney Int. 2009;75(1):88–95.
20. Dusilova-Sulkova S, Safranek R, Vavrova J, Horacek J, Pavlikova R, Palicka V. Low dose cholecalciferol supplementation and dual vitamin D therapy in haemodialysis patients. Int Urol Nephrol. 2015;47(1):169–76.
21. Sezgin G, Ozturk G, Turkal R, Caykara B. Vitamin D levels of out-patients admitted to a University Hospital in the Marmara Region of Turkey over 3 years. J Med Biochem. 2019;38(2):181–7. 22. Looker AC, Johnson CL, Lacher DA, Pfeiffer CM, Schleicher RL,
Sempos CT. Vitamin D status. United States, 2001–2006. NCHS Data Brief. 2011;59:1–8.
23. Ćwiek A, Czok M, Kurczab B, Kramarczyk K, Drzyzga K, Kucia K. Association between depression and hemodialy-sis in patients with chronic kidney disease. Psychiatr Danub. 2017;29(Suppl 3):499–503.
24. Eid RS, Gobinath AR, Galea LAM. Sex differences in depression: insights from clinical and preclinical studies. Prog Neurobiol. 2019;176:86–102.
25. Kuehner C. Why is depression more common among women than among men. Lancet Psychiatry. 2017;4(2):146–58.
26. Caccamo D, Ricca S, Curro M, Ientile R. Health risks of hypovi-taminosis D: a review of new molecular insights. Int J Mol Sci. 2018;19:892.
27. Milaneschki Y, Shardell M, Corsi AM, Vazzana R, Bandinelli S, Guralnik JM, et al. Serum 25-hydroxyvitamin D nad depressive symptoms in older women and men. J Clin Endocrinol Metab. 2010;95(7):3225–33.
28. Lee DM, Tajar A, O’Neill TW, O’Connor DB, Bartfaj G, Boonen S, et al. Lower vitamin D levels are associated with depression among community-dwelling European men. J Psychopharmacol. 2011;25(10):1320–8.
29. Jorde R, Sneve M, Figenschau Y, Svartberg J, Waterloo K. Effects of vitamin D supplementation on symptoms of depression in over-weight and obese subjects: randomized double blind trial. J Intern Med. 2008;264(6):599–609.
30. Abedi P, Bovayri M, Fakhri A, Jahanfar S. The relationship between vitamin D and postpartum depression in reproductive-aged Iranian women. J Med Life. 2018;11(14):286–92.
31. Zhou Q, Shao YC, Gan ZQ, Fang LS. Lower vitamin D levels are associated with depression in patients with gout. Neuropsychiatr Dis Treat. 2019;15:227–31.
32. Lardner AL. Vitamin D and hippocampal development-the story so far. Front Mol Neurosci. 2015;8:58.
33. Berridge MJ. Vitamin D and depression: cellular and regular mechanisms. Pharmacol Rev. 2017;69:80–92.
34. Nowak KL, Chonchol M. Does inflammation affect outcomes in dialysis patients? Semin Dial. 2018;31(4):388–97.
35. Nanri A, Mizoue T, Matsushita Y, Poudel-Tandukar K, Satom OM, Mishima N. Association between serum 25-hydroxyvitamin D and depressive symptoms in Japanese: analysis by survey sea-son. Eur J Clin Nutr. 2009;63:1444–7.
36. Markaki AG, Charonitaki A, Psylinakis E, Dimitropoulakis P, Spyridaki A. Nutritional status in hemodialysis patients is inversely related to depression and introversion. Psychol Healthy Med. 2019. https ://doi.org/10.1080/13548 506.2019.16120 74.
37. Alston H, Burns A, Davenport A. Loss of appendicular muscle mass in haemodialysis patients is associated with increased self-reported depression, anxiety and lower general healthy scores. Nephrology (Carlton). 2018;23(6):546–51.
38. Oliveira CM, Costa SP, Costa LC, Pinheiro SM, Lacerda GA, Kubrusly M. Depression in dialysis patients and its asso-ciation with nutritional markers and quality of life. J Nephrol. 2012;25(6):954–61.
39. Song BM, Kim HC, Rhee Y, Youm Y, Kim CO. Association between serum 25-hydroxyvitamin D concentrations and depres-sive symptoms in an older Korean population: a cross-sectional study. J Affect Disord. 2016;189:357–64.
40. Black LJ, Jacoby P, Allen KL, Trapp GS, Hart PH, Byrne SM, et al. Low vitamin D levels are associated with symptoms
of depression in young adult males. Aust N Z J Psychiatry. 2014;48(5):464–71.
41. Rainville JR, Hodes GE. Inflaming sex differences in mood dis-orders. Neuropsyhopharmacology. 2019;44(1):184–99.
42. Valdivielso JM, Jacobs-Cacha C, Soler MJ. Sex hormones and their influence on chronic kidney disease. Curr Opin Nephrol Hypertens. 2019;28(1):1–9.
Publisher’s Note Springer Nature remains neutral with regard to jurisdictional claims in published maps and institutional affiliations.