www.betam.bahcesehir.edu.tr
1
TOWARDS HARD LANDING IN THE TURKİSH ECONOMY
Seyfettin Gürsel•, Zümrüt İmamoğlu‡ ve Barış Soybilgen†
Executive Summary
According to data released by Turkstat, Turkey’s real GDP increased at an annual rate of 1.6 percent in the third quarter of 2012 from the same quarter of the previous year. It is the slowest annual growth rate in 2012. Year-on-year (YoY) growth rate in the first and the second quarter were 3.4 percent and 3.0 percent, respectively. Overall, the 9-month growth rate in 2012 ended up being 2.6 percent.
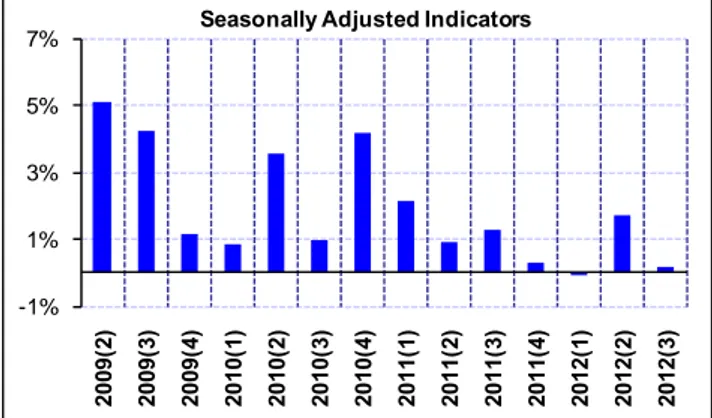
The GDP growth slowed down significantly on a quarterly basis as well. Turkstat announced that the seasonally adjusted real GDP increased by 0.2 percent from the second quarter of 2012. In the second quarter, the quarter on quarter (QoQ) GDP growth rate was 1.7 percent. Betam forecasted a slump in the GDP growth by using monthly data, but the actual growth was below our expectations. Unlike TurkStat, Betam seasonally adjusts each GDP component separately. According to Betam’s analysis, the private consumption expenditure increased QoQ. However, the private consumption demand was mostly met from inventory sales. Contribution of government expenditures to growth was positive and significantly large. However, the decline in the private investment expenditures and the smaller contribution compared to previous quarters from net exports caused the growth rate to remain low.
•
Prof. Dr. Seyfettin Gürsel, Betam, Director [email protected]
‡
Zumrut Imamoglu, Betam, Research Associate zumrut.ı[email protected]
†
Baris Soybilgen, Betam, Research Assistant [email protected]
Following the slowdown in the economy, the current account deficit is declining. The 12-month current account deficit was realized as 7.2 percent as Betam forecasted.
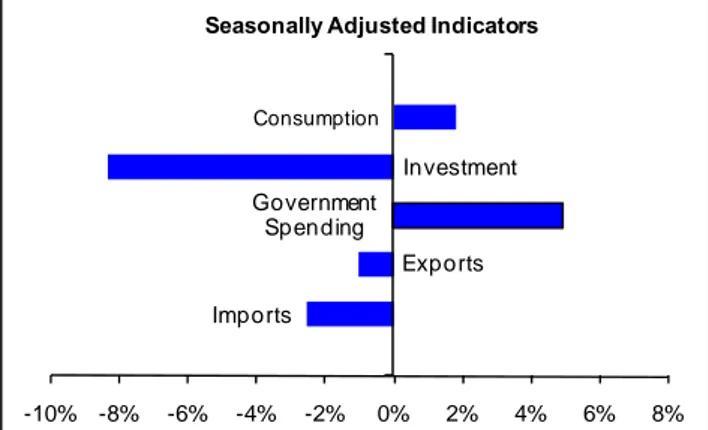
Figure 1: Change in GDP components in 2012-Q3 from the previous quarter
Source: Turkstat, Betam. Quarterly indicators are seasonally adjusted and calendar day corrected.
Figure 2: Contributions of GDP components to 2012-Q3 GDP growth
Source: Turkstat, Betam. Quarterly indicators are seasonally adjusted and calendar day corrected.
Imports Exports Government Spending Investment Consumption -10% -8% -6% -4% -2% 0% 2% 4% 6% 8%
Seasonally Adjusted Indicators
Imports Exports Inventory Investment Government Spending Investment Consumption -2.5% -1.5% -0.5% 0.5% 1.5%
Seasonally Adjusted Indicators
Total Growth: -1.1%
Growth Review: 2012, 3
rd
Quarter
www.betam.bahcesehir.edu.tr
2
Return to domestic demand led growth regimeTo analyze the contributions of GDP components to growth, Betam seasonally adjusts and calendar day corrects each component of GDP. Figure 1 shows the change in GDP components in the 3rd quarter from the previous quarter and Figure 2 shows their contributions to growth.
After decreasing in the first two quarters of 2012, private consumption expenditures increased in the third quarter from the previous quarter. However, the increase in the consumption is met by the inventory investment which surged in the second quarter. In our previous growth review research brief, we had pointed out that the surge in the inventory investment might indicate a slowdown in production. Nevertheless, the increase in consumption expenditures in the third quarter is an optimistic sign for the last quarter.
Other components of GDP do not look as promising though. The contribution of net exports declined and investment expenditures decreased. Even though the increase in government expenditures contributed positively to growth, the tight budget target for the end of the year makes it difficult for more contributions from the fiscal front.
The current situation shows signs of a regime change in growth; while the contribution of net exports is declining, the domestic demand is being revived through loose fiscal and monetary policy. Both the surge in the government expenditures in the third quarter and the funding cost reduced by Turkish Central Bank (CBRT) below the policy rate support the change.
The contribution of net exports declined
In the last quarter, net exports contributed 1.5 percent points to the QoQ real GDP growth. The contribution reduced to 0.4 percent in this quarter. Exports decreased by 1.0 percent in the third quarter from the previous quarter and subtracted 0.3 percent points from real GDP growth. On the other hand, imports decreased by 2.5 percent and contributed 0.7 percent points to growth. In economic outlook and forecasts research briefs, Betam forecasted that the contributions of net exports would decline in spite of high gold exports. Due to the slowdown in the economy and the decline in imports, the current account deficit quickly declined. The 12-month current account deficit to GDP ratio decreased from 8.2 percent at the end of the second quarter to 7.2 percent at the end of the third quarter.
Revival in consumption expenditures
According to Betam’s calculations, the private consumption expenditure increased for the first time since the last quarter of 2011 on a QoQ basis. In the third quarter of 2012, the private consumption expenditure increased by 1.8 percent and contributed 1.2 percentage points to the real GDP growth rate. The inventory investment decreased and subtracted 1.8 percent from growth. It seems that consumption demand was mainly met by sales from inventories rather than an increase in production. In fact, inventory investment had surged in the previous quarter when consumption demand was mainly flat. This is also in line with the decline in the industrial production index (IPI) in the third quarter. Nevertheless, it’s important that consumption continues its revival in the fourth quarter.
www.betam.bahcesehir.edu.tr
3
Investment declinedIn the third quarter, private investment expenditures fell by 8.3 percent and subtracted 1.7 percent from quarterly real GDP growth. Compared to the second quarter, the private investment expenditure decreased more in the third quarter. In the previous quarter, private investment expenditures had decreased by 4.8 percent. Private investment expenditures have been declining since the last quarter of 2011.
Government expenditures increased in the 3rd quarter
In the first two quarters of 2012, government expenditures contributed small amounts (0.4 and 0.1 percentage points, respectively) to real GDP growth. But, in the third quarter government expenditures increased by 4.9 percent and contributed 0.7 percentage points to growth. It seems that the government is trying to support the economy within constraints of its budget. In the last growth review research brief, we had stated that the low growth rate might increase the pressure on the government to employ expansionary fiscal policies. In the third quarter our prediction was materialized, however, in the last quarter, support from government expenditures might be limited as it has to match a tight budget deficit target.
Growth perspective for the rest of the year
Since the last quarter of 2011, economic growth slowed down due to contraction in domestic demand and clung around 3 percent with the support of net exports. However, in the third quarter, the contribution of net exports significantly declined while private consumption expenditure increased. In the first nine months of 2012, real GDP growth
amounted to 2.6 percent, yearly. Now, third quarter data indicate that once again a period of domestic demand led growth is about to begin, which is a hard-to-manage growth regime for Turkey given its sensitivity to capital flows and exchange rate shocks.
Loose monetary policy by the Central Bank of Turkey since April caused interest rates to decline considerably. Rates on bank loans also decreased. A revival in the credit volume might boost consumption and investment, but it can also cause a surge in import demand and widening in the current account deficit. On the fiscal front, there isn’t much room left for further expansion, since slow growth led to a decrease in tax revenues and jeopardized the budget deficit target. The 3.2 percent annual growth rate projected by the Medium Term Program is simply out of reach.
Figure 3: Quarter-on-quarter real GDP growth rate Source: Turkstat. -1% 1% 3% 5% 7% 2009( 2) 2009( 3) 2009( 4) 2010( 1) 2010( 2) 2010( 3) 2010( 4) 2011( 1) 2011( 2) 2011( 3) 2011( 4) 2012( 1) 2012( 2) 2012( 3)
www.betam.bahcesehir.edu.tr
4
Table 1. Changes in and contributions of GDPcomponents for 2012Q2 and 2012Q3, compared to the previous quarters
2012 – Q3 Change (%) Contribution (pp) Consumption 1.8 1.2 Investment -8.3 -1.7 Government exp. 4.9 0.7 Inventory Inv. -- -1.8 Exports -1.0 -0.3 Imports -2.5 0.7 2011 – Q2 Change (%) Contribution (pp) Consumption -0.5 -0.3 Investment -4.8 -1.0 Government exp. 0.8 0.1 Inventory Inv. -- 1.8 Exports 7.8 2.0 Imports 1.7 -0.5
Source: Turkstat, Betam.
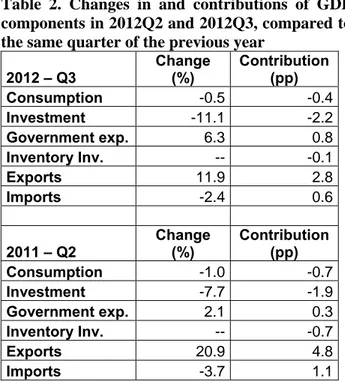
Table 2. Changes in and contributions of GDP components in 2012Q2 and 2012Q3, compared to the same quarter of the previous year
2012 – Q3 Change (%) Contribution (pp) Consumption -0.5 -0.4 Investment -11.1 -2.2 Government exp. 6.3 0.8 Inventory Inv. -- -0.1 Exports 11.9 2.8 Imports -2.4 0.6 2011 – Q2 Change (%) Contribution (pp) Consumption -1.0 -0.7 Investment -7.7 -1.9 Government exp. 2.1 0.3 Inventory Inv. -- -0.7 Exports 20.9 4.8 Imports -3.7 1.1
www.betam.bahcesehir.edu.tr
5
Box 1: Calculation of quarterly GDP growth andcontributions.
Sub-components of GDP are grouped into 3 cate-gories:
1. Final domestic demand consist of final consump-tion expenditure of resident households (Con-sumption), sum of government final consumption and investment expenditure (Government ex-penditure), investment expenditure of private sector (Investment)
2. Net foreign demand for goods and services rep-resents the difference between exports and imports of goods and services.
3. Change in inventories (stocks) shows how stocks changes with compared to previous quarter (for details look Box 2)
In order to find quarterly GDP growth, the following formulation is used for all sub components of GDP separately:
Since X represents 'Change in GDP component' Contribution of X to growth can be calculated as follows:
= (Xt– Xt-1) / GDPt-1
Differences between the methodologies used by Betam and TurkStat in seasonally adjusting the real GDP
Box 2: Change in inventories (stocks) and its contribution to growth
'Stock change' shows that how stocks change compared to previous period
Stock change t = Stock t– Stock t-1
Therefore increase (decrease) in inventories is caused by increase (decrease) in the difference between two period rather than increase (decrease) in stocks. However, TurkStat estimates the change in stocks is as residual between production and expenditure accounts. Moreover this sub-component also includes statistical discrepancy.
Let's say the difference between production and
expenditure account εt-1, 'stock change' in time t is as
follows:
Stock changet = Stock t– Stock t-1 + εt-1
Finally, contribution of change in 'Stock change' can be found as follows:
Contribution of 'Stock change t
= (Stock t– Stock t-1) / GDP t-1
or
Contribution of 'Stock change t
= ((Stock t– Stock t-1 + εt)