PROMISING START IN THE 2
NDQUARTER
Zümrüt İmamoğlu* ve Barış Soybilgen
†Executive Summary
In April, Industrial production index (IPI) increased by 1.0 percent, export volume index increased by 7.6 percent and import volume index decreased by 2.6 percent from March. Economic indicators show that economic growth continues in the second quarter. The volatility in monthly export and import data is high but we expect net exports to continue contributing positively to growth. Betam’s quarter on quarter (QoQ) growth forecast for the second quarter of 2012 is 1.0 percent. The corresponding year on year (YoY) growth rate is 3.3 percent. Our forecasts for the first quarter remain the same as last month.
The trade deficit and the current account deficit continued to decline in April. Due to the high increase in exports, the trade deficit decreased by $2.5 billion and fell to $6.6 billion. In line with the decline in the trade deficit, the current account deficit fell to $5 billion. We expect that the ratio of current account deficit to GDP will fall to 8.3 percent from 9.3 percent at the end of second quarter.
* Dr. Zümrüt İmamoğlu, Betam, Research Associate. [email protected]
† Barış Soybilgen, Betam, Research Assistant,
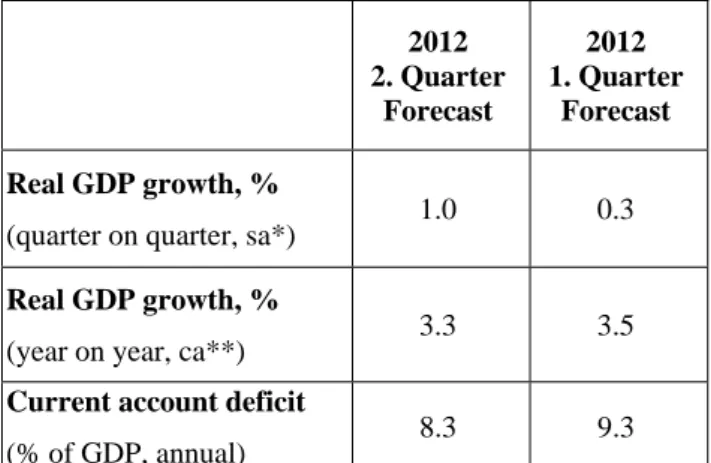
Table 1. Betam’s quarterly and annual growth rate forecasts
O
Source: Betam. *sa: seasonally and calendar day adjusted **ca: calendar day adjusted
2nd Quarter looks more promising
Early economic indicators for the second quarter indicate that economic growth for the second quarter is stronger than the first quarter. In January, IPI fell nearly by 3 percent and could not reach its pre-January level until April, even tough there were small increases in February and March. In April, the first month of the second quarter, IPI increased by 1 percent. The ongoing increase in exports and the ongoing decline in imports increase the contribution of net exports to real GDP. However, it should be noted that the high increase in exports in April was partly caused by gold exports which are temporary. Following the surge in April, exports could decline slightly in
2012 2. Quarter Forecast 2012 1. Quarter Forecast Real GDP growth, %
(quarter on quarter, sa*) 1.0 0.3
Real GDP growth, %
(year on year, ca**) 3.3 3.5
Current account deficit
(% of GDP, annual) 8.3 9.3
Economic Outlook and Forecasts:
June 2012
May. On the other hand, imports may continue to fall. Investment goods imports increased greatly in March, but fell more than that in April. It seems that investment appetite continues to remain low. Finally, the decline in capacity utilization rate (CUR) in May shows that although the economy continues to grow the revival in the second quarter may not be very strong.
Brent type crude oil price decreased by 4.7 percent in April and 7 percent in May (Figure 5). Due to the decline in crude oil price, the fall in inflation in May was greater than expected. The decrease in oil prices helps Turkey’s Central Bank in bringing down the inflation rate closer to the target. On the fiscal policy side though, meeting the budget target is not going to be easy. Indirect tax income is decreasing as imports decrease and high salary increase for civil servants has put extra pressure on the expenditure side.
If economic climate in Europe does deteriorate, Turkish economy can grow around 3 percent in 2012. However, the ongoing uncertainty in Greece and the increase in Spain’s borrowing costs raise uncertainty in Europe.
Consumer goods imports is on the decline
In April compared to the previous month, durable and nondurable consumer goods production increased by 1.0 and 1.1 percent, respectively, and the consumer confidence index increased by 0.5 percent. On the other hand, consumer goods imports continued to fall as it did for the last four months. In April, consumer goods imports decreased by 4.9 percent. In line with the decline
in consumer goods imports, special consumer tax income fell by 1.2 percent. When we evaluated the first quarter consumption indicators, we expect a slight increase in the second quarter compared to the first quarter.
Investment may decrease
In March, investment goods imports increased by 10.1 percent, but decreased by 12.1 percent in April. Furthermore, CUR fell by 0.4 and 1.1 percent points in April and May, respectively. Finally, real sector confidence index decreased by 0.6 and 1.7 percent in April and May, respectively. The decline in these three economic indicators may indicate a fall in private investment expenditure in the second quarter compared to the first quarter.
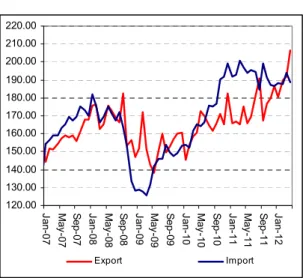
Surge in exports in April
Figure 2 shows monthly changes of seasonally adjusted import and export volume indices. In April, export volume index increased by 7.6 percent and import volume index decreased by 2.6 percent. The surge in exports is promising, but it was mainly caused by exports of metal industry (mainly gold) as it’s seen in Figure 4, which is typically temporary. We expect that net exports will be main engine of economic growth in the second quarter as well.
Current account deficit continues to fall in the second quarter
Following the decline in the trade deficit in April, the current account deficit decreased to $5 billion.
The 7 percent fall in Brent type crude oil price in May will accelerate the decline in the current account deficit. For now, there seems to be no problem in financing the current account deficit. The ongoing crisis in Europe and the slightly rising unemployment ratio in USA will cause the foreign capital to stay in emerging countries. We expect that as the Turkish economy and the demand for imports continue to slowdown, the current account deficit to GDP ratio will fall. At
the end of the second quarter, we expect the current account to GDP ratio to fall down to 8.3 percent (Figure 3).
Table 2. Monthly and quarterly changes of Betam’s selected indicators (real and sa)
Indicators February March April May
2011 4. Quarter 2012 1. Quarter Exports 5.2 1.1 7.6 ** 3.5 10.1 Imports -0.1 3.2 -2.6 ** 0.7 -0.6
Intermediate goods import -1.8 0.6 0.1 ** 1.0 -0.1
Consumer goods import -2.5 -0.4 -4.9 ** -5.3 -6.0
Investment goods import -0.8 10.1 -12.1 ** 6.8 -6.6
Industrial Production Index (IPI) 0.7 0.8 1.0 ** -1.4 1.8
Nondurable consumer goods -1.4 2.4 1.1 ** -0.1 2.3
Durable consumer goods 2.1 -0.8 1.0 ** -2.9 1.2
Intermediate goods -0.3 -0.1 1.8 ** -0.0 1.6
Investment goods 0.3 -3.1 2.1 ** -4.7 0.0
Capacity Utilization Rate (CUR) -1.0 0.2 -0.4 -1.1 0.4 -1.2
Nondurable consumer goods -0.8 0.4 0.3 -0.3 0.8 0.2
Durable consumer goods 1.6 0.7 0.4 -2.2 0.6 0.2
Intermediate goods -0.8 -1.5 0.1 -0.3 -1.2 -1.4
Investment goods -1.8 0.8 0.1 -1.4 -0.5 -0.7
Manufacturing Order Index 1.5 1.3 ** ** 2.4 **
Domestic Orders 2.3 0.6 ** ** 2.0 **
Foreign Orderrs 1.5 1.4 ** ** 2.9 **
Soft Data
Consumer confidence index
(Turkstat) 0.4 0.5 0.5 ** 1.3 0.9
Reel sector confidence index 3.6 1.9 -0.6 -1.7 -0.1 0.9
Financial Data
IMKB 100 (Stock Exchange) 17.4 -1.8 -5.6 -3.2 4.9 -3.4
Other
Special consumer tax* (SCT) 1.7 5.0 -1.2 ** -5.2 2.6
Automobile production 0.4 -10.2 -3.5 ** -8.8 -10.2
Source: TurkStat. TCMB. Treasury. IMKB. Betam. All series are real (or inflation adjusted) wherever necessary and seasonally adjusted.
*This tax is collected on sales of goods such as gas. fuel oils. alcohol. tobacco products and automobiles. **Data not yet released
Figure 1: Capacity utilization rate and industrial production index (sa. left axis for CUR and right axis for IPI)
60 65 70 75 80 85 Ja n-07 Ma y-07 S ep-07 Ja n-08 Ma y-08 S ep-08 Ja n-09 Ma y-09 S ep-09 Ja n-10 Ma y-10 S ep-10 Ja n-11 Ma y-11 S ep-11 Ja n-12 Ma y-12 95 100 105 110 115 120 125 130 135 CUR IPI
Source : TurkStat. Betam
Figure 2: Volume indices of exports and imports (sa) 120.00 130.00 140.00 150.00 160.00 170.00 180.00 190.00 200.00 210.00 220.00 Ja n-07 Ma y-07 S ep-07 Ja n-08 Ma y-08 S ep-08 Ja n-09 Ma y-09 S ep-09 Ja n-10 Ma y-10 S ep-10 Ja n-11 Ma y-11 S ep-11 Ja n-12 Export Import
Source : TurkStat. Betam
Figure 3: Ratio of current account deficit to GDP (yearly)
0.0 2.0 4.0 6.0 8.0 10.0 12.0 2008( 1) 2008( 2) 2008( 3) 2008( 4) 2009( 1) 2009( 2) 2009( 3) 2009( 4) 2010( 1) 2010( 2) 2010( 3) 2010( 4) 2011( 1) 2011( 2) 2011( 3) 2011( 4) 2012( 1) * 2012( 2) *
Source: TCMB. TurkStat. Betam * Betam’s forecasts
Figure 4: Monthly changes of manufacturing industry exports (sa)
Source: TurkStat. Betam
Figure 5. Brent type crude oil price per barrel (USD)
April 2012 -30.00% -20.00% -10.00% 0.00% 10.00% 20.00% 30.00% 40.00% 50.00% F ood pr oduc ts and bev erages T abac co produc ts T ex til e goods C lot hi ng goods F urs leat her and pr oduc ts Wood and co rk produc ts P aper and paper pr oduc ts C ok ing c oal , ref ine d pet . C hem ic al s P las tic and r ubber pro duc ts O ther non-m et allic m in er al p ro d. M et al indus tr y M et al produc ts (not m ac h. ) M ac hi nery and e qui pm ent E lec tr ic al m ac hi nary R adi o, t el ev is ion and c om m . M ot or v ehi cl es and t rai le rs F urni tur e and ot her pr oduc ts March 2011 -5.00% 0.00% 5.00% 10.00% 15.00% 20.00% F ood produc ts and bev erages T abac co produc ts T ex til e goods C lot hi ng goods F urs leat her and produc ts Wood and c or k produc ts P aper and paper produc ts C ok ing c oal , r ef ined pet . C hem ic al s P las tic
and rubber produc
ts O ther non-m et al lic m iner al prod. M et al indus tr y M et al pr oduc ts ( not m ac h. ) M ac hi nery an d equi pm ent E lec tr ic al m ac hi nary R adi o, t el ev is ion and c om m . M ot or v ehi cl es and t rai le rs F ur ni ture and ot her produc ts
0 20 40 60 80 100 120 140 Ja n -0 7 Ap r-0 7 Ju l-0 7 Oc t-0 7 Ja n -0 8 Ap r-0 8 Ju l-0 8 Oc t-0 8 Ja n -0 9 Ap r-0 9 Ju l-0 9 Oc t-0 9 Ja n -1 0 Ap r-1 0 Ju l-1 0 Oc t-1 0 Ja n -1 1 Ap r-1 1 Ju l-1 1 Oc t-1 1 Ja n -1 2 Ap r-1 2 Source: TDM.