Turkey’s GDP Growth to Slow down in the Second Quarter
Zümrüt İmamoğlu* ve Barış Soybilgen
†Executive Summary
According to data released by TurkStat, seasonally adjusted industrial production index (IPI) decreased in April from a month ago by 0.6 percent. Import volume index also decreased by 2.5 percent in April compared to last month. On the other hand, export volume index increased by 6.2 percent in the same period. April data indicates that economic slowdown continues going into the second quarter. Ongoing fall in IPI for the last three months, the decrease in intermediate goods imports and the 1 percentage point drop in capacity utilization rate (CUR) in May all point to a cooling economy.
Betam’s second quarter GDP forecast is pretty low. Betam expects real GDP to rise 0.5 percent in the second quarter from the previous quarter. Betam also forecasts that real GDP will increase 7.1 percent from the same quarter of the previous year.
April’s export and import volume indices make us a bit more optimistic about current account deficit. Also in the summer time, Turkey’s tourism income will tame down the increase in the current account
* Dr. Zümrüt İmamoğlu, Betam, Research Associate. zumrut.imamoglu@bahcesehir.edu.tr
† Barış Soybilgen, Betam, Research Assistant, baris.soybilgen@bahcesehir.edu.tr
deficit to some extent. However, the current account deficit will still remain high monthly compared to 2010 levels. Betam’s annual current account deficit forecast for the end of second quarter is 8.7 percent of GDP.
Table 1. Betam’s quarterly and annual growth rate forecasts
Source: Betam
*sa: seasonally and calendar day adjusted **ca: calendar day adjusted
GDP continues to slow down in the second quarter
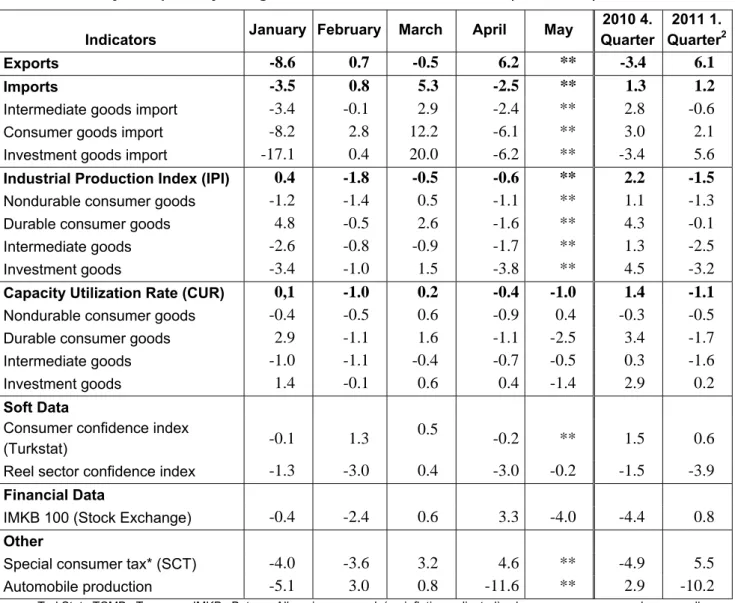
Table 2 lists the monthly indicators Betam follows and their seasonally adjusted monthly and quarterly percentage changes. Our second quarter forecast depends mainly on April data and a limited amount of May data that has been released so far. The table shows that most of the indicators decrease in the second quarter. Deterioration in consumer and real sector confidence index and
First Quarter - 2011 Second Quarter - 2011 Real GDP growth, %
(quarter on quarter, sa*) 1.6 0.5
Real GDP growth, %
(year on year, ca**) 10.6 7.1
Current account deficit
(% of GDP, annual) 7.9 8.7
Economic Outlook and Forecasts:
June 2011
fall in automobile production is notable. The increase in special consumption tax (SCT) revenue is caused mainly by the demand for foreign cars due to an expected tax increase after
the election.1 All sub components of imports fell in
April.
Investment indicators
Most of the indicators associated with investment demand fell in April and May. IPI decreased by 0.6 percent in April and CUR also decreased by 0.4 and 1.0 percentage points in April and May, respectively. Intermediate goods imports fell 2.4 percent in April. Finally, real sector confidence index dropped over 3.0 percent cumulatively in April and May. As Table 2 shows, indicators that Betam use to forecast investment is decreasing and we expect investment to fall in the second quarter in line with these indicators.
Consumption indicators
Consumption indicators are decreasing, although not as prominent as investment indicators, except the Special Consumption Tax (SCT). Consumer goods imports and consumer confidence index decreased 6.1 and 0.2 percent, respectively. However, SCT increased 4.6 percent in April. Betam expects a small increase in consumption for the second quarter.
Foreign trade
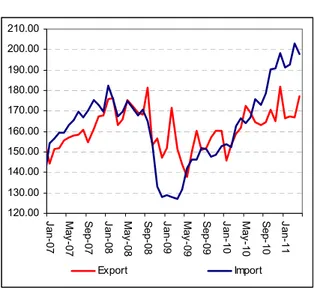
Figure 2 shows monthly changes of seasonally adjusted import and export volume indices. April’s exports and imports volume indices indicated positive signs for the Turkish economy. In April, export volume index increased by 6.2 percent
1
SCT is very high in automobile.
whereas import volume index decreased by 2.5 percent. If exports continue increasing in coming months, net trade contribution to GDP can be positive in the second quarter.
Current account deficit
April’s current account deficit was lower than March but still high; $7.7 billion. However if the decrease in imports continue into May and June, as the tourism income increases in coming months as expected, we will see a decrease in monthly current account deficit figures.
However, annual current account deficit will continue to increase. Betam expects current account deficit to be 8.7 percent of GDP in the end of second quarter. The slowdown in economy will decrease the private sector’s deficit, but this decrease may not be fast enough. Public deficit should also be decreased and as quickly as possible. This can be only achieved through a tighter fiscal policy.
Forecasts
Betam releases its GDP and current account forecasts on a monthly basis and revises its forecasts every month after release of new data. Table 1, summarizes Betam’s year-on-year and quarter-on-quarter forecasts of real GDP growth. We expect the real GDP to grow by 0.5 percent in the second quarter of 2011 from the previous quarter and by 7.1 percent in the second quarter from same quarter of the previous year.
Table 2. Monthly and quarterly changes of Betam’s selected indicators (real and sa)
Indicators January February March April May
2010 4. Quarter 2011 1. Quarter2 Exports -8.6 0.7 -0.5 6.2 ** -3.4 6.1 Imports -3.5 0.8 5.3 -2.5 ** 1.3 1.2
Intermediate goods import -3.4 -0.1 2.9 -2.4 ** 2.8 -0.6
Consumer goods import -8.2 2.8 12.2 -6.1 ** 3.0 2.1
Investment goods import -17.1 0.4 20.0 -6.2 ** -3.4 5.6
Industrial Production Index (IPI) 0.4 -1.8 -0.5 -0.6 ** 2.2 -1.5
Nondurable consumer goods -1.2 -1.4 0.5 -1.1 ** 1.1 -1.3
Durable consumer goods 4.8 -0.5 2.6 -1.6 ** 4.3 -0.1
Intermediate goods -2.6 -0.8 -0.9 -1.7 ** 1.3 -2.5
Investment goods -3.4 -1.0 1.5 -3.8 ** 4.5 -3.2
Capacity Utilization Rate (CUR) 0,1 -1.0 0.2 -0.4 -1.0 1.4 -1.1
Nondurable consumer goods -0.4 -0.5 0.6 -0.9 0.4 -0.3 -0.5
Durable consumer goods 2.9 -1.1 1.6 -1.1 -2.5 3.4 -1.7
Intermediate goods -1.0 -1.1 -0.4 -0.7 -0.5 0.3 -1.6
Investment goods 1.4 -0.1 0.6 0.4 -1.4 2.9 0.2
Soft Data
Consumer confidence index
(Turkstat) -0.1 1.3
0.5
-0.2 ** 1.5 0.6
Reel sector confidence index -1.3 -3.0 0.4 -3.0 -0.2 -1.5 -3.9
Financial Data
IMKB 100 (Stock Exchange) -0.4 -2.4 0.6 3.3 -4.0 -4.4 0.8
Other
Special consumer tax* (SCT) -4.0 -3.6 3.2 4.6 ** -4.9 5.5
Automobile production -5.1 3.0 0.8 -11.6 ** 2.9 -10.2
Source: TurkStat, TCMB, Treasury, IMKB, Betam. All series are real (or inflation adjusted) wherever necessary and seasonally adjusted.
*This tax is collected on sales of goods such as gas, fuel oils, alcohol, tobacco products and automobiles. **Data not yet released
2
Figure 1: Capacity utilization rate and industrial production index (sa, left axis for CUR and right axis for IPI)
60 65 70 75 80 85 Ja n-07 Ap r-07 Ju l-0 7 Oct -0 7 Ja n-08 Ap r-08 Ju l-0 8 Oct -0 8 Ja n-09 Ap r-09 Ju l-0 9 Oct -0 9 Ja n-10 Ap r-10 Ju l-1 0 Oct -1 0 Ja n-11 Ap r-11 95 100 105 110 115 120 125 130 CUR IPI
Source : TurkStat, Betam
Figure 2: Volume indices of exports and imports (sa) 120.00 130.00 140.00 150.00 160.00 170.00 180.00 190.00 200.00 210.00 Jan-07 May -07 S ep-07 Jan-08 May -08 S ep-08 Jan-09 May -09 S ep-09 Jan-10 May -10 S ep-10 Jan-11 Export Import
Source : TurkStat, Betam
Figure 3: Ratio of current account deficit to GDP (yearly)
Current Account Deficit (% of GDP)
0.0
1.0
2.0
3.0
4.0
5.0
6.0
7.0
8.0
9.0
10.0
2007(
Q
4)
2008(
Q
1)
2008(
Q
2)
2008(
Q
3)
2008(
Q
4)
2009(
Q
1)
2009(
Q
2)
2009(
Q
3)
2009(
Q
4)
2010(
Q
1)
2010(
Q
2)
2010(
Q
3)
2010(
Q
4)
2011(
Q
1)
*
2011(
Q
2)
*
Source: TCMB, TurkStat, Betam * Betam’s forecasts
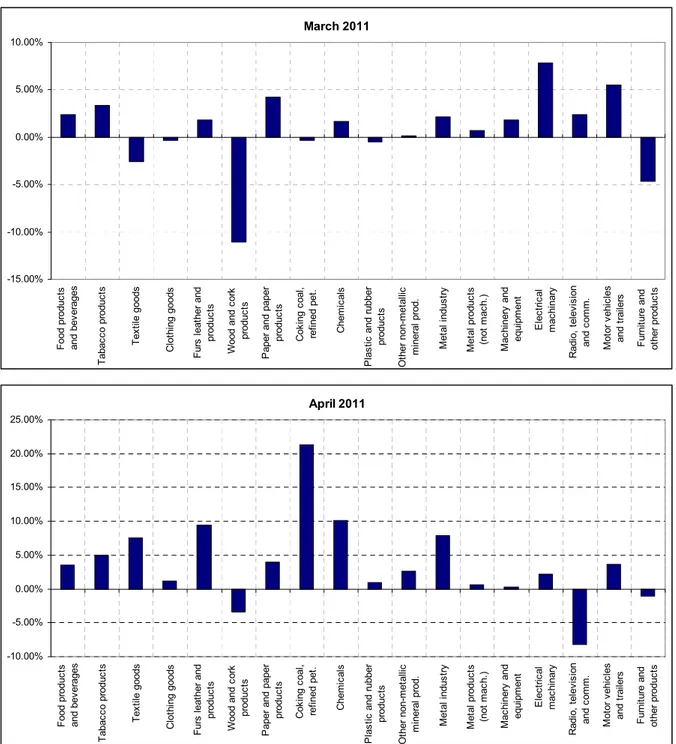
Figure 4: Monthly changes of manufacturing industry exports (sa) March 2011 -15.00% -10.00% -5.00% 0.00% 5.00% 10.00% F ood p roduc ts and bev erages T abac co produc ts T ex til e g oods C lot hi ng goods F ur s l eat her and produc ts W ood and c ork produc ts P aper an d pap er produc ts C ok ing c oal , re fine d pe t. C hem ic al s P las tic and r ubb er pr od uc ts O ther non-m et al lic m ineral prod. M et al indus tr y M et al p roduc ts (not m ac h. ) M ac hi ner y and equi pm ent E lec tr ic al ma ch in ar y R adi o, t el ev is ion and c om m . M ot or v ehi cl es and t rai le rs F urni ture and ot her p roduc ts April 2011 -10.00% -5.00% 0.00% 5.00% 10.00% 15.00% 20.00% 25.00% F oo d pr oduc ts and b ev er ag es T abac co pr odu ct s T ex til e goods C lot hi ng goods F ur s l eat her and pr oduc ts Wood and co rk pr oduc ts P aper and paper pr oduc ts C oki ng co al , re fined pet . C hem ic al s P las tic and rubber pr oduc ts O the r no n-m et al lic m iner al pr od. Me ta l in du st ry M et al pr oduc ts (not m ac h. ) M ac hi ner y and equ ip m ent E lec tr ic al m ac hi nar y R ad io , t el evi si on and c om m . M ot or v ehi cl es and t rai le rs F urn iture an d ot her pr oduc ts