LARGE INCREASE IN UNEMPLOYMENT Seyfettin Gürsel*Mine Durmazand Melike Kökkızıl
Abstract
Seasonally adjusted labor market data shows that non-agricultural unemployment rate has reached 11.5 percent, increasing by 0.4 percentage points in the period of May 2014 compared to the period of April 2014. During the same period, non-agricultural employment decreased by 11 thousand while non-agricultural labor force increased by 91 thousand. Employment in construction and industrial sectors decreased by 45 thousand and 9 thousand, respectively. However, employment in services expanded by 41 thousand. Data on the month of May, which covers April-May-June months, reveals that unemployment is increasing parallel to the slowdown in economic growth in second quarter of the year. According to our forecasting based on Kariyer.net data, unemployment rate will continue to increase in the period of June 2014.
The decrease in employment
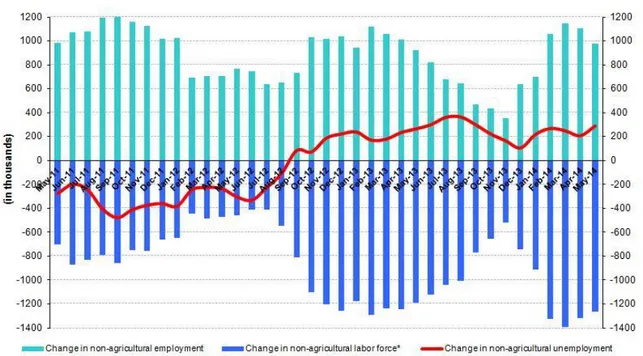
According to data released by TurkStat, non-agricultural labor force increased by 1 million 267 thousand (5.8 percent) and non-agricultural employment increased by 978 thousand (5 percent) in the period of May 2014 compared to the same period in the previous year (Figure 1). Consequently, the number of persons unemployed in non-agricultural sectors increased by 289 thousand. Annual changes are affected by the revisions introduced in February 2014. Nevertheless, the decline in employment compared to the same period in the previous year is remarkable.
Figure 1 Year-on-year changes in non-agricultural labor force, employment, and unemployment
Source: TurkStat,Betam
*Prof. Dr. Seyfettin Gürsel, Betam, Director, [email protected]
Mine Durmaz, Betam, Research Assistant, [email protected] Melike Kökkızıl, Betam, Research Assistant , [email protected]
Labor Market Outlook:
August 2014
www.betam.bahcesehir.edu.tr
2
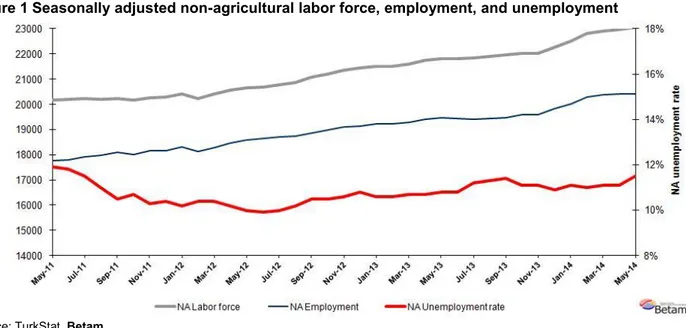
Large increase in non-agricultural unemployment by 0.4 percent pointsAccording to seasonally adjusted data, non-agricultural labor force increased by 91 thousand in the period of May 2014 compared to the period of April 2014, and reached 23 million 49 thousand (Figure 2, Table 1). Non-agricultural employment decreased by 11 thousand and reached 20 million 398 thousand. Hence, the number of persons unemployed in non-agricultural sectors increased by 102 thousand and non-agricultural unemployment rate increased by 0.4 percentage point compared to the period of April 2014 and reached 11.5 percent in the period of May 2014.
Figure 1 Seasonally adjusted non-agricultural labor force, employment, and unemployment
Source: TurkStat,Betam
Unemployment will keep increasing in the period of June 2014
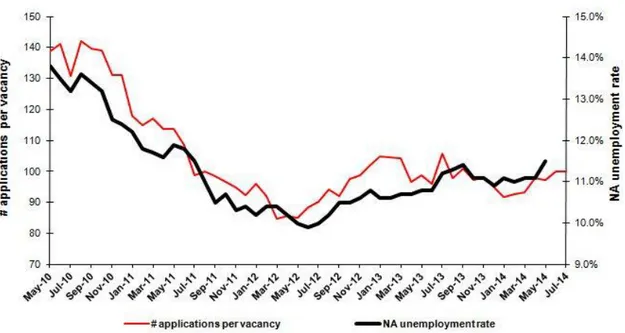
Our calculations based on the seasonally adjusted application per vacancy statistics calculated using Kariyer.net1 series indicate that we accurately predicted the direction of unemployment for the last two periods. The Kariyer.net series also indicates that non-agricultural unemployment might slightly increase in the period of April 2014. Also, in parallel with our expectations large increase in unemployment is recorded in the month of May, 2014.
Application per vacancy series, released by Kariyer.net, seen in the Figure 3 are used in the forecasting model. The series, which show an increasing trend since the month of January 2014, point out an increase in the unemployment rate in the period of June 2014 as well as in the period of May 2014. According to the results of our model, unemployment will increase in the period of June 2014 as it did in May 2014. 2 Betam's forecasts and current economic indicators show that economic growth significantly slowed down in the second quarter compared to first quarter of this year. Hence, our unemployment forecasting by using Kariyer.net series reveals that this slowdown will keep reflecting on the unemployment rate.
1 Betam has been calculating application per vacancy using series released by Kariyer.net for a while. Seasonal and calendar adjustment
procedure is applied to application per vacancy series. A decrease in applications per vacancy may be caused by an increase in vacancies or by a decrease in the number of applications. An increase in vacancies signals economic growth while decreasing number of applications indicates a decrease in number of people looking for a job. Monthly labor market series released by TurkStat is the average of three months. Therefore, application per vacancy statistics calculated using Kariyer.net series is the average of three months as well.
2For detailed information on Soybilgen's forecasting model, please see Betam Research Brief 168 titled as "Kariyer.net Verisiyle Kısa Vadeli Tarım Dışı İşsizlik Tahmini"
Figure 2 Seasonally adjusted non-agricultural unemployment rate and application per vacancy
Source: Kariyer.net, TurkStat, Betam
Employment in manufacturing and construction sectors decreased
According to seasonally adjusted labor market series, in the period of May 2014 deceleration in the employment rise for service sector was observed and employment in this sector increased by 41 thousand (Figure 4, Table 2).3 The decline in construction sector employment remained unchanged since March 2014. Furthermore, employment in this sector decreased by 45 thousand in the period of May 2014. Also, in this period employment in manufacturing sector, where slight employment expansion has been recorded in previous two periods, started to fall and employment decreased by 9 thousand. Employment in services moves parallel to the manufacturing production index, which stagnated in the second quarter. Geopolitical risks related to third quarter of the year and decreasing export to Iraq signals that movements in manufacturing employment will be weak.
3Employment in each sector is seasonally adjusted separately. Hence the sum of these series may differ from the seasonally adjusted series of total employment. The difference stems from the non-linearity of the seasonal adjustment process.
www.betam.bahcesehir.edu.tr
4
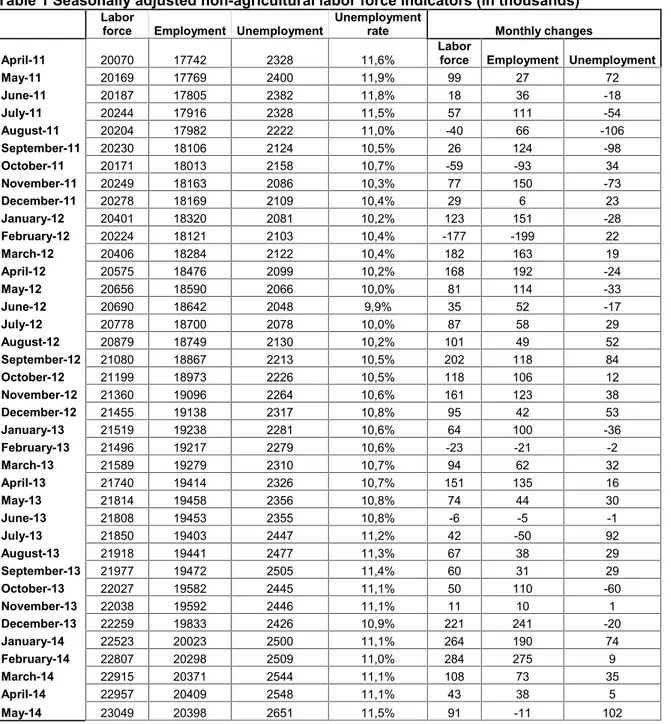
Figure 3 Employment by sectors (in thousands)Table 1 Seasonally adjusted non-agricultural labor force indicators (in thousands)*
Labor
force Employment Unemployment Unemploymentrate Monthly changes
April-11 20070 17742 2328 11,6% Laborforce Employment Unemployment
May-11 20169 17769 2400 11,9% 99 27 72 June-11 20187 17805 2382 11,8% 18 36 -18 July-11 20244 17916 2328 11,5% 57 111 -54 August-11 20204 17982 2222 11,0% -40 66 -106 September-11 20230 18106 2124 10,5% 26 124 -98 October-11 20171 18013 2158 10,7% -59 -93 34 November-11 20249 18163 2086 10,3% 77 150 -73 December-11 20278 18169 2109 10,4% 29 6 23 January-12 20401 18320 2081 10,2% 123 151 -28 February-12 20224 18121 2103 10,4% -177 -199 22 March-12 20406 18284 2122 10,4% 182 163 19 April-12 20575 18476 2099 10,2% 168 192 -24 May-12 20656 18590 2066 10,0% 81 114 -33 June-12 20690 18642 2048 9,9% 35 52 -17 July-12 20778 18700 2078 10,0% 87 58 29 August-12 20879 18749 2130 10,2% 101 49 52 September-12 21080 18867 2213 10,5% 202 118 84 October-12 21199 18973 2226 10,5% 118 106 12 November-12 21360 19096 2264 10,6% 161 123 38 December-12 21455 19138 2317 10,8% 95 42 53 January-13 21519 19238 2281 10,6% 64 100 -36 February-13 21496 19217 2279 10,6% -23 -21 -2 March-13 21589 19279 2310 10,7% 94 62 32 April-13 21740 19414 2326 10,7% 151 135 16 May-13 21814 19458 2356 10,8% 74 44 30 June-13 21808 19453 2355 10,8% -6 -5 -1 July-13 21850 19403 2447 11,2% 42 -50 92 August-13 21918 19441 2477 11,3% 67 38 29 September-13 21977 19472 2505 11,4% 60 31 29 October-13 22027 19582 2445 11,1% 50 110 -60 November-13 22038 19592 2446 11,1% 11 10 1 December-13 22259 19833 2426 10,9% 221 241 -20 January-14 22523 20023 2500 11,1% 264 190 74 February-14 22807 20298 2509 11,0% 284 275 9 March-14 22915 20371 2544 11,1% 108 73 35 April-14 22957 20409 2548 11,1% 43 38 5 May-14 23049 20398 2651 11,5% 91 -11 102
6
Table 2 Seasonally adjusted employment by sectors (in thousands) *Agriculture Manufacturing Construction Service Monthly changes
April-11 5359 4958 1633 11150 Agriculture Manufacturing Construction Service
May-11 5313 4915 1663 11192 -46 -43 30 42 June-11 5362 4826 1677 11301 49 -89 14 109 July-11 5379 4846 1703 11367 17 20 26 66 August-11 5441 4816 1758 11408 62 -30 55 41 September-11 5374 4866 1760 11480 -67 50 2 72 October-11 5409 4823 1680 11510 35 -43 -80 30 November-11 5403 4870 1671 11622 -6 47 -9 112 December-11 5329 4873 1637 11659 -74 3 -34 37 January-12 5336 4864 1710 11745 7 -9 73 86 February-12 5283 4808 1566 11746 -53 -56 -144 1 March-12 5232 4850 1581 11853 -51 42 15 107 April-12 5260 4930 1656 11890 28 80 75 37 May-12 5306 4908 1731 11951 46 -22 75 61 June-12 5249 4900 1740 12001 -57 -8 9 50 July-12 5247 4926 1732 12041 -2 26 -8 40 August-12 5240 4892 1760 12097 -7 -34 28 56 September-12 5306 4911 1777 12179 66 19 17 82 October-12 5350 4917 1782 12274 44 6 5 95 November-12 5360 5003 1803 12289 10 86 21 15 December-12 5346 5051 1779 12309 -14 48 -24 20 January-13 5335 5073 1815 12350 -11 22 36 41 February-13 5308 5023 1805 12389 -27 -50 -10 39 March-13 5296 5083 1790 12406 -12 60 -15 17 April-13 5288 5176 1812 12425 -8 93 22 19 May-13 5230 5200 1759 12499 -58 24 -53 74 June-13 5180 5163 1773 12516 -50 -37 14 17 July-13 5176 5146 1722 12536 -4 -17 -51 20 August-13 5192 5117 1749 12574 16 -29 27 38 September-13 5189 5096 1775 12600 -3 -21 26 26 October-13 5106 5090 1850 12643 -83 -6 75 43 November-13 5068 5064 1806 12721 -38 -26 -44 78 December-13 5058 5131 1899 12803 -10 67 93 82 January-14 5407 5232 1954 12838 349 101 55 35 February-14 5545 5359 2022 12917 138 127 68 79 March-14 5623 5365 1989 13017 78 6 -33 100 April-14 5593 5373 1915 13122 -30 8 -74 105 May-14 5598 5364 1870 13163 5 -9 -45 41