THE ROLE OF ECONOMIC SIZE AND DISTANCE IN TURKEY’S
EXPORTS
Zümrüt İmamoğlu* and Barış Soybilgen†
Executive Summary
The high trade deficit stands out as one of the important problems of Turkey. Especially during the boom periods, trade deficit increases immensely and restricts the growth potential of the Turkish economy. Although a large share of the trade deficit is caused by energy related imports, still Turkey’s exports have to cover its imports in order to prevent the current account deficit from reaching unsustainable levels. In this research brief, we analyze Turkey’s export potential to its trading partners’ with respect to economic size and distance during two time periods; before and after the global crisis.
Our analysis show that Turkey’s exports to Japan, India, some North and East European countries as well as Greece are way below its potential. On the other hand, Turkey’s exports to countries with which Turkey has a high trade deficit, such as Russia, China, US and Germany, are above its potential. Without any structural changes in the economy, exports to countries with a potential gap may be increased, but Turkey’s export potential in new markets is smaller than anticipated. For a sizable increase in exports, Turkey needs to implement structural reforms that will strengthen its competitiveness and enhance the variety of its exports, without delay.
Countries with which Turkey has a high trade deficit
Turkey has the highest trade deficit with Russia, China and Germany followed by Iran based on average imports and exports over years 2002-2008. The primary reason for high trade deficit with Russia and Iran is imports of energy related products such as natural gas and oil. With China though, the share of energy imports within the total imports is low but still the trade deficit has been increasing since 2002, so much so that in 2011, Turkey’s trade deficit with China exceeded the trade deficit with Russia and ranked number one. Lately, imports from USA have been increasing significantly as well. The size of Turkey’s trade deficit with the US was ranked 10th on average during the pre-crisis period (2002-2008), but it jumped to
3rd place after the crisis (2010-2011) (Table 1 and Table 2).
It’s not surprising that fast growing countries like China increase their shares in Turkey’s total imports. Initially, Turkey’s imports from China were mainly textile and textile related products. However as of 2011, Turkey mainly imports electronic goods from China. From the US, imports of metallic ores, metal scrap, sea and air travel vehicles and their parts increased significantly in 2011. Due to rapid development of air transportation in Turkey, a great
* Dr. Zümrüt İmamoğlu, Betam, Research Associate. [email protected]
† Barış Soybilgen, Betam, Research Assistant, [email protected]
1
Research Brief 12/135
number of airplanes have been bought by Turkish airline companies in the last years and this contributed significantly to the increasing trade deficit with the US.
Regardless of the source of imports, Turkey has to increase its exports to balance its growing trade deficit. One of the popular claims nowadays is that Turkey can increase its exports by exporting more to distant markets that it has been avoiding so far or has less connections with. In this research brief we ask the question whether there are such markets, i.e., large and unexplored or neglected by Turkish exporters and can exporting more to these countries help decrease Turkey’s trade deficit.
Turkey’s estimated export potential
Empirical studies on international trade show that trade between countries are positively correlated with economic size and negatively correlated with the distance between countries. Besides these two factors, trade between countries is affected by sharing a common border, being members of the same customs union, having free trade agreements and having similar economic structure. Studies also show that trade between countries can be affected by cultural factors such as speaking a common language, having similar religious beliefs or sharing similar cultural traits. In the literature all these factors are shown to explain the magnitude of trade between countries to some extent.1 But, economic size and distance seem to be the most
important factors.
In this research brief, we analyze exports of Turkey to its trading partners using a similar methodology. We factor in economic size, distance, having common borders and customs union membership with the EU. We run a regression where the dependent variable is average of Turkey’s exports to each trading partner before crisis, over 2002-2008, and the independent variables are average GDP of Turkey’s trading partners over the same period, and the distance between their capital and Ankara. Border and customs union dummies are also added but they turn out to be statistically insignificant.2 The coefficients from this regression are used to
calculate export potential for two time periods; the pre-crisis period, 2002-2008, and the post-crisis period, 2010-2011. There are two reasons for this partition of the time periods. First is to avoid the crisis period which could alter the results significantly, second is that after the global crisis, there was a compositional change in Turkey’s export destinations. Share of Middle East and North Africa in Turkey’s exports increased whereas share of European Union decreased. We calculate the model implied exports for the two periods separately and compare with actual imports before and after the crisis. We try to understand whether the change in composition of Turkey’s export destinations stemmed from taking advantage of already existing potential gaps between actual exports and model implied exports.
Figures 1 and 2 compare the model implied exports (what we call potential exports) with actual exports. Figure 1 shows the countries (high-export group) to which Turkey’s exports are more than $1 billion in value annually on average and Figure 2 shows countries (mid-export group) to which Turkey’s (mid-exports are between $200 million and $1 billion annually on average. In Figures 3-6 Turkey’s exports are classified by geographic regions (Middle East, Latin America, Asia and East Europe, respectively). The 45 degree lines in the figures show the points where potential and actual exports are exactly equal. The points above (below) the
1 Related studies are listed in the reference section.
2 Details of the model are shown in the Appendix. Customs union dummy and common border dummy are insignificant in our econometric model, so we use the regression coefficients that does not incorporate these in calculating potential exports.
45 degree line show the countries to which exports are more (less) than what the model predicts. Turkey’s exports to countries that are more distant horizontally to the 45 degree line are the ones that the model fails to explain well. Factors other than economic size and distance must be important in accounting for exports to these countries such as political or cultural issues or lack of (or excess of) networking and connections.
Countries to which Turkey exports below its potential
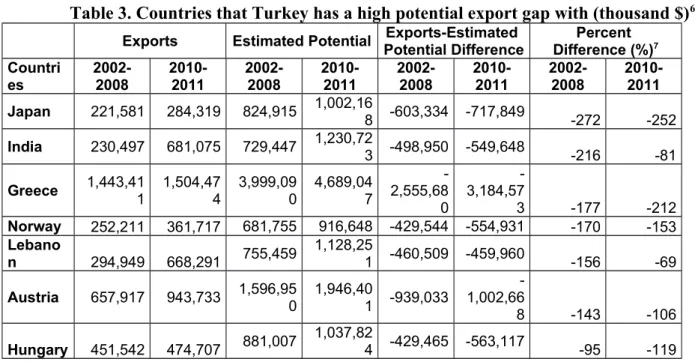
To the high-export group (Figure 1), Turkey mainly exports more than what the model implies besides a few exceptions. The most interesting case is Greece. According to regression results, hypothetically Turkey’s exports to a country which has the same economic size and same distance to Turkey as Greece should be 3.5 times greater than the actual exports to Greece. Turkey’s exports to Greece are significantly lower than what’s implied by our model for the pre-crisis period. Moreover, Turkey’s exports to Greece after crisis on average did not increase much and remained almost at the same level as in the pre-crisis period. Therefore, the potential export gap with Greece is still large and important in magnitude (Figure 1b and Table 3).
In the mid-export group, there are many countries to which actual exports are below or above the model implied levels (Figure 2a, 2b). In this group, the most interesting cases are India and Japan. Regression results show that the model implied exports to India are 3 times higher than the actual exports and to Japan they are almost 4 times higher than the actual exports. Exports to some Eastern European countries are also significantly below potential such as Austria and Hungary. Estimated potential exports to Austria and Hungary are nearly 2 times higher than the actual. Exports to two Northern European countries, Norway and Finland are also below potential according to the model, but the model implied exports to both countries are quantitatively small (Table 3).
With some countries, there were potential export gaps in the pre-crisis period but closed after the crisis due to large increases in exports to these countries (Table 4). In the Middle East (Figure 3a, 3b), Lebanon and Israel were the leading countries in terms of potential export gap in the pre-crisis period, but after the crisis potential export gaps narrowed down significantly. Potential export gap with countries like Syria, Egypt and Iran disappeared completely after the crisis because exports to Syria and Iran increased threefold and exports to Egypt increased by about four times.3 Part of these increases was due to exporters’ shift in focus from the
depressed European market towards the Middle Eastern market after the crisis. But, Turkey’s so called “zero problems with neighbors” foreign policy which led to improvements in political relations during the AK party’s second term in office also gave a push for more trade and helped increase exports. Among Turkey’s Eastern European trade partners, potential exports with Poland were 2 times higher than actual during the pre-crisis period, but after the crisis, the potential export gap reduced to only 50 percent of actual exports.
The search for new export markets after the crisis led to increases in Turkey’s exports to distant countries such as South Korea, Brazil and China as well. After the crisis, implied export gaps with these countries turned to surpluses (Table 3). However, during this period imports also increased and Turkey’s trade deficit with China and South Korea surged (Table 1). It is clear that the trade deficit with these countries are not stemming from Turkey being unable to fill its export potential but rather from increasing demand for imports.
3 Due to political instability in Syria, trade with this country has been severely impeded recently.
Countries to which Turkey exports above its potential
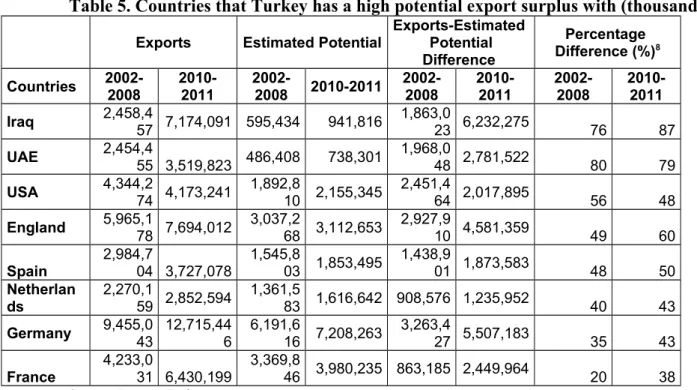
Exports to many of Turkey’s top export destinations are already above those implied by the model. The leading countries in this group are Germany, United Kingdom, USA, United Arab Emirates (UAE) and Iraq. In 2010-2011, the potential surplus with these countries except Iraq did not change much. Potential exports to Iraq increased twofold from 2002-2008 to 2010-2011 whereas actual exports in the same time increased 2.8 times. Turkey’s potential and actual exports to Iraq significantly increased after the crisis as political stability was regained after the war and Iraq’s political and economical ties with Turkey started to improve.
The potential exports to Turkey’s long term trading partners relative to actual exports were mostly stable for Spain, Netherlands, Italy, Russia and United Arab Emirates (Table 4).4 We
do not expect to see large changes in exports to these countries as long as there aren’t any structural changes in the Turkish economy. Changes in potential exports relative to actual exports to other big trading partners, such as Germany and France, are not large either but because exports to these countries are large in quantity, even a small change in relative terms matters in absolute terms. Therefore, we can say that large export markets never lose their importance.
Export potential is limited in new markets
In this research brief, we analyzed Turkey’s exports to its trading partners depending on economic size and distance. Besides economic size and distance, there can be other factors that affect Turkey’s exports to other countries.5 Potential export gap with some markets may
be explained by lack of information and communication relating to these markets. On the other hand, extensive networks and high Turkish population in some countries can cause actual exports to exceed potential exports. Product mismatch, the difference between the types of goods that Turkey exports and what its partners demand, is another potential explanation for exports to remain below potential.
Regression results show that Turkey exports more than the potential implied by the model to countries with which Turkey has high trade deficit. Moreover, export surge to Iraq, Iran, Syria and Egypt in recent years pushed actual exports above potential exports to these countries in the period after the crisis. Exports to these countries may still increase more but one should not expect large changes. The leading countries with which Turkey still has a potential gap are Japan, India and some East European economies. However, these countries are either small or distant to Turkey so potential export gap is relatively small. In other words, there appears to be no sign of undiscovered distant export markets on the horizon.
Under current economic structure, Turkey has a lower export potential in new markets than anticipated. To increase its exports e.g. to meet its target of $500 billion of exports by 2023, Turkey needs to have a more competitive export sector that produces a greater variety of goods. Best way of doing that is increasing productivity and spending more on research and development. Implementation of structural reforms that will foster competitiveness in Turkey is crucial. Reforms that will lower down labor costs should be implemented without delay and educational reforms are needed to increase skills and productivity of the labor workforce which currently is highly undereducated by international standards.
4 Export volume to these countries is high. Therefore, relative small changes in exports to these countries make large differences in absolute numbers, but these large changes shouldn’t be interpreted as structural shifts. 5 Turkey’s political and historical past with Greece might have some impact on trade.
Table 1. Top 10 countries with which Turkey has a trade deficit (thousand $)
Countries (2002-2008, average) CountriesTrade deficit (2010-2011, average)Trade deficit
Russia -11.819.667 Russia -17.466.344
China -7.002.505 China -17.069.325
Germany -3.922.016 USA -10.003.029
Iran -3.074.792 Germany -7.551.615
Switzerland -3.015.310 Iran -6.736.315
South Korea -2.773.855 South Korea -5.114.866
Japan -2.654.567 Italy -4.616.268
Italy -2.170.120 India -4.273.213
Ukraine -2.031.743 Japan -3.496.440
France -1.969.493 Ukraine -2.827.279
Source: Betam, Turkstat.
Table 2. Top 10 countries with which Turkey has a trade surplus (thousand $)
Countries (2002-2008, average) CountriesTrade deficit (2010-2011, average)Trade deficit Iraq 2,353,929 Iraq 7,053,659
UAE 2,152,040 England 2,433,399
England 1,561,653 UAE 2,345,883
Greece 699,327 Azerbaijan 1,549,948
Saudi Arabia 594,382 Egypt 1,350,530
Israel 573,518 Syria 1,332,761
Azerbaijan 501,907 Libya 1,057,313
Syria 344,258 Turkmenistan 927,092
Morocco 303,363 Saudi Arabia 799,495
Libya 303,209 Georgia 628,292
Source: Betam, Turkstat.
Table 3. Countries that Turkey has a high potential export gap with (thousand $)6
Exports Estimated Potential Potential DifferenceExports-Estimated Difference (%)Percent 7
Countri es 2002-2008 2010-2011 2002-2008 2010-2011 2002-2008 2010-2011 2002-2008 2010-2011 Japan 221,581 284,319 824,915 1,002,168 -603,334 -717,849 -272 -252 India 230,497 681,075 729,447 1,230,723 -498,950 -549,648 -216 -81 Greece 1,443,411 1,504,474 3,999,090 4,689,047 2,555,68 -0 -3,184,57 3 -177 -212 Norway 252,211 361,717 681,755 916,648 -429,544 -554,931 -170 -153 Lebano n 294,949 668,291 755,459 1,128,251 -460,509 -459,960 -156 -69 Austria 657,917 943,733 1,596,950 1,946,401 -939,033 -1,002,66 8 -143 -106 Hungary 451,542 474,707 881,007 1,037,824 -429,465 -563,117 -95 -119
6 In tables, 2010-2011 average and 2002-2008 average are used. 7 Percent Difference = (Exports-Potential Exports)/Exports
Poland 920,015 1,631,293 1,584,409 2,202,382 -664,394 -571,089 -72 -35 Source: Betam, Turkstat.
Table 4. Countries for which the potential export gap closes down after the crisis (thousand $)7
Exports Estimated Potential Potential Difference Exports-Estimated Difference (%)Percent 8
Countries 2002-2008 2010-2011 2002-2008 2010-2011 2002-2008 2010-2011 2002-2008 2010-2011 South Korea 124,526 416,065 264,563 326,356 -140,037 89,710 -112 22 Egypt 695,874 2,504,872 1,235,218 2,265,917 -539,344 238,955 -78 10 Syria 592,305 1,727,331 857,159 1,403,064 -264,855 324,267 -45 19 Brazil 134,540 749,011 187,250 376,268 -52,710 372,743 -39 50 China 697,710 2,367,901 803,468 1,694,338 -105,758 673,563 -15 28 Iran 1,018,796 3,316,936 1,097,645 1,950,368 -78,849 1,366,568 -8 41 Source: Betam, Turkstat.
Table 5. Countries that Turkey has a high potential export surplus with (thousand $)7
Exports Estimated Potential Exports-Estimated Potential Difference Percentage Difference (%)8 Countries 2002-2008 2010-2011 2002-2008 2010-2011 2002-2008 2010-2011 2002-2008 2010-2011 Iraq 2,458,457 7,174,091 595,434 941,816 1,863,023 6,232,275 76 87 UAE 2,454,455 3,519,823 486,408 738,301 1,968,048 2,781,522 80 79 USA 4,344,274 4,173,241 1,892,810 2,155,345 2,451,464 2,017,895 56 48 England 5,965,178 7,694,012 3,037,268 3,112,653 2,927,910 4,581,359 49 60 Spain 2,984,704 3,727,078 1,545,803 1,853,495 1,438,901 1,873,583 48 50 Netherlan ds 2,270,159 2,852,594 1,361,583 1,616,642 908,576 1,235,952 40 43 Germany 9,455,043 12,715,446 6,191,616 7,208,263 3,263,427 5,507,183 35 43 France 4,233,0 31 6,430,199 3,369,8 46 3,980,235 863,185 2,449,964 20 38 Source: Betam, Turkstat.
0 2,000 4,000 6,000 8,000 10,000 0 2,000 4,000 6,000 8,000 10,000
2002 - 2008
DEU GBR ITA GRC USA FRA RUS IRQ BAE ROU ISR ESP Potansiyel IRN NLD 0 2,000 4,000 6,000 8,000 10,000 12,000 0 2,000 4,000 6,000 8,000 10,000 12,0002010 - 2011
DEU GBR ITA GRC USA FRA RUS IRQ BAE ROU ISR ESP Potansiyel IRN NLD 0 500 1,000 1,500 0 500 1,000 1,5002002 - 2008
FIN JPN IND CZE LBN NOR UKR SYR AZE CHN Potansiyel DZA EGY CHE SWE AUT POL HUN KWT LBY 0 500 1,000 1,500 2,000 2,500 0 500 1,000 1,500 2,000 2,5002010 - 2011
LBY FIN JPN AZE CZE LBN NORHUN KWT UKR Potansiyel DZA CHE POL AUT EGY CHN SYR SWE INDFigures 1a and 1b. Potential Exports-Actual Exports (High Export Group, Million $)
Source: Betam, Turkstat. Notes: The vertical (Y) axis shows actual exports and the horizontal axis (X) shows model implied exports. Countries to which exports are above $1 billion in 2002-2008. Country ISO Codes: Germany (DEU), Italy (ITA), Greece (GRC), Great Britain (GBR), France (FRA), United States of America (USA), Russia (RUS), Spain (ESP), Romania (ROU), Israel (ISR), Iraq (IRQ), United Arab Emirates (BAE), Iran (IRN), The Netherlands (NLD).
Figures 2a and 2b. Potential Exports-Actual Exports (Middle Export Group, Million $)
Source: Betam, Turkstat. Notes: Vertical (Y) axis shows actual exports and horizontal axis (X) shows model implied exports. Countries to which exports are between $1000-$200 million in 2002-2008. Country ISO Codes: Poland (POL), Austria (AUT), Egypt (EGY), Switzerland (CHE), Ukraine (UKR), Sweden (SWE), China (CHN), Syria (SRY), Hungary (HUN), Lebanon (LBN), Japan (JPN), India (IND), Norway (NOR), Finland (FIN), Czech Republic (CZE), Kuwait (KWT), Libya (LBY), Azerbaijan (AZE), Algeria (DZA), Turkmenistan (TKM).
0 500 1,000 1,500 2,000 2,500 0 500 1,000 1,500 2,000 2,500
2002 - 2008
IRQ BAE ISR EGY IRN SAU KWT AZE SYR LBN DZA Potansiyel 0 1,000 2,000 3,000 4,000 5,000 6,000 7,000 0 1,000 2,000 3,000 4,000 5,000 6,000 7,0002010 - 2011
IRQ BAE ISR EGY IRN SAU AZE SYR LBN DZA Potansiyel 0 50 100 150 200 0 50 100 150 2002002 - 2008
MEX BRA COL VEN CHL ARG BHS PAN Potansiyel 0 100 200 300 400 500 600 700 0 100 200 300 400 500 600 7002010-2011
PER CHL VEN PAN ARG MEX Potansiyel BRA COLFigures 3a and 3b. Potential Exports-Actual Exports (Middle East and North Africa, Million $)
Source: Betam, Turkstat. Notes: Vertical (Y) axis shows actual exports and horizontal axis (X) shows model implied exports. Country ISO Codes: United Arab Emirates (BAE), Iraq (IRQ), Israel (ISR), Azerbaijan (AZE), Saudi Arabia (SAU), Iran (IRN), Egypt (EGY), Syria (SYR), Lebanon (LBN), Kuwait (KWT).
Figures 4a and 4b. Potential Exports-Actual Exports (South America and the Caribbean, Million $)
Source: Betam, Turkstat. Notes: Vertical (Y) axis shows actual exports and horizontal axis (X) shows model implied exports. Country ISO codes: Brazil (BRA), Mexico (MEX), Venezuela (VEN), Chile (CHL), Bahamas (BHS), Panama (PAN), Colombia (COL), Argentina (ARG), Peru (PER).
0 100 200 300 400 500 600 700 800 0 100 200 300 400 500 600 700 800
2002 - 2008
JPN CHN IND PAK TKM KOR SGP KAZ Potansiyel 0 500 1,000 1,500 2,000 2,500 0 500 1,000 1,500 2,000 2,5002010-2011
KAZ PAK SGP TKM IND JPN Potansiyel CHN KOR 0 500 1,000 1,500 2,000 2,500 0 500 1,000 1,500 2,000 2,5002002 - 2008
ROU POL HUN UKR CZE BGR Potansiyel SVK 0 500 1,000 1,500 2,000 2,500 3,000 3,500 0 500 1,000 1,500 2,000 2,500 3,000 3,5002010-2011
CZE Potansiyel ROU POL UKR BGR HUN SVKFigures 5a and 5b. Potential Exports-Actual Exports (Asia, Million $)
Source: Betam, Turkstat. Notes: Vertical (Y) axis shows actual exports and horizontal axis (X) shows model implied exports. China (CHN), Japan (JPN), India (IND), South Korea (KOR), Pakistan (PAK), Kazakhistan (KAZ), Turkmenistan (TKM), Singapore (SGP).
Figures 6a and 6b. Potential Exports-Actual Exports (Eastern Europe, Million $)
Source: Betam, Turkstat. Notes: Vertical (Y) axis shows actual exports and horizontal axis (X) shows model implied exports. Country ISO Codes: Romania (ROU), Poland (POL), Ukraine (UKR), Bulgaria (BGR), Hungary (HUN), Czech Republic (CZE), Slovakia (SVK).
Supplement: Regression details
ln(exports) = c + β1*ln(distance) + β2*ln(GDP) + β3*(neighborhood dummy) + β4*(customs
union dummy)
In this research brief, we estimate a gravity equation that includes economic size and distance as the main independent variables. In our regression, our dependent variable is 2002-2008 average of Turkey’s exports by country level. Our independent variables are 2002-2008 average of Turkey’s trading partners’ GDP, distance between their capital and Ankara, a neighborhood dummy and a customs union dummy. Exports, distance and GDP variables are in natural logs. We use two different databases for GDP data, one from IMF outlook database and another from the World Bank database. Because in World Bank database GDP data for 2011 is not yet available, we only use the regression with World Bank data for robustness check. Results of our model are shown below:
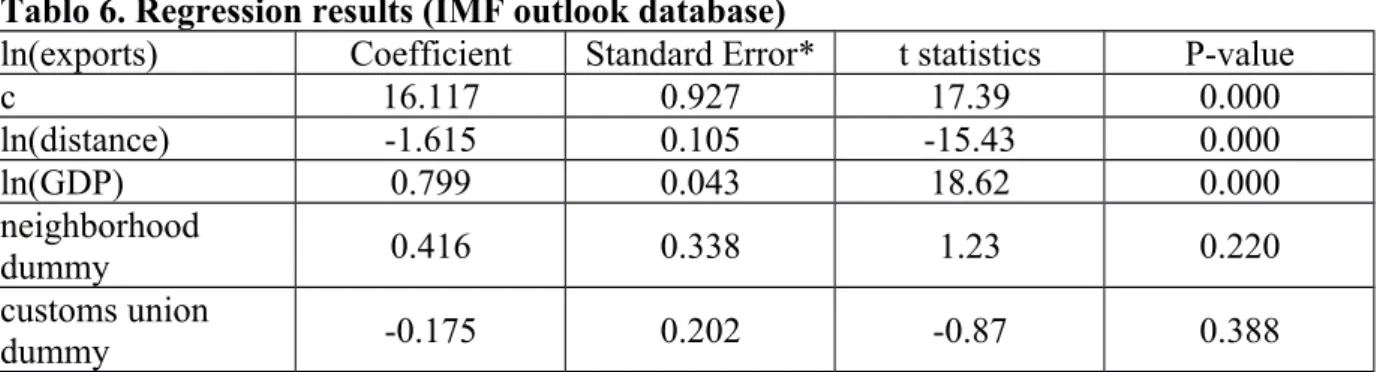
Tablo 6. Regression results (IMF outlook database)
ln(exports) Coefficient Standard Error* t statistics P-value
c 16.117 0.927 17.39 0.000 ln(distance) -1.615 0.105 -15.43 0.000 ln(GDP) 0.799 0.043 18.62 0.000 neighborhood dummy 0.416 0.338 1.23 0.220 customs union dummy -0.175 0.202 -0.87 0.388
* In this regression heteroscedasticity consistent standard errors are used.
R2 = 0.837.
Number of countries = 166.
Tablo 7. Regression results (Worldbank database)
ln(exports) Coefficient Standard Error* t statistics P-value
c 14.368 1.158 12.41 0.000 ln(distance) -1.406 0.143 -9.85 0.000 ln(GDP) 0.783 0.060 13.15 0.000 neighborhood dummy 0.717 0.368 1.95 0.053 customs union dummy 0.101 0.244 0.41 0.681
* In this regression heteroscedasticity consistent standard errors are used.
R2 = 0.774.
Number of countries = 174.
In both of the regressions, coefficients of c, ln(distance) and ln(GDP) are very close and statistically significant at 5 percent significant level. Neighborhood dummy is statistically significant at 10 percent significant level when data for 2011 is not included in Table 7 (the World Bank data) but it is statistically insignificant in Table 6 (The IMF data). Finally, customs union dummy is insignificant in both of the regressions.
References
1. Anderson, James E, 1979. "A Theoretical Foundation for the Gravity Equation," American Economic Review, American Economic Association, vol. 69(1), pages 106-16.
2. Anderson, James E, & van Wincoop, Eric, 2003. "Gravity with Gravitas: A Solution to the Border Puzzle," American Economic Review, American Economic Association, vol. 93(1), pages 170-192.
3. Antonucci, Daniele, & Manzocchi, Stefano, 2006. "Does Turkey have a special trade relation with the EU?: A gravity model approach," Economic Systems, Elsevier, vol. 30(2), pages 157-169.
4. Bergstrand, Jeffrey H, 1985. "The Gravity Equation in International Trade: Some Microeconomic Foundations and Empirical Evidence," The Review of Economics and Statistics, MIT Press, vol. 67(3), pages 474-81.
5. Bilici, Ozgul, & Erdil, Erkan, & Yetkiner, I. Hakan, 2008. "The Determining Role of EU in Turkey's Trade Flows: A Gravity Model Approach," Working Papers 0806, Izmir University of Economics.
6. Karagöz, Kadir & Saray, M. Ozan, “Trade Potential of Turkey with Asia-Pacific Countries: Evidence from Panel Gravity Model,” International Economic Studies, vol. 36(1), pages 19-26.
7. McCallum, John, 1995. "National Borders Matter: Canada-U.S. Regional Trade Patterns," American Economic Review, American Economic Association, vol. 85(3), pages 615-23. 8. Özdeşer, Hüseyin, & Ertac, Dizem, 2010. “Turkey’s Trade Potential with Euro Zone Countries: A Gravity Study,” European Journal of Scientific Research, EuroJournals Publishing, vol. 43(1), pages 15-23.