ARAŞTIRMA MAKALESI / RESEARCH ARTICLE
Using R Studio in Intermedia Agenda-Setting Studies:
Computerizing Cross-Lagged Correlation Using
Rozelle-Campbell Baseline
Medyalararası Gündem Belirleme Çalışmalarında R Stüdyo Kullanımı: Rozelle-Campbell Taban Hizası ile Çapraz Gecikmeli Korelasyonun Bilişimleştirilmesi
İnanç ALİKILIÇ*
1
Özlem ALİKILIÇ**
2
Abstract
Today, the importance of reproducible and transparent research has been increased along with the use of large data sets in a multinational environment. Researchers using intermedia agenda-setting theory have also affected this trend by conducting studies using big data and social media data. The Rozelle-Campbell formula is widely used by such researchers to investigate media effects and their direction. “R” is a general purpose statistical software package used in many fields of research. It is licensed for a free and an open-source software. There are many researchers have released applications for general use in “R” after they have been introduced into the literature. The authors have written this informative paper as a reference text for users of R in communication studies. Our primary purpose is to provide users an easy way to learn how to perform using R and R Studio analysis to use in intermedia agenda-setting, without having to navigate through the extensive, and excessive documentation. Another purpose of this study is to simplify and to reduce analyzing steps in complex cross-lagged correlations (synchronous correlations, cross-lagged correlations and autocorrelations) and Rozelle-Campbell Baseline analysis. On the other hand, neither do we claim to provide the most convenient solution for the researchers. We have tried to provide asimple approach which is easily understandable for those with an understanding of statistics. We anticipate that this tool “R” will be particularly useful for intermediate users, who need or want to conduct their studies when retrieving from the big data. In addition, this article will encourage researchers to improve their analytic abilities, by providing a brief manual and tested examples.
* Asst. Prof., Malatya Turgut Özal University, Department of Visual Communication Design, Malatya, Turkey, [email protected]
Following the existing literature, this study re-tests the results of previous four intermedia agenda-settings studies, which had been previously analyzed by SPSS Software Program or Microsoft Excel. The present study’s data analysis 100% has matched with original studies. The results suggest that researchers can use this R Studio scripts to conduct their intermedia agenda-setting analysis.
Keywords: Agenda-Setting Theory, Rozelle-Campbell Baseline, R Studio, R, Reproducible Research,
Cross-Lagged Correlation
Öz
Günümüzde, büyük veri kümelerinin kullanımı ile birlikte çok uluslu ortamlarda tekrarlanabilir ve şeffaf araştırmanın önemi artmıştır. Medyalararası gündem belirleme teorisini kullanan araştırmacılar, büyük veri ve sosyal medya verilerini kullanarak yaptıkları çalışmalarla da bu eğilimin gelişmesini etkilediler. Rozelle-Campbell formülü, bu alandaki araştırmacılar tarafından medya etkilerini ve yönlerini araştırmak için yaygın olarak kullanılmaktadır. “R”, pek çok araştırmada kullanılmakta olan, genel amaçlı bir istatistiksel yazılım paketidir. Ücretsiz ve açık kaynaklı bir yazılım için lisanslanmıştır. Literatürde “R”ın tanıtılmasından kısa bir süre sonra, pek çok araştırmacı “R” ın genel kullanıma dair uygulama çalışmalarını yayınlamışlardır.
Bu bilgilendirici makalede yazarlar, iletişim çalışmalarında R kullanacak olan araştırmacılar için bir referans oluşturmayı amaçlamışlardır. Birincil amaç, kullanıcılara kapsamlı ve yığın halindeki belgeler arasında gezinmek zorunda kalmadan, medyalararası gündem belirlemede kullanmak üzere R ve R Stüdyo analizini nasıl yapabileceklerini göstermenin kolay bir yolunu sağlamaktır. Bu çalışmanın diğer bir amacı da karmaşık çapraz gecikmeli korelasyonlarda (eş zamanlı korelasyonlar, çapraz gecikmeli korelasyonlar ve otokorelasyonlar) ve Rozelle-Campbell Taban Hizası analizindeki analiz basamaklarını basitleştirmek ve azaltmaktır. Öte yandan, bu çalışma araştırmacılar için en uygun çözümü sunduğunu iddia eden bir çalışma olmamakla beraber, temel istatistik bilgisi olan iletişimciler için kolayca anlaşılabilir basit bir yaklaşım sağlamaya çalışmaktadır. “R” dilinin, araştırmalarını yürütürken büyük verinin içinden gerekli veriyi elde etmeye ihtiyaç duyan araştırmacılar için özellikle yararlı olacağı öngörülmektedir. Ayrıca, bu makalede sunulan test edilmiş örnekler ve şablon kodları ile araştırmacıların analitik yeteneklerinin geliştirilmesine katkıda bulunmak amaçlanmıştır.
Bu çalışmada ilk olarak mevcut alan yazın taranmış, ardından daha önceden SPSS Yazılım Programı veya Microsoft Excel aracılığı ile analiz edilmiş olan dört farklı medyalararası gündem belirleme araştırmasının sonuçları yeniden test edilmiştir. Önceki dört çalışmanın R ile tekrarı sonucunda elde edilen veri analizi, orijinal çalışmalarla % 100 eşleşmiştir. Sonuçlar, iletişim araştırmacılarının ilgili araştırmalarında, R Stüdyo kodlarını kullanarak medyalararası gündem belirleme analizlerini yapabileceklerini destekler niteliktedir.
Anahtar Kelimeler: Gündem Belirleme Teorisi, Rozelle-Campbell Taban Hizası, R Stüdyo, R,
Yenilenebilir Araştırma, Çapraz Gecikmeli Korelasyon Introduction
Agenda-setting theory can be traced back to Lippmann (1922), who highlighted the vital role of the mass media (p. 4), claiming that it could do anything to influence the establishment of certain images in the public’s mind. He explained how the mass media could set a particular agenda to influence public opinion. “Although Lippmann never used the term ‘agenda-setting theory’ in his work, he provided the foundations for the theory” (Mohd Zain, 2014, p. 1),
which was popularized as a term many years later by McCombs and Shaw (1972). As defined by Reynolds and McCombs agenda-setting theory, which is usually defined as “the ability to influence the salience of topics on the public agenda” (2002, p. 1), has become one of the most studied theories in public opinion research. According to the theory, “that the more salient an issue or object is in terms of its media coverage, the more likely the audience will consider the issue or object to be important” (Tan, Huang, Li ve Jiang, 2012 , p. 2). Agenda – setting theory “elaborates the connection in terms of relationships between the emphasis that the mass media put as an issue and the reactions and attributions of media audiences and the public’s reaction or attributes to such issue” (Mohd Zain, 2014, p. 3).
Briefly, agenda-setting theory explains the mass media’s influence in placing a certain issue on the public agenda. Dearing and Rogers (1996) believed that agenda-setting theory’s connection with the mass media involves relationships between three agendas: “public agenda, media agenda and policy agenda” (p. 5). However, the world and nature can occasionally add new issues to the mass media agenda and public agenda (e.g. natural disasters, such as earthquakes and tsunamis, or wars). This certainly affects both agendas directly (Dearing & Rogers, 1996). Subsequently, the theory has inspired hundreds of investigations into the mass media (such as how it primes and frames issues for audiences), and “remains one of the most enduring and most researched theories in mass communication” (Meraz, 2011, p. 177).
The theory originally “focused on the transfer of issue salience from the media agenda to the public agenda” (Han, Lee, & McCombs, 2017, p. 602). According to the theory, “first-level agenda-setting deals with the object that is being transferred between the media and the public” (Bakan & Melek, 2016, p. 157). Many scholars have explored this first level agenda-setting (Funkhouser, 1973; Tipton, Haney, & Baseheart, 1975; Winter & Eyal, 1981). Second-level agenda-setting “tells us how to think about it”. That is, it is mainly about the object’s attribution and how it shapes public opinion (positive, negative, or neutral) (Lee, Lancendorfer, & Lee, 2005; McCombs, 2005; Shaw, 1977). Third-level agenda-setting is network agenda-setting. The network agenda-setting model hypothesizes that the news media can transfer the salience of the network relationships of objects and attributes into the public mind. This implies that, through network analysis, researchers can map out the relationships among objects and attributes in both the media and public agendas (Guo, 2012; Mccombs, 2015).
Intermedia agenda-setting evaluates how a medium’s agenda influences another medium’s agenda. Regarding the interaction of traditional and new media, it involves a discussion about how the agendas of the traditional and new media can reciprocally influence each other. Compared to the traditional media, the new media obviously delivers information faster and offers easier access to it: by clicking on a web page, an individual can easily acquire information in just few seconds. With the rapid advance of technology, information has never been so accessible or rapidly delivered before (Jenkins, Peters, & Moreira, 2006). Given these advantages, it is also more influential in spreading information and rapidly setting the agenda for the public’s view (Anderson, 2000), which gives it’s potential influence over the traditional media. Regarding intermedia agenda setting, several factors give the new media influence over the traditional
media: “(a) speed, (b) easy accessibility, (c) faster delivery of information and (d) popularity with media audiences” (Mohd Zain, 2014, p. 7). In other words, the new media can deliver information faster than traditional media, therefore it may set the public agenda faster, too.
Today, intermedia agenda-setting has become one of the most researched communication theories (Bryant & Miron, 2004). For instance, content analysis is one of the most preferable tools used in intermedia agenda setting research (Cui & Wu, 2017; Ku, Kaid, & Pfau, 2003; Lee, Lancendorfer, & Lee, 2005; Melek, 2015; Ragas, 2010; Roberts & Mccombs, n.d.; C. Rosenthal, 2014; Sikanku, 2011; Tedesco, 2005). By concerning big data and new computerized technologies, there are still few studies have drawn on computer-based methods and text analysis (e.g. dictionary-based analysis, topic modeling, network analysis, latent dirichlet analysis, cluster analysis and semantic analysis) (Guo, Vargo, Pan, Ding, & Ishwar, 2016; Lewis, Zamith, & Hermida, 2013; Riffe & Freitag, 1997). These computer-based methods allow researchers to process the Big Data on a real time. In the Big Data era, however, cross-lagged correlation and Rozelle-Campbell analysis can be facilitative tools for communication researchers when conducting their research. Collecting and analyzing the data would never have become much easier and reproducible than before. However, the Rozelle-Campbell Baseline method uses complex, advanced statistical analyses, such as cross-lagged correlation and auto correlation, which challenge many researchers when collecting complex data sets. It also takes long time to interpret the outputs of the statistics. Reporting and interpretation of the data itself also seem difficult. In every data analysis project, finding tools for scraping the Web, accessing data from web APIs quickly was not an easy effort. Thanks to “R” and “R Studio” that support researchers to be able to get all their data into R to start data analysis project, no matter where it comes from (Cirillo, 2016).
By the advances in Big Data process and the progress of cloud computing, we can assume that worldwide data is available through the Internet. It is therefore, very important to know how to retrieve data from the Internet and upload it into researchers’ analytical environment. For that reason, the purpose of this study is to introduce a computerized script code “R Studio” when conducting intermedia agenda-setting analysis. Despite the flood of Big Data, the “R” does not only enable researchers to collect, analyze and report large amounts of data in a relatively short period, but also gives researchers the tools about combining their data with the demonstration of their findings.
Our primary purpose is to provide users with an easy way to learn how to perform using R and R Studio analysis to use in intermedia-agenda setting, without having to navigate through the extensive, and accessive documentation. Another purpose of this study is to simplify and to reduce analyzing steps in complex lagged correlations (synchronous correlations, cross-lagged correlations and autocorrelations) and Rozelle-Campbell Baseline analysis.
In this research a natural question is: How well do new R Studio script codes perform in intermedia agenda-setting analysis? Following to existing literature, this study first introduces new script for R studio which is a reproducible, then it re-test the results of previous four intermedia agenda-setting studies’ (Melek, 2015; Tedesco, 2005, Lee et al., 2005; Kushin, 2010),
analyzed by SPSS Software or Microsoft Excel. R studio scripts and findings will be demonstrated in the study. Comparing with SPSS Software Program, the advantages of the R language are; (1) Documentation: In terms of documentation R has easily available to explain documentation while SPSS is lag behind in this feature because of it’s limited use. (2) Cost: R is an open and a free source while SPSS is licensed and not free. (3) Visualization: R offers much more opportunities to customize and optimize graphics due to a wide range of modules which are available. On the other hand the graphical capabilities of SPSS are limited (Educba,2020).
Most Preferred Intermedia Agenda-Setting Research Methods
Intermedia agenda-setting research evaluates how much news content is exchanged between different news media and the effects of this (Cui & Wu, 2017; Harder, Sevenans, & Van Aelst, 2017; Kushin, 2010). Various studies have shown reciprocal agenda-setting relationships between traditional and newer media (Bakan & Melek, 2016; Conway, Kenski, & Wang, 2015; Harder et al., 2017; Kushin, 2010; Lee et al., 2005a; Lim, 2006; C. Rosenthal, 2014; Sweetser, Golan, & Wanta, 2008; Vargo & Guo, 2017). Using intermedia agenda-setting theory, each of these research groups have tried to determine how the media agenda of one news organization influences another’s in order to define who sets the media agenda. One of the most popular quantitative research methods in the field of mass communication and intermedia agenda-setting research is content analysis, accounting for nearly 30% of the research in journalism and mass communication (Vargo & Guo, 2017, p. 334). However, as argued, content analysis has its limitations (Babbie, 2007, s.330; Kondracki, Wellman, & Amundson, 2002). Especially when it’s been worked with big data sets, duration of the analyses takes long and time consuming. On the other hand, it is failed when identifying cause and effect relationships as a result of ineffective conclusion (Berg, 2001). As a sampling methodology, purposive sampling is the most preferred method. Since this method brings a reductive approach to the researcher, the research findings may not correspond the whole (Kondracki et al. 2002). Even if processing and analyzing data and text becomes easier today with new computer technologies, data processing and analysis can be difficult. Besides that, in the separation, coding and reliability of the data; the use of encoders also paves the way for systematic errors. Encoders may fail when identifying and coding complex data sets (Güler, Halıcıoğlu & Taşğın, 2015, p. 364–365). That is why time-series analysis should be included. A time-series involves collection of observations at specified times Chatfield (2003), particularly for a phenomenon that varies irregularly over time. Time-series data can be analyzed using statistical techniques, particularly to forecast future time series values from current and past values. Time-series analysis enables researchers to test across different time periods and identify the time order in inter-variable relationships (Hester & Gibson, 2003).
Another most commonly used computer-assisted content analysis test is Granger Causality test. The Granger Causality test provides a statistical concept of causality that the causal relationship and direction between two variables. Thus, Granger causality can show that the change in the volume of one trend preceded the change of values of another, although it cannot demonstrate how much both sets of values were caused by other events outside the model (Russell Neuman,
Guggenheim, Mo Jang, & Bae, 2014). According to Conway et al., (2015, p. 367), “Computer-assisted content analysis and time series analysis [is] ideal for testing the application of theory to big data” in order to track the transfer of salience online. Some researchers have used Vector Auto regression (VAR) with Granger Causality tests (initiated by Granger, 1969 and Wiener, 1956) to statistically identify significant time-order relationships (Meraz, 2011; Sayre, Bode, Shah, Wilcox, & Shah, 2010; Schiffer, 2006).
Comparing Intermedia Agenda-Setting research methods; content analysis is one of the common analysis method with a complex use and therefore, cross-lagged correlations and Rozelle-Campbell Baseline methods were selected and simplified in use with new R script.
Cross-Lagged Correlations and Rozelle-Campbell Baseline
Intermedia agenda-setting research widely uses content analysis followed by cross-lagged correlations and Rozelle-Campbell baseline methods as they can reliably explain the causal relationship between two variables over two time periods (Han et al., 2017; McCombs, Llamas, Lopez-Escobar, & Rey, 1997).
“Cross-lagged correlation calculates causality between two variables (X and Y) concurrently. That is, if X causes Y to a greater extent than Y causes X, then the correlation between X at Time 1(X1) and Y at Time 2 (Y2) (e.g. PX1Y2) should be larger than the correlation between Y at Time 1 (Y1) and X at Time 2 (X2) (e.g. PYIX2). The two-variable cross-lagged case creates six correlations: two synchronous correlations PX1Y1 and PX2Y2, two auto correlations PX1X2 and PY1Y2, and two cross-lagged correlations PX1Y2 and PX2Y1. A simple comparison of PX1Y2 and PX2Y1 ignores the strength of the synchronous correlations and auto correlations (Cui & Wu, 2017, p. 591)”. However, using the Rozelle-Campbell baseline, the level of cross-lagged correlation can be predicted based on the synchronous correlations and auto correlations (McCombs et al., 1997). Scholars are mostly interested in the relationships of PY1X2 and PX1Y2, which indicate how much each variable influences the other over time. Thus, the cross-correlations for the agenda of X media at time 1 to Y media at time 2 (PX1Y2), and for the agenda of Y media at time 1 to X media at time 2 (PY1X2) must exceed the Rozelle-Campbell baseline to conclude that there is the agendas reciprocally influence each other. However, just because either or both values are positive and statistically significant does not necessarily indicate a significant influence; nor is a unidirectional influence necessarily indicated if one of those values is larger than the other because both variables were likely affected by other ignored influences. Therefore, Rozelle and Campbell proposed used the other four correlations to calculate a baseline value representing the cross-lagged correlation if the variables do not influence each other (Rozelle & Campbell, 1969). Although some scholars claim that there can be a clear intermedia agenda-setting effect even if the auto correlations in the analysis of interest fall below the baseline level (Dunn, 2009; Kushin, 2010; Melek, 2015; Tedesco, 2005), the cross-lagged technique with the Rozelle-Campbell baseline is frequently used for intermedia agenda setting research (Bakan & Melek, 2016; Du, 2013; Dunn,
2009; Ku et al., 2003; Kushin, 2010; Lim, 2006; Melek, 2015; Ragas, 2010; C. Rosenthal, 2015; Sikanku, 2011; Sweetser et al., 2008; Tedesco, 2005).
The formula for computing the Rozelle-Campbell baseline is:
As a result, the purpose of this study is to shorten and to reduce analyzing steps in complex cross-lagged correlations (synchronous correlations, cross-lagged correlations and autocorrelations) and Rozelle-Campbell Baseline analysis.
R and R Studio
R is a free, open-source statistical software environment for computing and graphics that compiles and runs on Windows, Mac OS X and numerous UNIX platforms, such as Linux (Verzani, 2011, p. 1).
“R, like other programming languages, is extended (or developed) through user-written functions, facilitated by integrated development environments (IDE), such as R Studio. Unlike many other statistical software packages that employ a graphical user interface, a typical user interacts with R primarily through the command line” (Verzani, 2011, p. 2).
R can easily be found on the internet and downloaded from https://www.r-project.org/. R Studio is “a convenient environment to run R. It is also a free, open-source, cross-platform software available at http://rstudio.org/. Researchers are recommended to install R first before R Studio” (Schimdheiny, 2013, p. 2). “Many researchers have provided their own R programs through the R project webpage, while many packages are already preinstalled in the basic R installation” (Schimdheiny, 2013, pp. 2-3). New packages can be installed by clicking on Install Packages in the Packages panel or with the command install.packages (“packages name”).
Rozelle-Campbell Baseline Method Using R Studio
While the Rozelle-Campbell Baseline Method is widely used in communication research, it is very time consuming and it is difficult to reproduce findings. However, many researchers need to conduct meta-analyses using big data and combine their findings in real time. R Studio helps researchers to make relational analysis easily and efficiently. This study aims to help researchers conduct crossed-lagged analysis and Rozelle-Campbell analysis by employing fewer and simpler scripts. All scripts and descriptions can be found in Appendix A: Coding Procedure.
Data and Method
Researchers tested whether their new R script for crossed-lagged and the Rozelle-Campbell baseline formula can replace the existing SPSS or Excel analysis. Data were collected from Melek’s
(2015), Tedesco’s (2005), Lee et al.’s (2005) and Kushin’s (2011) studies. Their samples were both consist of intermedia contents. Researchers then compared with previous and new results to confirm new R script’s validity and reliability.
Limitations
This study contains some limitations as well. It can be di difficult for social scientists to write and understand the code in R. Therefore, in this study, researchers employed loop function to reduce the amount of typing codes since making code is both hard to understand and may fail in unexpected ways. The other limitation is about the samples that were tested. This study tests only 4 existing studies’ conventional methods which means that comparing test results should not confirm that “R” script will replace the whole intermedia agenda-setting research. Also, The R Studio 72-line scripts only work more than 4-time columns. If data is less than 4-time columns, the script does not work due to simplicity of the data sets.,
From Intermedia agenda setting analysis perspective, one of a basic constraints in crossed-lagged correlation analysis is the lack of an explicit definition of a causal effect (Rogosa, 1980) Without a clearly defined quantity to be estimated, it is not surprising that crossed-lagged correlation analysis fails to provide information about causal effects. The assessment of causal effects should be based on a model for the data in which causal effects are identified. Moreover, crossed-lagged correlation analysis may indicate a causal predominance opposite to that of the actual structure of the data; which means that crossed-lagged correlation analysis may indicate that X causes Y when the reverse is true. Additionally, there are other causes existed which can explain the relationship between X and Y occasionally. This is why the result of statistical analysis may not provide complete accuracy (Hamaker, Kuiper, & Grasman, 2015; R. Rosenthal & Rosnow, 1991).
Findings
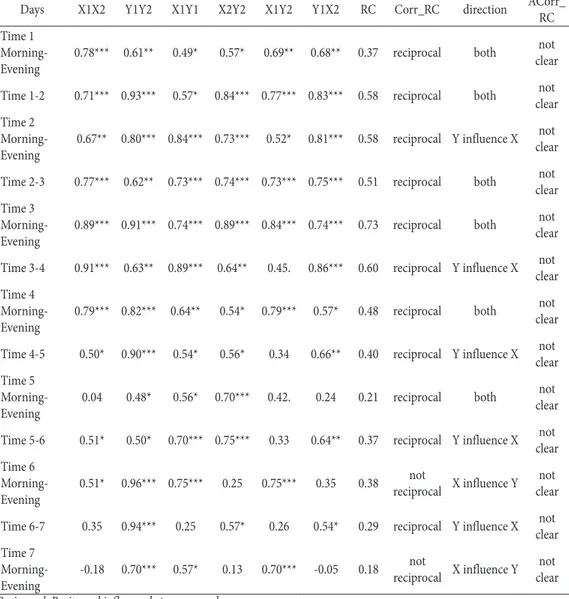
Melek’s (2015) dissertation examined the intermedia agenda-setting relationship between Hürriyet Newspaper online news and Twitter based on “Erdogan” keywords. Twice a day for seven days (morning and evening) data were collected and analyzed with content analysis. When Melek (2015) conducted cross lagged analysis using Rozelle – Campbell base line, Intermedia agenda-setting effects could not be determined. For re-testing results, researchers used new R script, so the script retrieved same results. Findings are presented in Table 1, below.
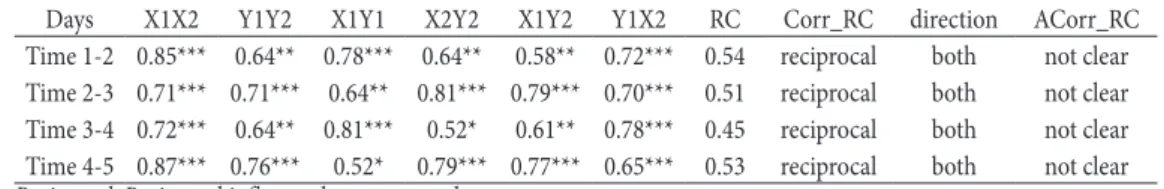
Tedesco (2005) examined political candidates’ issue agendas during the 2004 Democratic Primary Campaign. Candidate’s press releases (Wesley Clark, Howard Dean, John Edwards and John Kerry) were selected for the study. Content analysis and cross-lagged correlation were used to determine intermedia agenda-setting effect between the candidate press releases. According Tedesco’s study, cross – lagged correlations below the Rozelle-Campbell baseline statistic indicate that these candidates (Clark and Dean) had no measurable influence on their opponents’ issue
agenda. For re-testing results, researchers used new R script, so the script retrieved same results. Findings are presented in Table 2, below.
Table 1. Melek’s (2015, pp. 93-97) cross-lagged correlations for issue agenda
Days X1X2 Y1Y2 X1Y1 X2Y2 X1Y2 Y1X2 RC Corr_RC direction ACorr_RC Time 1
Morning-Evening 0.78*** 0.61** 0.49* 0.57* 0.69** 0.68** 0.37 reciprocal both
not clear Time 1-2 0.71*** 0.93*** 0.57* 0.84*** 0.77*** 0.83*** 0.58 reciprocal both clearnot Time 2
Morning-Evening 0.67** 0.80*** 0.84*** 0.73*** 0.52* 0.81*** 0.58 reciprocal Y influence X not clear Time 2-3 0.77*** 0.62** 0.73*** 0.74*** 0.73*** 0.75*** 0.51 reciprocal both clearnot Time 3
Morning-Evening 0.89*** 0.91*** 0.74*** 0.89*** 0.84*** 0.74*** 0.73 reciprocal both
not clear Time 3-4 0.91*** 0.63** 0.89*** 0.64** 0.45. 0.86*** 0.60 reciprocal Y influence X clearnot Time 4
Morning-Evening 0.79*** 0.82*** 0.64** 0.54* 0.79*** 0.57* 0.48 reciprocal both
not clear Time 4-5 0.50* 0.90*** 0.54* 0.56* 0.34 0.66** 0.40 reciprocal Y influence X clearnot Time 5
Morning-Evening 0.04 0.48* 0.56* 0.70*** 0.42. 0.24 0.21 reciprocal both
not clear Time 5-6 0.51* 0.50* 0.70*** 0.75*** 0.33 0.64** 0.37 reciprocal Y influence X clearnot Time 6
Morning-Evening 0.51* 0.96*** 0.75*** 0.25 0.75*** 0.35 0.38 not
reciprocal X influence Y clearnot Time 6-7 0.35 0.94*** 0.25 0.57* 0.26 0.54* 0.29 reciprocal Y influence X clearnot Time 7
Morning-Evening -0.18 0.70*** 0.57* 0.13 0.70*** -0.05 0.18 not
reciprocal X influence Y clearnot
Reciprocal: Reciprocal influence between agendas, Not Clear: not clear intermedia agenda setting effect, RC* = Rozelle-campbell results.
Corr_RC* = Correlations higher than rozelle-campbell baseline. ACorr_RC* = Auto correlations smaller than rozelle-campbell baseline. * Pearson product moment correlations reveal significance at the p < 0.05 level. ** Pearson product moment correlations reveal significance at the p < 0.01 level. *** Pearson product moment correlations reveal significance at the p < 0.001 level.
Table 2. Tedesco’s (2005, pp.105-108) cross-lagged correlations for issue agenda (Clark-Dean)
Days X1X2 Y1Y2 X1Y1 X2Y2 X1Y2 Y1X2 RC Corr_RC direction ACorr_RC Time 1-2 0.85*** 0.64** 0.78*** 0.64** 0.58** 0.72*** 0.54 reciprocal both not clear Time 2-3 0.71*** 0.71*** 0.64** 0.81*** 0.79*** 0.70*** 0.51 reciprocal both not clear Time 3-4 0.72*** 0.64** 0.81*** 0.52* 0.61** 0.78*** 0.45 reciprocal both not clear Time 4-5 0.87*** 0.76*** 0.52* 0.79*** 0.77*** 0.65*** 0.53 reciprocal both not clear
Reciprocal: Reciprocal influence between agendas, Not Clear: not clear intermedia agenda setting effect, RC* = Rozelle-campbell results.
Corr_RC* = Correlations higher than rozelle-campbell baseline. ACorr_RC* = Auto correlations smaller than rozelle-campbell baseline. * Pearson product moment correlations reveal significance at the p < 0.05 level. ** Pearson product moment correlations reveal significance at the p < 0.01 level. *** Pearson product moment correlations reveal significance at the p < 0.001 level.
Lee et al. (2005) examined the intermedia relationship between newspapers and Internet bulletin boards during the 2000 general election in South Korea and examined both the first and the second levels of agenda-setting. The results of the cross-lagged correlations indicated that there were intermedia influences between newspapers and Internet bulletin boards. For re-testing results, researchers used new R script, so the script retrieved same results. Findings are presented in Table 3, below.
Table 3. Lee’s (2005, p. 66) cross-lagged correlations for issue agenda
Days X1X2 Y1Y2 X1Y1 X2Y2 X1Y2 Y1X2 RC Corr_RC direction ACorr_RC Time 1-2 0.12 0.41 0.87* -0.27 0.15 -0.16 0.09 not reciprocal X influence Y not clear Time 2-3 0.38 0.31 -0.27 0.92* 0.33 0.22 0.11 reciprocal both not clear Time 3-4 0.65 0.88* 0.92* 0.93** 0.84* 0.78. 0.71 reciprocal both not clear
Reciprocal: Reciprocal influence between agendas, Not Clear: not clear intermedia agenda setting effect, RC* = Rozelle-campbell results.
Corr_RC* = Correlations higher than rozelle-campbell baseline. ACorr_RC* = Auto correlations smaller than rozelle-campbell baseline. * Pearson product moment correlations reveal significance at the p < 0.05 level. ** Pearson product moment correlations reveal significance at the p < 0.01 level. *** Pearson product moment correlations reveal significance at the p < 0.001 level.
Kushin’s (2011) dissertation assessed the argument that social media, specifically Twitter, had a direct influence on the news media agenda. Results of the cross-correlation showed that there was a lack of intermedia agenda-setting between New York Times Online and Twitter for both “within-day” and “between-day” panels. For re-testing results, researchers used new R script, so the script retrieved same results. Findings are presented in Table 4, below.
Table 4. Kushin’s (2010, pp. 88-91) cross-lagged correlations for issue agenda
Days X1X2 Y1Y2 X1Y1 X2Y2 X1Y2 Y1X2 RC Corr_RC direction ACorr_RC Time 1
Morning-Evening 0.78*** 0.86*** 0.78*** 0.67*** 0.58** 0.79*** 0.60 reciprocal Y influence X not clear Time 1-2 0.84*** 0.93*** 0.67*** 0.77*** 0.66*** 0.72*** 0.64 reciprocal both clearnot
Time 2
Morning-Evening 0.95*** 0.83*** 0.77*** 0.87*** 0.89*** 0.72*** 0.73 not
reciprocal X influence Y clearnot Time 2-3 0.92*** 0.96*** 0.87*** 0.92*** 0.83*** 0.95*** 0.84 reciprocal Y influence X clearnot
Time 3
Morning-Evening 0.93*** 0.94*** 0.92*** 0.75*** 0.85*** 0.81*** 0.78 reciprocal both
not clear Time 3-4 0.40* 0.85*** 0.75*** 0.26 0.74*** 0.27 0.33 reciprocal X influence Ynot clearnot
Time 4
Morning-Evening 0.14 0.74*** 0.26 0.49* 0.19 0.57** 0.20 reciprocal Y influence X not clear Time 4-5 0.65*** 0.78*** 0.49* 0.51** 0.37. 0.67*** 0.36 reciprocal both clearnot
Time 5
Morning-Evening 0.16 0.77*** 0.51** 0.57** 0.48* 0.45* 0.30 reciprocal both
not clear Time 5-6 0.82*** 0.88*** 0.57** 0.76*** 0.51** 0.79*** 0.57 reciprocal Y influence X clearnot
Time 6
Morning-Evening 0.36. 0.75*** 0.76*** 0.91*** 0.38. 0.68*** 0.49 reciprocal Y influence X not clear Time 6-7 0.70*** 0.56** 0.91*** 0.48* 0.50* 0.70*** 0.44 reciprocal both clearnot
Time 7
Morning-Evening 0.28 0.77*** 0.48* 0.35. 0.47* 0.42* 0.24 reciprocal both
not clear
Reciprocal: Reciprocal influence between agendas, Not Clear: not clear intermedia agenda setting effect, RC* = Rozelle-campbell results.
Corr_RC* = Correlations higher than rozelle-campbell baseline. ACorr_RC* = Auto correlations smaller than rozelle-campbell baseline. * Pearson product moment correlations reveal significance at the p < 0.05 level. ** Pearson product moment correlations reveal significance at the p < 0.01 level. *** Pearson product moment correlations reveal significance at the p < 0.001 level.
The present study’s data results were matched 100% with Melek’s, Tedesco’s, Lee’s and Kushin’s results. All the results can be monitored within the original data of Melek (2015)’s [pp. 93-97], Tedesco (2005)’s [pp. 105-108], Lee et al. (2005)’s [p. 66] and Kushin (2011)’s [pp. 88-91] studies.
Discussion
Although new R Studio scripts in this paper are quite basic, the present study’s data analysis 100% has matched with the results of previous studies. The validity and reliability of the code prepared with the R Studio results were tested by reproducing four previous studies. The results suggest that researchers can use this R Studio scripts to conduct their intermedia agenda-setting analysis.
As a consequence, it can be thought that testing previous studies is confirmed. By re-testing and confirming aforementioned studies, we encourage researchers to adapt this script to their research. The results suggest that researchers can use this R Studio scripts to conduct their intermedia agenda-setting analysis. Conducting this study with R Studio provides a facilitating and integrating solution for collecting, organizing, classifying and analyzing data. Although in many studies, data is still analyzed with Excel or SPSS. R and R Studio provides a researcher with greater convenience, flexibility and practicality. The agenda setting effect between the two media for specified durations can be achieved through SPSS or Excel. However, measuring the effect of agenda setting among hundreds of time periods and hundreds of media in big data environment requires incredible labor and time. Thanks to this code, the agenda setting effect of limitless time periods and limitless media can be easily tested.
This study enables all interested researchers who wish to repeat the study to access easily the codes and data used in this analysis. This method also enables researchers to conduct multinational research with transparent sharing of data collection process and analysis. Although R Studio new scripts are quite basic and allows for many applications, we encourage researchers to adapt the scripts to their research by adding additional items. The present study, which aimed to advance reproducible research, is shared on figshare site https://figshare.com/s/85f17d350371a288978c with all its data and scripts.
References
Anderson, J. W. (2000). New media in the muslim world: The emerging public sphere. ISIM Newsletter, 5, 1. Babbie, E. (2007). The practice of social research. 11th. Belmont, CA: Thomson Wadsworth, 24(511), 66. Bakan, U., & Melek, G. (2016). First and second level intermedia agenda-setting between international
newspapers and twitter during the coverage of the 266 th Papal Election. Akdeniz İletişim Dergisi,
26, 155–177.
Berg, B. (2001). Qualitative research methods for the social science. Ally & Bacon.
Bryant, J., & Miron, D. (2004). Theory and research in mass communication. Journal of Communication. Busch, C., Maret, P. S. De, Flynn, T., Kellum, R., Le, S., Meyers, B., Palmquist, M. (1997). An introduction
to content analysis writing@CSU: Writing Guide. Retrieved May 26, 2019, from https://writing. colostate.edu/guides/guide.cfm?guideid=61/content/pop2a.cfm
Chatfield, C. (2003). The Analysis of Time series: An introduction. Chapman and Hall, London. Cirillo, A. (2016). Rstudio for R statistical computing cookbook. Packt Publishing.
Conway, B. A., Kenski, K., & Wang, D. (2015). The rise of Twitter in the political campaign: Searching for intermedia agenda-setting effects in the presidential primary. Journal of Computer-Mediated
Communication, 20(4), 363–380.
Cui, D., & Wu, F. (2017). Inter-media agenda setting in global news production: examining agenda attributes in newspaper coverage of the MH370 incident in the U.S., China, and Hong Kong. Asian Journal of
Communication, 27(6), 582–600.
Dearing, J. W., & Rogers, E. (1996). Agenda-setting (Vol. 6). Sage publications.
Du, Y. R. (2013). Intermedia agenda-setting in the age of globalization: A multinational agenda-setting test.
Global Media and Communication, 9(1), 19–36.
Dunn, S. W. (2009). Candidate and media agenda setting in the 2005 Virginia Gubernatorial election.
Journal of Communication, 59(3), 635–652.
Funkhouser, R. (1973). The Issues of the Sixties: An exploratory study in the dinamics of the public opinion.
Public Opinion Quarterly.
Granger, C. W. J. (1969). Investigating causal relations by econometric models and Cross-spectral methods.
Econometrica. https://doi.org/10.2307/1912791
Güler, A., Halıcıoğlu, M. B., & Taşğın, A. (2015). Sosyal bilimlerde nitel araştırma: teorik çerçeve-pratik
öneriler-7 farklı nitel araştırma yaklaşımı-kalite ve etik hususlar. Seçkin.
Guo, L. (2012). The application of social network analysis in agenda setting research: a methodological exploration. Journal of Broadcasting and Electronic Media, 56(4), 616–631.
Guo, L., Vargo, C. J., Pan, Z., Ding, W., & Ishwar, P. (2016). Big social data analytics in journalism and mass communication: Comparing dictionary-based text analysis and unsupervised topic modeling. Journalism & Mass Communication Quarterly, 93(2), 332-359.
Hamaker, E. L., Kuiper, R. M., & Grasman, R. P. P. P. (2015). A critique of the cross-lagged panel model.
Psychological Methods, 20(1), 102.
Han, J. (Karen), Lee, S., & McCombs, M. (2017). The attribute agenda-setting influence of online community on online newscast: investigating the South Korean Sewol ferry tragedy. Asian Journal
of Communication, 27(6), 601–615.
Harder, R. A., Sevenans, J., & Van Aelst, P. (2017). Intermedia agenda setting in the social media age: How traditional players dominate the news agenda in election times. The International Journal of Press/
Politics, 22(3), 275–293.
Hester, J. B., & Gibson, R. (2003). The economy and second-level agenda setting: A time-series analysis of economic news and public opinion about the economy. Journalism & Mass Communication
Quarterly, 80(1), 73–90.
Jenkins, R., Peters, E. D., & Moreira, M. M. (2006). The economic impact of China on Latin America–An agenda for research. In Seventh Annual Global Development Conference, pre-Conference workshop on
Asian and other drivers of global change, St. Petersburg, 18-19.
Kondracki, N. L., Wellman, N. S., & Amundson, D. R. (2002). Content analysis: Review of methods and their applications in nutrition education. Journal of Nutrition Education and Behavior.
Ku, G., Kaid, L. L., & Pfau, M. (2003). The impact of web site campaigning on traditional news media and public information processing. Journalism & Mass Communication Quarterly.
Kushin, M. J. (2010). Tweeting the issues in the age of social media? Intermedia agenda setting between the
“New York times” and Twitter. Washington State University. Retrieved March 24, 2019, from http://
Lee, B., Lancendorfer, K. M., & Lee, K. J. (2005). Agenda-setting and the internet: The intermedia influence of internet bulletin boards on newspaper coverage of the 2000 general election in South Korea.
Asian Journal of Communication, 15(1), 57–71.
Lewis, S. C., Zamith, R., & Hermida, A. (2013). Content analysis in an era of big data: A hybrid approach to computational and manual methods. Journal of broadcasting & electronic media, 57(1), 34-52. Lim, J. (2006). A cross-lagged analysis of agenda setting among online news media. Journalism & Mass
Communication Quarterly, 83(2), 298–312.
Lippmann, W. (1922). Public opinion. New York: Macmillan.
McCombs, M.E. (2005). A look at agenda-setting: past, present and future. Journalism Studies, 6(4), 543– 557.
McCombs, M.E. (2015). New trends in agenda-setting research. Central Europan Journal of Communication,
8(2), 301–312.
McCombs, M.E., & Shaw, D. L. (1972). The Agenda-Setting function of mass media. Source: The Public
Opinion Quarterly (Vol. 36).
McCombs, M.E. ., Llamas, J. P., Lopez-Escobar, E., & Rey, F. (1997). Candidate images in Spanish elections: Second-level agenda-setting effects. Journalism & Mass Communication Quarterly, 74(4), 703–717. McCombs, M., & Reynolds, A. (2002). News influence on our pictures of the world. In Media effects:
Advances in theory and research, 2nd ed. (pp. 1–18). Mahwah, NJ, US: Lawrence Erlbaum Associates
Publishers.
Melek, G. (2015). Medya arası gündem belirleme kuramı çerçevesinde Hürriyet ve Twitter üzerinde bir çalışma
(Doktora Tezi) (PhD thesis). T.C. Ege Üniversitesi.
Meraz, S. (2011). Using time series analysis to measure intermedia agenda-setting influence in traditional media and political blog networks. Journalism & Mass Communication Quarterly, 88(1), 176–194. Mohd Zain, N. (2014). Agenda setting theory. ReseachGAte, 12. Retrieved May 26, 2019, from https://www.
researchgate.net/publication/321698436_Agenda_Setting_Theory
R vs SPSS – Find out the 7 most important differences. (2020). Retrieved February 23, 2020, from https:// www.educba.com/r-vs-spss/
Ragas, M. W. (2010). Agenda-building and agenda-setting in corporate proxy contests: Exploring influence among public relations efforts, financial media coverage and investor opinion. University of Florida Gainesville.
Riffe, D., & Freitag, A. (1997). A content analysis of content analyses: Twenty-five years of journalism . Journalism & Mass Communication Quarterly, 74(3), 515-524.
Roberts, M., & McCombs, M.E. (1994.). Agenda setting and political advertising: origins of the news agenda.
Political Communication (Vol. II).
Rogosa, D. (1980). Psychological bulletin a critique of cross-lagged correlation. Psychological Bulletin, 88(2). Rosenthal, C. (2014). Reconsidering agenda setting and intermedia agenda setting from a global perspective:
a cross-national comparative agenda setting test. London School of Economics and Political Science.
Retrieved April 15, 2019, from http://www.lse.ac.uk/media@lse/research/mediaWorkingPapers/ Rosenthal, R., & Rosnow, R. L. (1991). Essentials of behavioral research: Methods and data analysis. Boston,
MA.
Russell Neuman, W., Guggenheim, L., Mo Jang, S., & Bae, S. Y. (2014). The dynamics of public attention: agenda-setting theory meets big data. Journal of Communication, 64(2), 193–214.
Sayre, B., Bode, L., Shah, D., Wilcox, D., & Shah, C. (2010). Agenda setting in a digital age: Tracking attention to California proposition in social media, Online News and Conventional News. Policy & Internet,
2(2), 7–32.
Schiffer, A. J. (2006). Blogswarms and press norms: news coverage of the downing street memo controversy.
Journalism & Mass Communication Quarterly, 83(3), 494–510.
Schimdheiny, K. (2013). A Beginner ’s hands-on guide to R with RStudio. Short Guides to Microeconomics,
Fall 2013, 37.
Shaw, D. L. (1977). The emergence of American political issues. Agenda Setting Function of the Press. Sikanku, E. G. (2011). Intermedia influences among Ghanaian online and print news media: Explicating
salience transfer of media agendas. Journal of Black Studies, 42(8), 1320–1335.
Sweetser, K. D., Golan, G. J., & Wanta, W. (2008). Intermedia agenda setting in television, advertising, and blogs during the 2004 election. Mass Communication and Society, 11(2), 197–216.
Tan, P., Huang, S., Li, Y., & Jiang, L. (2012). The dynamic relationships between online media coverage, iwom,
buzz perception and online search of celebrities in China. Retrieved October 6, 2019, from https://
wapor2012.hkpop.hk/doc/papers/ConcurrentSessionsIII/IIIE/IIIE-4.pdf
Tedesco, J. C. (2005). Intercandidate agenda setting in the 2004 democratic presidential primary. American
Behavioral Scientist, 92–113.
Tipton, L., Haney, R. D., & Baseheart, J. R. (1975). Media agenda-setting in city and state election campaigns.
Journalism Quarterly, 52(1), 15–22.
Vamvakasi, V., & Dimitrakopoulou, D. (2012). The online “factor” in the intermedia agenda-setting: The
case of the Greek Indignant Citizens Movement. Retrieved May 26, 2019, from http://www.
hellenicparliament.gr/UserFiles/8c3e9046-78fb-48f4-bd82-bbba28ca1ef5/SYNTAGMA.pdf Vargo, C. J., & Guo, L. (2017). Networks, big data, and intermedia agenda setting: an analysis of traditional,
partisan, and emerging online U.S. news. Journalism and Mass Communication Quarterly, 94(4), 1031–1055.
Verzani, J. (2011). Getting started with Rstudio: an integrated development environment for. R. O’Reilly Media. Wiener, N. (1956). The theory of prediction. Modern mathematics for engineers. New York, 165–190. Winter, J. P., & Eyal, C. H. (1981). Agenda setting for the civil rights issue. Public Opinion Quarterly, 45,
376–383. Appendix
Appendix A: Coding Procedure
Even if researcher has not completed their study solely in R Studio, they can still use this formula using Excel to organize the data. Two different media content analysis data are saved separately as an excel file. The researcher enters the data set to the appropriate columns. The first column should consist of the variables collected during the content analysis. The following columns should consist of the data from X media where the correlation is being searched for. Data for both X and Y media should be placed in time order. After the columns are filled, the data is ready to be analyzed through R studio.
For conducting the Rozelle-Campbell Baseline analysis, researcher first needs to install the
below. readxl is a package which requires to import data from Excel (Wicham & Bryan, 2018). After the installation of readxl package, library(readxl) should be run (see below). After installing the package, the data sets created in Excel are ready to be used in R Studio. With the help of read_excel function data sets can be easily imported to R Studio. The imported data should be introduced to R Studio by assigning the relevant columns to the script. The corresponding explanations of how the data set is assigned are shown below. After the data and time series have been identified as explained below, it is ready for the correlation tests then.
# Install readxl package due to import excel file # install package
install.package(“readxl”) # use readxl package in R library(readxl)
# import x media content analysis data from excel file xmedia < – read_excel(“Book1.xlsx”, sheet = “xmedia”)
# choose numeric data and eliminate first column which is variable name xmedia < – xmedia[, 2:ncol(xmedia)]
# import y media content analysis data from excel file ymedia < – read_excel(“Book1.xlsx”, sheet = “ymedia”)
# choose numeric data and eliminate first column which is variable name ymedia < – ymedia[, 2:ncol(ymedia)]
#create empty data.frame (da, pv and df) da < – NULL
pv < – NULL df < – NULL
# Before running the loop cycle, the researcher should choose which type of correlation want to use. If Pearson correlation will be used, the researcher should replace “spearman” to “pearson” as listed below.
# Loop starts below for (i in 1:ncol(xmedia)) {
# xmedia Time 1 and Time 2 auto correlation
method = “spearman”)
# ymedia Time 1 and Time 2 auto correlation
Y1Y2 < – cor.test(as.numeric(unlist(ymedia[i])), as.numeric(unlist(ymedia[i+1])), method = “spearman”)
# Correlation between xmedia Time 1 and ymedia Time 1
X1Y1 < – cor.test(as.numeric(unlist(xmedia[i])), as.numeric(unlist(ymedia[i])), method = “spearman”)
# Correlation between X Media Time 2 and Y Media Time 2 X2Y2 < – cor.test(as.numeric(unlist(xmedia[i+1])), as.numeric(unlist(ymedia[i+1])), method = “spearman”) # Cross correlation X Media Time 1 and Y Media Time 2
X1Y2 < – cor.test(as.numeric(unlist(xmedia[i])), as.numeric(unlist(ymedia[i+1])), method = “spearman”)
# Cross correlation Y Media Time 1 and X Media Time 2
Y1X2 < – cor.test(as.numeric(unlist(ymedia[i])), as.numeric(unlist(xmedia[i+1])), method = “spearman”)
# All correlations are merged in new data.frame which name is called final. final < – data.frame(X1X2$estimate,Y1Y2$estimate,X1Y1$estimate, X2Y2$estimate, X1Y2$estimate, Y1X2$estimate)
# Give column names according to the findings
colnames(final) < – c(“X1X2”, “Y1Y2”, “X1Y1”, “X2Y2”, “X1Y2”, “Y1X2”)
final$RC describes the main Rozelle-Campbell formula, which is automated in the code, which helps to calculate the intermedia agenda-setting influence and the direction of influence as shown above.
# Calculate Rozelle-Campbell formula
final$RC < – ((final$X1Y1+final$X2Y2)/2)*((((final$X1X2^2)+(final$Y1Y2^2))/2)^(1/2)) # Analyze whether cross correlations are bigger than Rozelle-Campbell base line, so that this indicates that agenda setting influence may exist.
final$Corr_RC < –
“reciprocal”, “not reciprocal”)
# Analyze intermedia agenda setting influence direction. final$direction< –
ifelse ((final$X1Y2 > final$RC) & (final$Y1X2 < final$RC), “X influence Y”,
ifelse ((final$X1Y2 < final$RC) & (final$Y1X2 > final$RC), “Y influence X”,”both”))
# Analyze whether auto correlations are smaller than Rozelle-Campbell base line, researcher may conclude that intermedia agenda setting influence has occurred.
final$ACorr_RC
ifelse ((final$X1X2 < final$RC) & (final$Y1Y2 < final$RC), “Clear”, “Not Clear”)
# create p.values from all cross-lagged correlations
pvalues < – data.frame(X1X2$p.value,Y1Y2$p.value,X1Y1$p.value, X2Y2$p.value, X1Y2$p.value, Y1X2$p.value)
da< – rbind(da, final) pv< – rbind(pv, pvalues)
# combine correlations results and p.values in same table. translate< – function(z){
symnum(z, corr = FALSE, cutpoints = c(0,.001,.01,.05, .1, 1), symbols = c(“***”,”**”,”*”,”.”,” “))}
pvalue < – data.frame(lapply(pv ,translate))
df < – data.frame(matrix(ncol = ncol(da), nrow = nrow(da))) colnames(df) < – colnames(da)
df$X1X2< – paste(as.factor(da$X1X2), as.factor(pvalue$X1X2.p.value), sep=’ ‘) df$Y1Y2< – paste(as.factor(da$Y1Y2), as.factor(pvalue$Y1Y2.p.value), sep=’ ‘) df$X1Y1< – paste(as.factor(da$X1Y1), as.factor(pvalue$X1Y1.p.value), sep=’ ‘) df$X2Y2< – paste(as.factor(da$X2Y2), as.factor(pvalue$X2Y2.p.value), sep=’ ‘)
df$X1Y2< – paste(as.factor(da$X1Y2), as.factor(pvalue$X1Y2.p.value), sep=’ ‘) df$Y1X2< – paste(as.factor(da$Y1X2), as.factor(pvalue$Y1X2.p.value), sep=’ ‘) df$RC< – da$RC
df$Corr_RC< – da$Corr_RC df$direction< – da$direction df$ACorr_RC< – da$ACorr_RC
# Create a column which is called as “days” and indicate time lags between time durations. days < – c(paste0(“time”, 1:nrow(df),”-”, “time”, 1:nrow(df)+1))
df< – cbind(days,df) }
# For loop is closed.
At this point, all the correlations and information stored the df data set help researcher to evaluate the influence of setting the media agenda. From looking at these data set, the researcher gets information about the existence and the direction of the intermedia agenda-setting influence.