DOI: 10.1501/commua1-2_0000000089 ISSN 1303-6009
© 2015 Ankara University
HARMONIC SIMULATION AND A CHEAP INSTRUMENT DESIGN WITH PIC MICROCONTROLLER
EMİN DEMET1, İLHAN KOŞALAY1
1Ankara Univ, Faculty of Engineering, Electrical and Electronics Engineering Department Ankara, Turkey
E-mail : [email protected], [email protected]
(Received: October 15, 2015; Accepted: December 23, 2015 ) ABSTRACT
In this study, harmonics analyzer circuit based on PIC 18F4620 microcontroller has been designed. After implementation of simulation of the circuit on Proteus program, the circuit has been printed on card. In the implemented circuit, data has been processed using PIC 18F4620 microcontroller and at the same time by using microcontroller through RS-232 data bus the data has been transferred to Matlab. By analyzing data sent to matlab, the circuit has been verified.
By taking Fast Fourier Transform (FFT) of sample signal applied to analog-digital converter input of PIC 18F4620 and using programs placed inside microcontroller, the implemented system helps to analyze the frequency spectrum. Due to the availability and low price of the material used, the applicability of the circuit has increased. Beside its low budget, the used circuit has shown good performance. KEYWORDS: Harmonic Analyzer, PIC 18F4620, Fourier Transform
1. INTRODUCTION
In energy systems, nonlinear load and non sinusoidal sources may cause harmonics in the form of distortion in the sine waveform. Harmonics in facilities has both technical and commercial impacts. Correctly understanding and analyzing these effects has a great importance in both management durability in facilities and conformity of the facilities with national and international standards. In systems which has harmonic signals, the following negative impacts can happen; decrease in transmission and distribution efficiency, existence of faults in compensation systems, over heating of electrical motors and transformers, happening of faults in sensitive electronics devices such as PLC and CNC, strains and wearing out of insulating level of materials, increase in losses in systems, giving error on protection and remote
40
control system, increase in voltage gradient and existence of risks of resonance. In the energy systems; harmonics analysis, observation of frequency components of wave form of current and voltage and then lowering harmonics to a minimum level is very important.
When there is a wave form distortion in current or voltage in the energy system, it means that there is decrease of the power quality in the energy system. This event makes negative effects on the consumer and devices that are connected to the power grid [1]. Most of countries have the national standard about
The power quality related to distortion. The standards are important to achieve the quality of power. The harmonics is a power quality problem. They could be anywhere of the power system that have a non-linear device. Harmonics must be followed and measured continuously. To calculate harmonics or other distortions is very complex and needs to use advanced mathematical methods. The fourier series is fundamental tool for harmonic calculation [2]. For diagnosis of the system speedily, harmonic measuring instruments must have high speed calculation. Due to this kind of technical and economical reasons, the power analyzer that measure harmonics is very expensive. Nowadays, microcontroller technology is in very advanced level. So, using microcontrollers in the measurement system become a standard procedure. Impedance measurement, pulse transmitting, microwave, and harmonics measurement can be counted as application examples [3, 4, 5, 6].
In this study, in order to analyze harmonics of single phase city grid, microcontroller based analyzer has been designed. By using the developed analyzer, the user can observe voltage harmonics frequency and amplitude of single phase 220V in an economical way. The designed circuit takes a sample signal from city grid and brings to an amplitude level which microcontroller can process. By a application of Fourier Transform of the sampled signals, component of the signals can be specified in frequency domain. The formed time and frequency domain of a sampled signal and its calculated Fourier transform is planned to be shown to user by using graphical LCD. On the other hand, by using serial port of microcontroller and its communication feature, data from PIC can be sent to a MATLAB environment and accuracy of the system can be analyzed.
2. CIRCUIT HARDWARE DESIGN
By using analogy, input of the PIC 18F4620 microcontroller signals of specified value and wave form coming from city grid and any other source are lowered by using 0-5 volt voltage divider circuit and then applied to analog input of microcontroller. Time and frequency domain analysis of the signals is performed by program written on microcontroller. The frequency and time
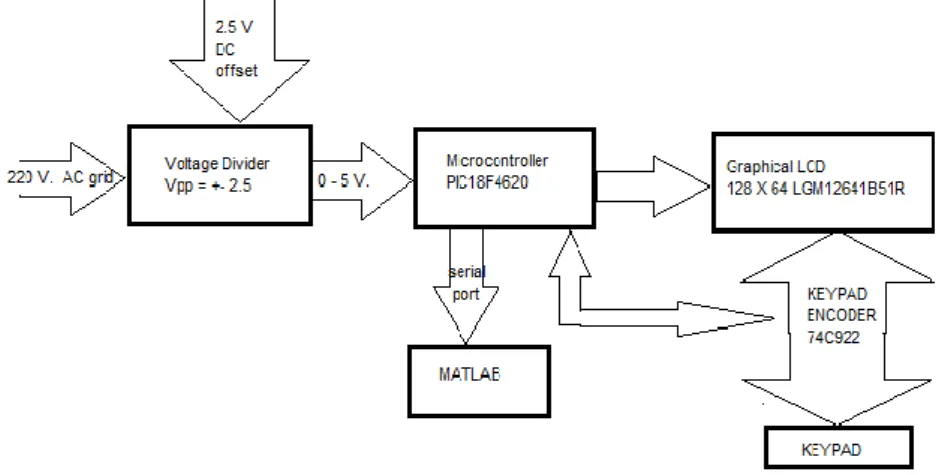
domain graphs of the results of the performed analysis are shown to a user on graphical LCD. Besides, by using buttons system forward and backward movement of data on graphical LCD is possible. In order to measure the accuracy of the analysis which is done by using microcontroller, the RS-232 connection between microcontroller and PC is established through serial port. Data are simulated in MATLAB and analysis of frequency and time domain of the signal is performed. The performed two analyses can be evaluated by the user. Figure 1 shows the block diagram of the designed harmonics analyzer.
Figure 1. Block diagram of harmonics analyzer.
Voltage divider part of the design: analog channel ; lowering 220V(peak - to –peak = 311.12 V)AC to +/- 2.5 V and changing signals of interval 0-5 V to analog by giving a dc offset of +2.5 V
42
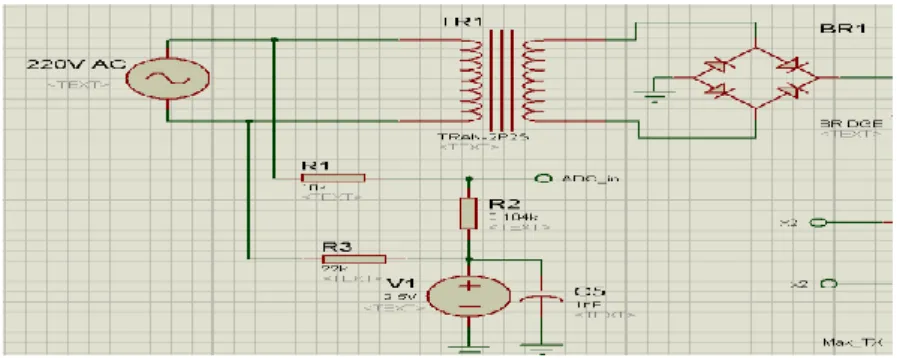
Figure 2. Voltage divider circuit
The voltage divider circuit and Proteus simulation of the voltage divider circuit are shown in Figure 2 and 3 respectively.
Figure 3. Proteus simulation of the voltage divider circuit. 220 V AC voltage coming from city grid; it is first divided to R1,R2 and R3 resistors and then DC offset voltage of 2.5 is added and directed to end of analog channel of microcontroller. By the help of this, signals to be measured by microcontroller are being lowered to a measurable interval. The number of harmonics to be measured constitutes a sensitive part in selection of microcontroller.
For the study, number of harmonics has chosen to be 40. In order to analyze this number of harmonics and at the same time to drive circuit element used in a system synchronously, PIC 18F4620 microcontroller has been selected.
3. INTRODUCTION OF THE CIRCUIT ELEMENTS USED IN DESIGN CIRCUIT
3.1.MICROCONTROLLER (PIC 18F4620)
Since the selected number of harmonics is up to 40, the value of upper limit of frequency: 40 x 50 = 2000 Hz. According to Nyquist or Shannon criteria, sampling frequency should be atleast two times. ( 2000 x 2 = 4000 Hz sampling frequency). For this reason the ADC conversion speed of microcontroller should not be less than 250 𝜇𝑠. (1/4000 = 250 𝜇𝑠) . Specifications of PIC 18F4620 microcontroller that used in the study are as follows:
a-40 pin b-36 I/O pins c-64kByte ROM
d-4Kbyte SRAM
e-13 pin ADC(ANALOG DIGITAL CONVERTER) f-10 bit ADC resolution.
g-40 MHZ oscillator
h-Three 16-bit and one 8-bit TIMER ı-Serial port connection
3.2. BUTTONS AND KEYPAD ENCODER
In control system, entering data is generally done by buttons. A pressed button is controlled by scanning process. However since this process is done continuously it makes microcontroller busy and as a result other processes slows. In order to overcome this problem, 74C922 keypad encoder is used in button scanning process. By the help of this integration, the scanning process does not make microcontroller busy at all and at the same time, it reduces the number of used pins. The integrated 74C22 has the ability to operate at interval 3V-15V. Row line of the keyboard is connected to Y input and column line is connected X input. OE is selection terminal.
All the process in the circuit is controlled by buttons. Signals sent through buttons are directed to a microcontroller by keypad encoder and microcontroller performs required operation. Presentation of frequency and time domain of the signals are separately controlled through serial port connection buttons.
3.3 GRAPHICAL LCD
Together with giving all the specifications of LCD’s based characters, graphical LCD provide a possibility of controlling to a pixel level. The required drawings can be showed by using these LCD’s. Graphical LCD’s consist of control integrations. Graphical LCD is chosen as 128 x 64 dots matrix dimension and the data processed by the microcontroller are shown to a user by graphical LCD.
4. SOFTWARE DESIGN AND SIMULATION
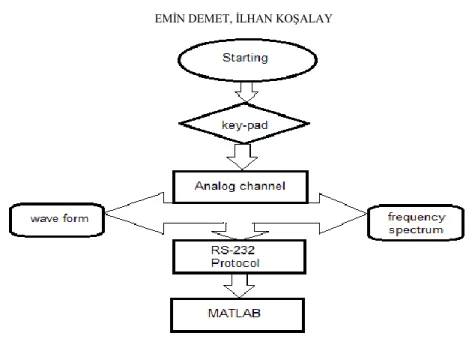
In the designed harmonics analyzer, after selection of microcontroller it is required to write programs which will perform the operations inside microcontroller. The corresponding software design block diagram is shown in the figure 4. In the frame of block diagram explanations is as follows.
44
Figure 4. Software design flow diagram.
Analog channel is the input channel of the system. Sample signals taken from city grid is lowered to 0-5V level by voltage divider and applied to a microcontroller through this channel. Fourier Transform of this signal is taken to form components of frequency domain. Signals entered through analog channel are converted to digital by 10 bits ADC inside the PIC 18F4620 microcontroller. In the digitalization process, since the used analog-digital converter of microcontroller has 10 bits, signal of interval 0-5 V is sampled in 210= 1024 steps. The step size is 5/1024 = 4.8828125 mV. Table 1 shows
output values of 10 bits ADC for 0-5 V analog signal.
Table 1 Output values of 10 bits ADC for 0-5 V analog signal.
Analog input Corresponding Digital
information 0V - 0.0048828125 V 0000000000 0.0048828125 V - 009765625 V 0000000001 009765625 V – 0.146484375 V 0000000010 ………… …….. ……….. …….. 4.990234375 V – 4.9951171875 V 1111111110 4.9951171875 V – 5 V 1111111111
Fourier Transform is one of the basic steps of the project. Fourier transform is grouped in two groups: continuously and discrete Fourier Transform. Two transforms match the objects between two spaces orthogonally. Transform for continuous objects is given in the form below.
dx e x f k F
jkx ( ) 2 1 ) ( (1) and dk e k F x f
jkx ( ) 2 1 ) ( (2)As seen in transform the object in X space is defined in k space. This transform provide very high comfortability in solution of differential equations because by the use of this transform differential equation in x space can be expressed as a linear equation in k space. 𝑓(𝑥) → 𝐹(𝑘) is called Fourier Transform and 𝐹(𝑘) → 𝑓(𝑥) is called inverse Fourier transform.
In the study, for expansion of Fourier transform up to 40 harmonics of a modeled signal, fundamental amplitude was assumed 100 and sequence of codes which analyses amplitude variations was written.
In order to use Fast Fourier Transform (FFT) command of Matlab to a microcontroller, the command must be written is C language. For this reason firstly, Matlab codes which do same function as FFT was written. Then these codes was adapted to C language and loaded to microcontroller. By the help of commands which converts codes to C language, for 40 harmonics, the circuit can operate in Proteus program. Every harmonic amplitude is calculated as a ratio of amplitude of fundamental frequency. By help of added buttons of the circuit calculated ratio of total harmonic distortion is shown by graphical LCD. For the study, the application of square wave to the circuit and its result were implemented. It has been verified that Fourier transform of a square wave to be a Sinc function.
In the study, data transfer between PIC 18F4620 and PC (personal computer) is implemented by data bus RS-232. Connection between Matlab inside the PC and circuit is established by RS-232 data bus and through this connection by using microcontroller, data are transferred to a Matlab and the same analysis performed by microcontroller is also performed in Matlab.
46
5. APPLICATION CIRCUIT
After establishing and operating the circuit on simulation program, the application phase of the study started. Firstly the control of the circuit on bread board was performed and later the circuit is printed on the card.
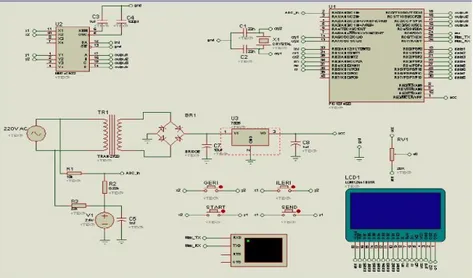
Due to absence of 220V city grid neutral terminal in the Proteus which is used in design stage, by using 220V AC sine source voltage divider without neutral terminal has been designed. Since keypad occupies space and causes the increase of the cost, on its place the number of buttons has been used. Full harmonics analyzer circuit designed on Proteus is given in figure 5.
Figure 5. Harmonics Analyzer Circuit
5.1. ANALYSIS OF HARMONICS OF SQUARE WAVE AND COMPARISON WITH MATLAB
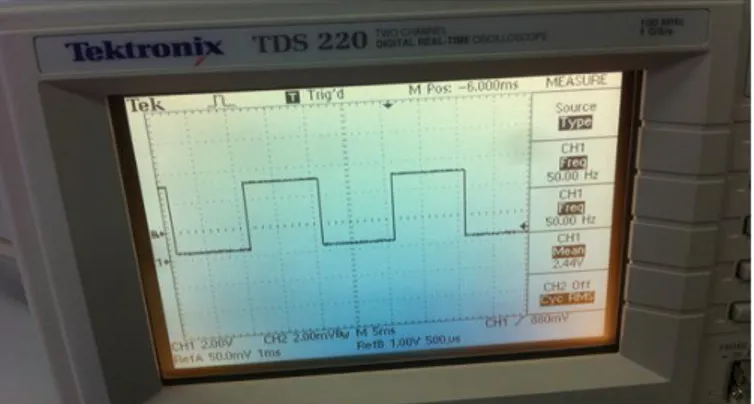
In analysis of harmonics of square wave, it is aimed to control the operation of harmonics analyzer circuit by programming second microcontroller. In circuit, second microcontroller is implemented by using second analog input. In figure 6, below, 0-5V square wave applied to input of microcontroller is shown. Measurements with by square wave are taken, these measurements are sent to MATLAB through RS-232 data bus and different between two measurements are obtained. Figure 7 shows frequency domain output.
Figure 6. 0-5 V square wave applied to input of microcontroller.
Figure 7. Representation of frequency domain of square wave. There is a very small difference which varies from 1% to 3% between the value measured by harmonics analyzer device and values measured by calculation of Matlab. These differences are evaluated as they are because of high sensitivity of calculation in Matlab.
5.2. COMPARISON BETWEEN DESIGNED ANALYZER AND PROFESSIONAL ANALYZER DEVICE AND COSTS
In application supply voltage of the circuit is given by two different ways. First way is by converting the city grid to be measured to +5V DC. Second way is by using +5V DC power source. During the application of second way, the insecurity is prevented since it prevents the circuit to operate with high voltages. At the same time in the circuit extra microcontroller for performing analysis of square wave has been used.
In the next stage of the study, harmonics of the city grid first are measured by professional device (Chroma 66202 Power Meter) and later they are measured
48
by designed harmonic analyzer circuit. Figure 8 shows designed analyzer circuit.
Figure 8. Measurement of city grid voltage harmonics by designed analyzer.
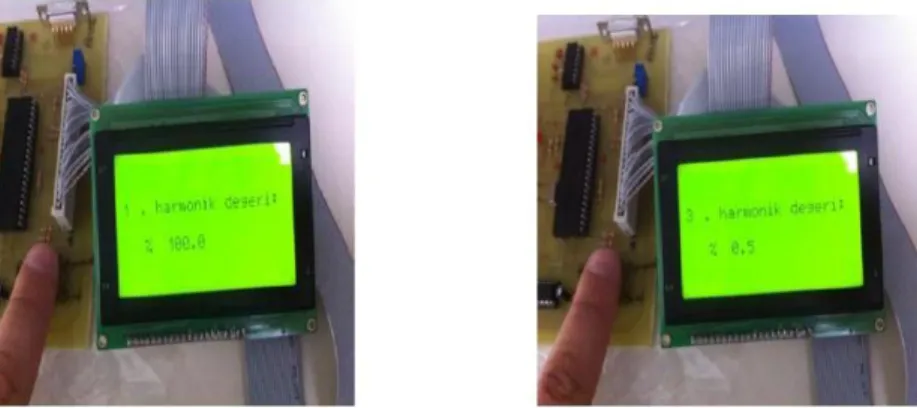
Figure 9 shows interface screen which shows measurement taken by Chroma 66202 Power Meter and figure 10 shows harmonics level measured by designed analyzer for fundamental component and the third harmonic as an example.
Figure 10 Fundamental component 100% and third harmonic 0.5% Although they are very small, there are differences between measurements taken by Chroma Power meter Device and our designed device. However there is a parallelism of rising ratio in values taken at same harmonic value of the measured signal. While third harmonic value in designed circuit is 0.5% Chroma device gives a value of 0.63%. Comparison of the taken values is given on table 2. Since there is errors in measurements, high tolerance values of a used devices especially tolerance value of device used to lower voltage level to 0-5V at analog input of microcontroller is very important.
Due to high tolerance interval of these devices there is diversity in values. Measured frequency signal according to software in designed device is kept constant as 50 Hz. But the range of measured frequencies in Chroma is 15 Hz – 10 kHz. For this reason, it affects directly the value of measured frequency.
Table 2. Comparison of measured harmonics level
Harmonics order Chroma Power Meter
(%) Designed device (%) 1 100 100 3 0.63 0.5 5 4.7 4.5 7 0.38 0.4 9 0.76 0.8 11 0.52 0.6 13 0.24 0.2
The important reason for error in measurements is sampling frequency. Sampling frequency of a designed harmonics analyzer is given by Nyquist
50
criteria and for 40 harmonics its minimum value is 4,000 Hz. In professional analyzer for 40 harmonics its value is 240 kHz. Another important reason for error in measurement is resolution of Analog-Digital Converter (ADC). While resolution of designed harmonics analyzer is 10 bits the resolution of ADC of Chroma is 16 bits.
A cost of the designed system is as follows;
a) Microcontroller PIC 18F4620 20 TL
b) Graphical LCD ITM-12864A 35 TL c) Key Encoder 74 C922 18 TL
d) Serial port IC MAX232 2 TL
e) Copper plate 20 TL
f) Diodes, resistors, capacitors, connectors ,button 10 TL
g) Circuit printing 40 TL
TOTAL =145 TL ~ 45 Dolar
6. CONCLUSION
By the help of the designed circuit, harmonics analyzer of low cost which works with acceptable error ratio has been implemented. As long as the designed circuit is mounted inside the case, it can be used as a suitable voltage analyzer for practical measurements. In this condition the designed analyzer has the form which can only measure voltage harmonics. On the other hand, in energy systems measuring current harmonics has its importance. In the future times by improving the design, the analyzer will have the form which can measure current harmonics as well.
REFERENCES
[1] IEEE Industry Applications Society/Power Engineering Society, “IEEE Recommend Practices and Requirements for Harmonic Control in Electrical Power System”, IEEE SM 519-1992, American National Standards Institute 4th Jan.1993.
[2] J. Arrillaga, D.A.Bradley, and P. S. Bodger, Power System Harmonics, New York: John Wiley Sons, ,pp.5-135,1985.
[3] Zbigniew Czaja. A microontroller system for Measurement of three independent components in impedance sensors using a single square pulse, Sensors and Actuators A: Physical, Volume 173, Issue 1, Pages 284–292 January 2012.
[4] J.Y.A. Foo, S.J. Wilson, G.R. Williams, M.A. Harris, D.M.Cooper . Measurement of pulse transit time using AT90S8535 microcontroller,
Measurement, Volume 39,Issue 6Pages 505–511, July 2006.
[5] Ahmad Mohammadi, Kaida Khalid , P.S. Bafti, M. Homaiee, Development of microcontrollerbased microwave system to measure solid content of have a rubber latex, Measurement Volume 45, Issue 3, Pages 571–579, April, 2012.
[6] Alberto J. Palma, Javier López-González , Luis J.Asensio, Maria Dolores Fernández-Ramos, Luis Fermin Capitán- Vallvey. Microcontroller-based portable instrument for stabilized optical oxygen sensor,Sensors and Actuators B: Chemical,Volume 121, Issue 2, Pages 629– 638, 20 February 2007.