Genotypic Variation in Tolerance to Boron Toxicity in
70 Durum Wheat Genotypes
Ayfer A. TORUN1, Atilla YAZICI2, Halil ERDEM3, ‹smail ÇAKMAK2 1Çukurova University, Faculty of Agriculture, Department of Soil Science, Adana - TURKEY 2Sabanc› University, Faculty of Engineering and Natural Sciences, 34956, ‹stanbul - TURKEY
3Çukurova University, Faculty of Agriculture, Department of Soil Science, Adana - TURKEY
Received: 26.12.2005
Abstract: By using 70 durum wheat (Triticum durum) genotypes, a greenhouse experiment has been carried out to study genotypic variation in tolerance to boron (B) toxicity in soil. Plants were grown in a soil containing 12 mg extractable B kg-1soil and treated additionally with (+B: 25 mg kg-1soil) and without B (-B: 0 mg B kg-1soil). Following 30 days of growth, only shoots have been harvested and analyzed for dry matter production and shoot concentrations of B. There was a large genotypic variation in tolerance to B toxicity based on the severity of leaf symptoms and decreases in dry matter production caused by B toxicity. Among the genotypes tested, the growth of the genotypes Sabil-1, Stn “S”, Aconhi-89 and Wadelmez-2 was not affected; even, there was a tendency for an increase in growth by B treatment. By contrast, the dry matter production of all other genotypes was markedly decreased by the applied B, particularly in the genotypes Lagost-3, Dicle-74, Brachoua/134xS-61 and Gerbrach. In case of the genotypes Brachoua/134xS-61 and Gerbrach, B application reduced dry weight of the plants by 2-fold. Interestingly, there was no relationship between shoot B concentrations and relative decreases in shoot dry weight by B toxicity. The most B-sensitive genotypes had generally much lower amount of B in shoot than the genotypes showing higher tolerance to B toxicity. This result indicates that the B-exclusion mechanism is not involved in differential expression of B tolerance within 70 durum wheat genotypes. It seems very likely that the internal mechanisms (e.g., adsorption to cell walls and compartementation of B in vacuoles) could be a more plausible explanation for B tolerance in the durum wheats tested in the present study.
Key Words: Boron toxicity, boron concentration, durum wheat, genotypic variation
Bor Toksisitesine Tolerans Bak›m›ndan 70 Makarnal›k Bu¤dayda Genotipsel Farkl›l›¤›n Araflt›r›lmas›
Özet: Toprakta bor (B) toksisitesine karfl› genotipsel farkl›l›¤›n boyutunu araflt›rmak amac›yla 70 makarnal›k bu¤day (Triticum durum) genotipi ile bir sera denemesi kuruldu. Bitkiler, extrakte edilebilir B’un 12 mg kg-1 oldu¤u bir toprakta iki ayr› B
muamelesine tutularak (+B: 25 mg B kg-1toprak; -B: 0 mg B kg-1soil) yetifltirildi. Otuz günlük bir büyüme döneminden sonra
bitkilerin yaln›zca yeflil aksam› hasat edildi ve genotipler kuru madde a¤›rl›¤› ve yeflil aksam B konsantrasyonu bak›m›ndan analiz edildi. Genotipler aras›nda topraktaki B toksisitesine karfl›, toksisite belirtilerinin fliddeti ve büyümedeki azalma bak›m›ndan büyük bir genotipsel varyasyonun oldu¤u bulundu. Test edilen genotiplerden Sabil-1, Stn “S”, Aconhi-89 ve Wadelmez-2, B uygulamas›ndan etkilenmedi ve hatta bu genotiplerde B’dan dolay› büyümede bir artma e¤ilimi ortaya ç›kt›. Buna karfl›l›k, di¤er genotiplerin tümünde B uygulamas› sonucu kuru madde a¤›rl›¤›nda azalmalar ortaya ç›kt›; bu azalmalar özellikle Lagost-3, Dicle-74, Brachoua/134xS-61 ve Gerbrach genotiplerinde görüldü. Genotiplerden Brachoua/134xS-61 ve Gerbrach’da B’dan dolay› kuru madde oluflumundaki azalma 2 kattan daha fazlayd›. ‹lginçtir ki, yeflil aksam B konsantrasyonu ile B’dan dolay› kuru madde oluflumunda ortaya ç›kan azalma yüzdesi aras›nda hiçbir iliflki bulunamad›. Genel olarak B tolerans› yüksek genotipler yüksek miktarlarda B birikimi gösterirken, duyarl› genotiplerde düflük düzeylerde B birikimi görülmüfltür. Bu sonuçlar, 70 genotip aras›nda görülen farkl› B tolerans›n›n, B’un köklerce al›nmayarak d›flar›da tutulmas› mekanizmas› ile iliflkili olmad›¤›n› göstermifltir. Bu çal›flmada test edilen genotipler aras›ndaki B’a karfl› farkl› duyarl›l›¤› aç›klamada B’un hücre duvarlar›nda tutulmas› gibi içsel tolerans mekanizmalar› daha kabul edilebilir mekanizma olarak karfl›m›za ç›kmaktad›r.
Anahtar Sözcükler: Bor toksisitesi, bor konsantrasyonu, makarnal›k bu¤day, genotipsel farkl›l›k
Introduction
Boron toxicity is a common mineral nutritional problem in arid and semiarid regions, causing significant decreases in growth and yield as reported for many countries (Nable et al., 1997). Also in Turkey, B toxicity has been reported as an important constraint to crop production, particularly in Central Anatolia (Sillanpaa, 1982). According to a soil survey study conducted by Gezgin et al. (2002) the concentration of extractable B with 0.01 M mannitol in 898 soil samples ranged from
0.01 to 63.9 mg kg-1soil with a mean value of 2.48 mg
kg-1
. Nearly 10 % of the soils sampled in Central Anatolia contained more than 5 mg extractable B per kg soil which is widely accepted critical concentration for occurrence of B toxicity in crop plants (Nable et al., 1997). A similar observation has been recently made by Avc› and Akar (2005) in a survey study on the barley grown fields in Central Anatolia and Transitional zones. According to this survey study, 15% and 6% of the samples collected at 189 sites showed light and severe B toxicity symptoms, respectively.
There are several approaches to B toxicity-related decreases in crop production, such as leaching B from soil profile and application of several organic compounds to inactivate (immobilize) B in soil (Keren and Bingham, 1985; Nable et al., 1997). However, such approaches to ameliorate B toxic soils are not practical and economically feasible to apply on large scale of areas with B toxicity. Alternatively, new plant genotypes could be developed with higher genetical ability to tolerate B toxicity in soils. Several screening studies have been conducted to determine the extent of genotypic variation in tolerance to B toxicity in different crop species such as wheat (Paull et al., 1988; Yau et al., 1995; Jamjod, 1996) and barley (Nable, 1988; Mahalakshmi et al., 1995). These studies showed existence of a large genotypic variation in susceptibility to B toxicity. Genotypes with higher tolerance to B toxicity in soil can be used in breeding programs to develop new and more B-tolerant cultivars for B-toxic soils.
Despite large number studies on B toxicity, physiological mechanisms affecting differential expression of B toxicity stress between genotypes are not well understood. Differences in root uptake, root-to-shoot transport and shoot accumulation of B should play a decisive role in differential expression of B tolerance between genotypes. As reviewed by Nable et al. (1997),
the level of B accumulated in shoot does not always correlate with the severity of B toxicity symptoms. In some genotypes, reduced uptake of B by roots plays a critical role in development of high tolerance to B toxicity while in some genotypes internal mechanisms (e.g., detoxification of B at cellular level) are involved in B tolerance.
As reported by Yau et al. (1995), durum wheats are highly sensitive to B toxicity. In durum wheat, genotypic variation to B is much lower than barley and bread wheat. Due to higher tolerance to B toxicity it is important to test new durum wheat germplasms to identify new genotypes with much higher tolerance to B toxicity. For a successful breeding program for development of B-tolerant genotypes, existence of a substantial genotypic variation is essential. In order to achieve a large genetic variation in B tolerance large number of genotypes should be used in the screening studies. However, in most cases, the screening studies related to the B toxicity tolerance included only a few genotypes (see Nable et al., 1997 for references). Therefore, in the present work, 70 durum wheat genotypes have been used to study the extent of genotypic variation in tolerance to B toxicity in soil. In addition, we have also studied the relationship between shoot B concentration and susceptibility of genotypes to B toxicity.
Materials and Methods
Using 70 durum wheat genotypes (Triticum durum) a greenhouse experiment has been carried out to study genotypic variation for tolerance to B toxicity in soils. Seeds of 70 durum wheat genotypes were obtained from the Department of Field Crops of the University of Çukurova, Adana. Plants were grown on a B-toxic soil which was transported from a B-toxic field close to Eskiflehir in Central Anatolia (Torun et al., 2003). The soil, used in the pot experiment had the following chemical and physical properties: texture loamy, CaCO3 33.4%, pH 7.69, organic matter 1.97%, and the DTPA-extractable concentration of Zn, Fe, Mn and Cu were 0.23, 1.11, 5.63 and 0.59, respectively. All analysis of the mentioned chemical and physical properties of soils was carried out by using standard methods described by Page et al. (1982), Klute et al. (1986) and Lindsay and Norvell (1978). The concentration of B extracted by
CaCl2/ Mannitol method was 12 mg kg-1
measured by using the method described in Cartwright et al. (1983).
Twenty seeds were sown in plastic pots containing 1.6 kg soil with (25 mg B per kg soil) and without B
supply. Boron was supplied in form of boric acid (H3BO3).
Before potting the soil was homogeneously treated with
a basal application of 200 mg N kg-1 soil as Ca(NO
3)2.
4H2O, 100 mg P kg-1
soil and 125 mg K kg-1
soil as
KH2PO4. After emergence, the plants were thinned to 10
seedlings per pot. After 30 days of growth under greenhouse conditions (when the symptoms of B toxicity were severe for most of genotypes), only shoots were harvested and dried at 70 °C and ashed in microwave by
using 2 ml of 35% H2O2 and 4 ml of 65% HNO3.
Following digestions, plant samples have been analyzed for B concentration by using the Azomethin-H method as described by Bingham (1982). Boron measurements were checked by using the certified B values in standard leaf samples obtained from the National Institute of Standards and Technology (Gaithersburg, MD, USA).
The total amount (content) of B per shoot was calculated by multiplying shoot B concentration with the shoot dry weights. The relative decrease in yield by B supply was calculated as given below:
Decrease % = [1-(Shoot dry weight at +B) / (Shoot dry weight at-B)] x 100
All measurements were taken in independent 3 replications. The data given in all tables represent means ± SD of three independent replications.
Results
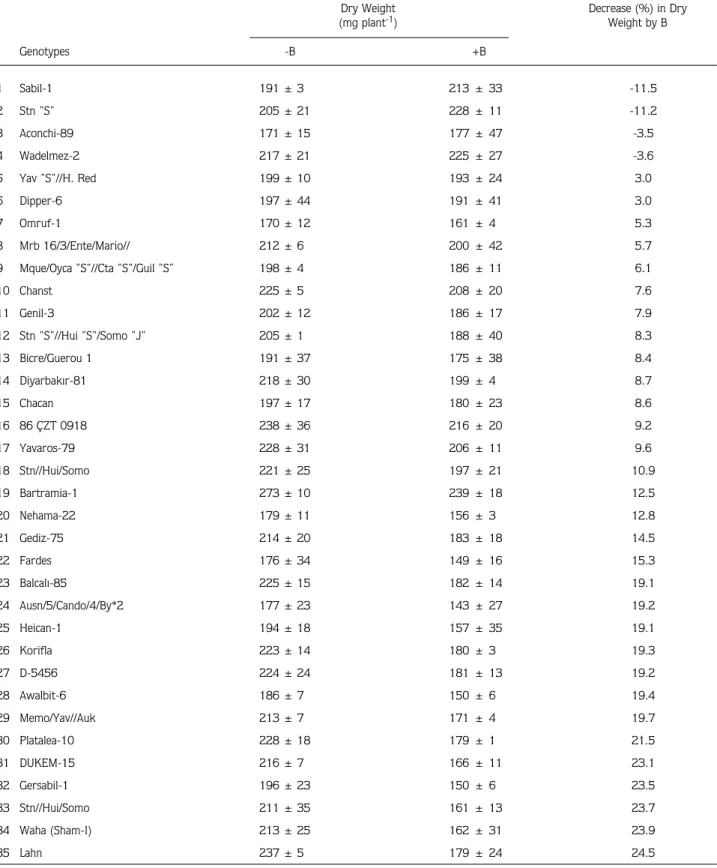
There was an important variation in severity and development time of B toxicity symptoms on leaves of 70 durum wheat genotypes when treated with B after 30 days. Among the genotypes tested, the genotypes with the number 5, 33 and 34 developed most rapidly B toxicity symptoms while the genotypes 3 and 4 developed very slight symptoms. Boron toxicity symptoms first appeared on the tips of older leaves by causing development of necrosis and drying of leaf tissue. With time, the symptoms became more severe and developed on the most part of older leaves. In most of genotypes, severity of B toxicity symptoms was associated with corresponding decreases in shoot dry matter production (Table 1).
There was a substantial genotypic difference in decreases of shoot dry matter production caused by B toxicity. While in some genotypes dry matter production was not affected from B toxicity, most of genotypes were, however, particularly sensitive ones and showed marked decreases in dry matter production. Interestingly, application of B at 25 mg per kg soil did not decrease the growth of the genotypes 1, 2, 3 and 4, but, even tended to improve the dry matter production. In contrast to these 4 genotypes, all other genotypes were severely affected from B-toxicity especially 67, 68, 69 and 70. In these 4 B-susceptible genotypes given at the bottom of Table 1, the shoot dry matter production was decreased nearly by factor 2 as a consequence of B application (Table 1).
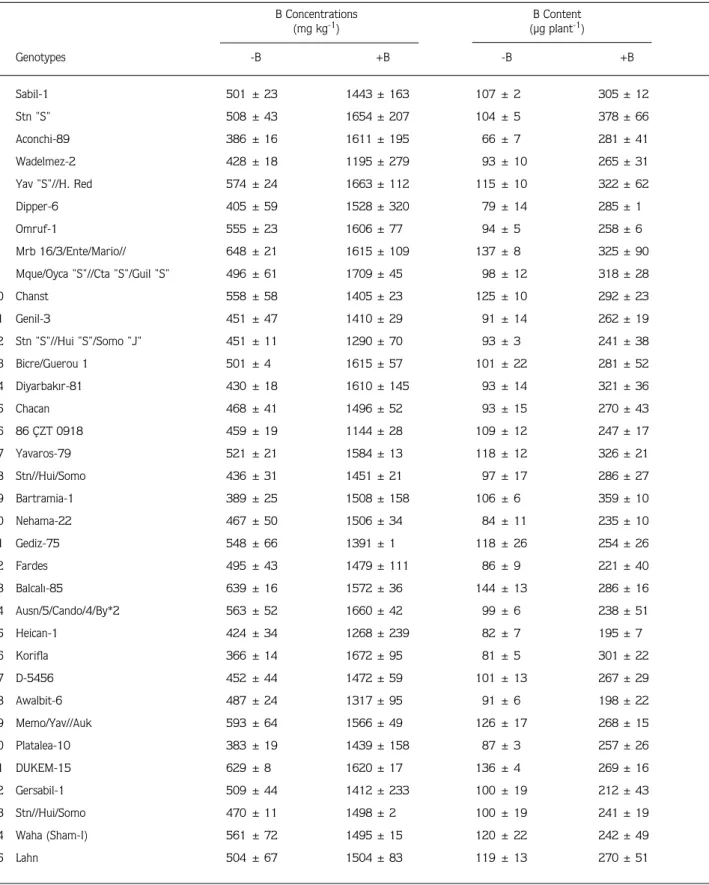
Shoot B concentration of the genotypes ranged from
324 mg kg-1 (Lahn / Haucan-1) to 648 mg kg-1 (Mrb
16/3/Ente/Mario//) with an average value of 475 mg
kg-1 (Table 2). Most of the genotypes had B
concentrations between 400 to 500 mg kg-1. Boron
application increased shoot concentration of all genotypes
from 475 to 1525 mg kg-1
dry weight. All genotypes contained more than 1000 mg B per kg shoot dry weight, indicating very high B accumulation in tissue after B application (Table 2). Among the genotypes tested, Andorrio-1, Omruf-3, Brachoua/134xS-61 and 85-ÇZT-14 had the highest B concentrations with around 1700
mg kg-1
dry weight, while the genotypes 86-ÇZT-0198, Wadelmez-6 and Wadelmez-2 were the genotypes possessing the lowest B concentration in shoot (e.g.,
around 1100 mg kg-1
) under B supply (Table 2). Also in the case of the total amount of B (content) genotypes showed large variation under both B treatments (Table 2). When B was not supplied, the shoot content of B
varied from 63 µg plant-1
(Zeina-2) to 163 µg plant-1
(Dicle-74) with an average value of 100 µg plant-1
. Interestingly, the most B sensitive genotype Gerbrach-1 had the lowest amount of B in shoot, while the second most tolerant genotype Stn “S” contained the highest level of shoot B content (Table 2).
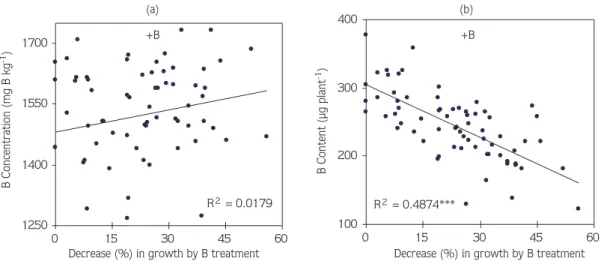
The relative decreases in shoot dry matter production were compared with the concentration and content of B in plants at B treatment (Figure 1). There was no significant relationship between the B concentration of plants and the decreases in shoot dry weight by B
application (R2
= 0.0018). Most interestingly, the total
amount of B in shoot showed a very significant (R2
= 0.49***) negative correlation with decreases in shoot dry
Table 1. Effect of varied supply of B (+B = 25 mg B kg-1) on the dry matter production of 70 durum wheat genotypes grown for 30 days under greenhouse conditions on a soil containing 12 mg extractable B kg-1. Data represent means ± SD of 3 independent replications.
Dry Weight Decrease (%) in Dry
(mg plant-1) Weight by B Genotypes -B +B 1 Sabil-1 191 ± 3 213 ± 33 -11.5 2 Stn "S" 205 ± 21 228 ± 11 -11.2 3 Aconchi-89 171 ± 15 177 ± 47 -3.5 4 Wadelmez-2 217 ± 21 225 ± 27 -3.6 5 Yav "S"//H. Red 199 ± 10 193 ± 24 3.0 6 Dipper-6 197 ± 44 191 ± 41 3.0 7 Omruf-1 170 ± 12 161 ± 4 5.3 8 Mrb 16/3/Ente/Mario// 212 ± 6 200 ± 42 5.7
9 Mque/Oyca "S"//Cta "S"/Guil "S" 198 ± 4 186 ± 11 6.1
10 Chanst 225 ± 5 208 ± 20 7.6 11 Genil-3 202 ± 12 186 ± 17 7.9 12 Stn "S"//Hui "S"/Somo "J" 205 ± 1 188 ± 40 8.3 13 Bicre/Guerou 1 191 ± 37 175 ± 38 8.4 14 Diyarbak›r-81 218 ± 30 199 ± 4 8.7 15 Chacan 197 ± 17 180 ± 23 8.6 16 86 ÇZT 0918 238 ± 36 216 ± 20 9.2 17 Yavaros-79 228 ± 31 206 ± 11 9.6 18 Stn//Hui/Somo 221 ± 25 197 ± 21 10.9 19 Bartramia-1 273 ± 10 239 ± 18 12.5 20 Nehama-22 179 ± 11 156 ± 3 12.8 21 Gediz-75 214 ± 20 183 ± 18 14.5 22 Fardes 176 ± 34 149 ± 16 15.3 23 Balcal›-85 225 ± 15 182 ± 14 19.1 24 Ausn/5/Cando/4/By*2 177 ± 23 143 ± 27 19.2 25 Heican-1 194 ± 18 157 ± 35 19.1 26 Korifla 223 ± 14 180 ± 3 19.3 27 D-5456 224 ± 24 181 ± 13 19.2 28 Awalbit-6 186 ± 7 150 ± 6 19.4 29 Memo/Yav//Auk 213 ± 7 171 ± 4 19.7 30 Platalea-10 228 ± 18 179 ± 1 21.5 31 DUKEM-15 216 ± 7 166 ± 11 23.1 32 Gersabil-1 196 ± 23 150 ± 6 23.5 33 Stn//Hui/Somo 211 ± 35 161 ± 13 23.7 34 Waha (Sham-I) 213 ± 25 162 ± 31 23.9 35 Lahn 237 ± 5 179 ± 24 24.5
36 AJAIA-11 225 ± 29 169 ± 35 24.9 37 AAZ 183 ± 7 137 ± 16 25.1 38 Om Rabi-3 191 ± 28 142 ± 48 25.7 39 Altar/Somo//Auk 151 ± 15 111 ± 52 26.5 40 Bagan-5 227 ± 51 167 ± 16 26.4 41 Moulsabil-1 216 ± 13 158 ± 23 26.9 42 Genil-5 204 ± 5 149 ± 44 27.0 43 Korifla (Sham-III) 214 ± 28 156 ± 20 27.1 44 Zeina-2 184 ± 26 131 ± 7 28.8 45 Omruf-2 221 ± 22 157 ± 27 29.0 46 Haucan/omRabi 12 246 ± 35 174 ± 14 29.3 47 85 ÇZT 14 192 ± 2 133 ± 33 30.7 48 Om Rabi-6 199 ± 14 137 ± 10 31.2 49 Guil/Apo//Ru/3/Chahbz 242 ± 48 166 ± 0 31.4 50 Wadelmez-6 212 ± 8 145 ± 49 31.6 51 Zeina-4 197 ± 11 134 ± 8 32.0 52 Lahn/Haucan-1 207 ± 18 140 ± 0 32.4 53 Gutruos-5 252 ± 6 170 ± 8 32.5 54 Omruf-3 189 ± 32 126 ± 28 33.3 55 Lahn/Haucan-2 209 ± 15 135 ± 18 35.4 56 Gdo V2 512/Cit//Ruff 229 ± 21 148 ± 0 35.4 57 Yaz›-40 209 ± 41 131 ± 55 37.3 58 Nehama-15 193 ± 16 121 ± 61 37.3 59 Aw12/Bit 176 ± 17 108 ± 25 38.6 60 Stojocri-7 217 ± 13 132 ± 14 39.2 61 Waha-1 188 ± 2 114 ± 8 39.4 62 Om Rabi5/Omguer-3 205 ± 44 124 ± 25 39.5 63 Waha-2 197 ± 24 119 ± 7 39.6 64 Andorrio-1 180 ± 8 106 ± 34 41.1 65 TE 8606 (Portugal)//Ch67// 255 ± 17 148 ± 37 42.0 66 Lagost-3 294 ± 28 165 ± 52 43.9 67 Dicle-74 321 ± 21 176 ± 23 45.2 68 Brachoua/134xS-61 242 ± 10 131 ± 78 45.9 69 Jabiru-4 227 ± 11 109 ± 18 52.0 70 Gerbrach-1 198 ± 12 87 ± 41 56.1 Mean 217 165 23.6
Dry Weight % Decrease in Dry
(mg plant-1) Weight by B
Genotypes -B +B
Table 2. Effect of varied supply of B (+B = 25 mg B kg-1) on the shoot B concentration and total amount of B (content) per shoot of 70 durum wheat genotypes grown for 30 days under greenhouse conditions on a soil containing 12 mg extractable B kg-1. Data represent means ±
SD of 3 independent replications. B Concentrations B Content (mg kg-1) (µg plant-1) Genotypes -B +B -B +B 1 Sabil-1 501 ± 23 1443 ± 163 107 ± 2 305 ± 12 2 Stn "S" 508 ± 43 1654 ± 207 104 ± 5 378 ± 66 3 Aconchi-89 386 ± 16 1611 ± 195 66 ± 7 281 ± 41 4 Wadelmez-2 428 ± 18 1195 ± 279 93 ± 10 265 ± 31 5 Yav "S"//H. Red 574 ± 24 1663 ± 112 115 ± 10 322 ± 62 6 Dipper-6 405 ± 59 1528 ± 320 79 ± 14 285 ± 1 7 Omruf-1 555 ± 23 1606 ± 77 94 ± 5 258 ± 6 8 Mrb 16/3/Ente/Mario// 648 ± 21 1615 ± 109 137 ± 8 325 ± 90
9 Mque/Oyca "S"//Cta "S"/Guil "S" 496 ± 61 1709 ± 45 98 ± 12 318 ± 28
10 Chanst 558 ± 58 1405 ± 23 125 ± 10 292 ± 23 11 Genil-3 451 ± 47 1410 ± 29 91 ± 14 262 ± 19 12 Stn "S"//Hui "S"/Somo "J" 451 ± 11 1290 ± 70 93 ± 3 241 ± 38 13 Bicre/Guerou 1 501 ± 4 1615 ± 57 101 ± 22 281 ± 52 14 Diyarbak›r-81 430 ± 18 1610 ± 145 93 ± 14 321 ± 36 15 Chacan 468 ± 41 1496 ± 52 93 ± 15 270 ± 43 16 86 ÇZT 0918 459 ± 19 1144 ± 28 109 ± 12 247 ± 17 17 Yavaros-79 521 ± 21 1584 ± 13 118 ± 12 326 ± 21 18 Stn//Hui/Somo 436 ± 31 1451 ± 21 97 ± 17 286 ± 27 19 Bartramia-1 389 ± 25 1508 ± 158 106 ± 6 359 ± 10 20 Nehama-22 467 ± 50 1506 ± 34 84 ± 11 235 ± 10 21 Gediz-75 548 ± 66 1391 ± 1 118 ± 26 254 ± 26 22 Fardes 495 ± 43 1479 ± 111 86 ± 9 221 ± 40 23 Balcal›-85 639 ± 16 1572 ± 36 144 ± 13 286 ± 16 24 Ausn/5/Cando/4/By*2 563 ± 52 1660 ± 42 99 ± 6 238 ± 51 25 Heican-1 424 ± 34 1268 ± 239 82 ± 7 195 ± 7 26 Korifla 366 ± 14 1672 ± 95 81 ± 5 301 ± 22 27 D-5456 452 ± 44 1472 ± 59 101 ± 13 267 ± 29 28 Awalbit-6 487 ± 24 1317 ± 95 91 ± 6 198 ± 22 29 Memo/Yav//Auk 593 ± 64 1566 ± 49 126 ± 17 268 ± 15 30 Platalea-10 383 ± 19 1439 ± 158 87 ± 3 257 ± 26 31 DUKEM-15 629 ± 8 1620 ± 17 136 ± 4 269 ± 16 32 Gersabil-1 509 ± 44 1412 ± 233 100 ± 19 212 ± 43 33 Stn//Hui/Somo 470 ± 11 1498 ± 2 100 ± 19 241 ± 19 34 Waha (Sham-I) 561 ± 72 1495 ± 15 120 ± 22 242 ± 49 35 Lahn 504 ± 67 1504 ± 83 119 ± 13 270 ± 51
36 AJAIA-11 459 ± 97 1400 ± 45 99 ± 34 236 ± 42 37 AAZ 566 ± 78 1541 ± 54 103 ± 10 211 ± 17 38 Om Rabi-3 535 ± 33 1627 ± 79 101 ± 11 229 ± 67 39 Altar/Somo//Auk 511 ± 59 1220 ± 193 78 ± 17 130 ± 42 40 Bagan-5 465 ± 77 1589 ± 95 105 ± 30 265 ± 9 41 Moulsabil-1 589 ± 52 1654 ± 179 128 ± 18 259 ± 9 42 Genil-5 466 ± 47 1517 ± 119 95 ± 11 223 ± 49 43 Korifla (Sham-III) 430 ± 50 1588 ± 100 93 ± 22 247 ± 16 44 Zeina-2 339 ± 53 1629 ± 215 63 ± 15 213 ± 17 45 Omruf-2 448 ± 48 1674 ± 36 98 ± 4 262 ± 39 46 Haucan/omRabi 12 409 ± 13 1601 ± 45 100 ± 12 279 ± 30 47 85 ÇZT 14 626 ± 39 1781 ± 13 120 ± 7 237 ± 56 48 Om Rabi-6 427 ± 16 1639 ± 57 85 ± 3 224 ± 8 49 Guil/Apo//Ru/3/Chahbz 424 ± 74 1597 ± 13 103 ± 27 265 ± 2 50 Wadelmez-6 341 ± 29 1172 ± 219 72 ± 3 165 ± 26 51 Zeina-4 415 ± 39 1514 ± 111 81 ± 5 203 ± 28 52 Lahn/Haucan-1 376 ± 38 1441 ± 145 78 ± 7 202 ± 20 53 Gutruos-5 423 ± 25 1506 ± 6 106 ± 3 256 ± 14 54 Omruf-3 539 ± 9 1731 ± 138 102 ± 18 216 ± 32 55 Lahn/Haucan-2 324 ± 40 1495 ± 29 68 ± 12 201 ± 24 56 Gdo V2 512/Cit//Ruff 386 ± 75 1545 ± 11 87 ± 6 229 ± 2 57 Yaz›-40 479 ± 53 1458 ± 76 99 ± 9 189 ± 70 58 Nehama-15 456 ± 46 1594 ± 22 89 ± 16 192 ± 94 59 Aw12/Bit 438 ± 42 1274 ± 139 77 ± 4 139 ± 47 60 Stojocri-7 550 ± 27 1568 ± 54 119 ± 1 207 ± 15 61 Waha-1 516 ± 1 1637 ± 1 97 ± 1 187 ± 14 62 Om Rabi5/Omguer-3 435 ± 54 1506 ± 3 88 ± 8 187 ± 39 63 Waha-2 499 ± 58 1589 ± 6 98 ± 9 189 ± 12 64 Andorrio-1 519 ± 60 1732 ± 127 93 ± 10 181 ± 45 65 TE 8606 (Portugal)//Ch67/ 451 ± 75 1491 ± 40 114 ± 11 221 ± 61 66 Lagost-3 453 ± 70 1656 ± 13 134 ± 30 273 ± 84 67 Dicle-74 506 ± 18 1461 ± 18 163 ± 21 257 ± 36 68 Brachoua/134xS-61 345 ± 16 1770 ± 251 83 ± 9 222 ± 105 69 Jabiru-4 464 ± 96 1685 ± 205 105 ± 17 182 ± 9 70 Gerbrach-1 415 ± 61 1468 ± 223 83 ± 16 123 ± 41 Mean 475 1525 100 244 Table 2. Continued. B Concentrations B Content (mg kg-1) (µg plant-1) Genotypes -B +B -B +B
weight under B supply (Figure 1), indicating existence of a poor relationship between B concentration of plants and decreases in shoot growth under B toxicity.
Discussion
The results obtained indicate a substantial range of genotypic tolerance to B toxicity in soil between 70 durum wheat genotypes. This genotypic variation in tolerance to B toxicity was based on the decreases in dry matter production after growing genotypes under B supply (Table 1) and also the extent of the B-toxicity symptoms on the leaves. Among the genotypes tested the genotypes Sabil-1 and Stn “S” were the most tolerant, while the genotypes Jabiru-4 and Gerbrach-1 were classified as the most sensitive genotypes to B toxicity.
When B added to soil at 25 mg kg-1
soil, the dry matter production capacity of Sabil-1 and Stn “S” was not affected, while there was around 50 % decrease in dry weight of the genotypes Jabiru-4 and Gerbrach-1 (Table 1). A similar genetic variation in tolerance to B toxicity was also shown in other durum wheat genotypes by Jamjod (1996) in 300 durum wheat and by Yau et al. (1995) in 19 durum wheat genotypes. Existence of such large genotypic variation is promising and can be exploited in breeding programs aiming at development of B-tolerant genotypes. In wheat, several chromosomal regions and DNA markers have been identified to use in
molecular marker-assisted selection for B toxicity tolerant genotypes (Jefferies et al., 2000).
The reason for the large genotypic variation in tolerance to B toxicity could not be understood. Despite considerable differences in shoot B concentration of genotypes, there was a very poor relationship between shoot B concentration and decreases in growth caused by B toxicity (Figure 1; Table 2). For most of the genotypes, the shoot concentrations of B were not related to the B toxicity–induced decreases in shoot growth. Similar results were also reported for both greenhouse-grown (Mahalakshmi et al., 1995) and field-grown (Torun et al., 2003) barley genotypes. Differences in susceptibility to B toxicity in soil did not correlate with leaf or shoot concentration of B. Also in the case of durum wheat (Yau et al., 1995), the shoot B concentration was not related to the shoot growth under B toxicity conditions. By contrast, in several other studies conducted with cereal and legume species, it has been found that the genotypes having higher tolerance to B toxicity had accordingly lower concentration of B in shoot (Nable, 1988; Paull et al., 1992a, 1992b). The reason for the controversial results between different studies could not be understood, and might be related to the different experimental conditions and genotypes used in the corresponding studies. In good agreement with this suggestion, Figure 1 shows that some genotypes are available within the 70 durum wheat genotypes in which
R2 = 0.0179 1250 1400 1550 1700 0 15 30 45 60
Decrease (%) in growth by B treatment
B Content (µg plant -1) +B (a) R2 = 0.4874*** 100 200 300 400 0 15 30 45 60
Decrease (%) in growth by B treatment
B Concentration (mg B kg
-1)
(b) +B
Figure 1. Relationships between the shoot concentration (a) and content (b) of B and the relative decreases in shoot growth caused by B treatment in seventy 30-day-old durum wheat genotypes grown on a soil treated with 25 mg B kg soil-1.
a close relationship could be found between shoot B concentration and decreases in shoot growth due to B toxicity.
The concentration of B in shoot can be affected by the inherently different growth rates (dry matter production rates) of genotypes, which can cause a dilution or concentration effects on the B concentration in the tissue. Therefore, we calculated the total amount of B per shoot (e.g., B content). It was interesting to notice that there was a very clear inverse relationship between the total amount of B per shoot and the decreases in shoot dry matter production by B toxicity (Figure 1). This inverse
relationship was statistically very significant (R2 =
0.49***), and clearly indicates that for just all genotypes tested in the present study the B-exclusion mechanism does not operate as a tolerance mechanism, which could result in lower accumulation of B in the plant tissue. It seems very likely that the internal mechanisms are primarily involved in differential expression of B toxicity tolerance in the 70 durum wheat genotypes. As discussed by Nable et al. (1997) and Wimmer et al. (2003), there are several internal mechanisms affecting high B tolerance at cellular level, such as differential pattern in B
distribution at cellular or organ level and adsorption (fixation) of B by cell walls. According to Wimmer et al. (2003), level of soluble B (not total B) concentration in cytoplasm could be an important physiological parameter for understanding the role of the tissue B in expression of B toxicity in plants.
Further work is, therefore, needed to test the most tolerant and sensitive genotypes presented in Table 1 for the amount of the cell wall-adsorbed B and the water soluble B. This work could contribute to a better understanding of the physiological mechanisms involved in differential expression of B toxicity within the 70 durum wheat genotypes. The results obtained from such physiological studies could be helpful in development of reliable screening parameters for selection of B-tolerant genotypes in breeding programs. In addition, the most promising genotypes should be tested under field conditions on B toxic soils to verify the results.
Acknowledgements
This research has been financially supported by the Çukurova University Research Fund.
References
Avc›, M. and T. Akar. 2005. Severity and spatial distribution of boron toxicity in barley cultivated areas of Central Anatolia and Transitional Zones. Turk. J. Agric. For. 29: 377-382.
Bingham, F.T. 1982. Methods of soil analysis. Part 2. Chemical and Microbiological Properties. Agronomy Monograph No: 9, 2nd
Ed. Am Soc. of Agron. Soil Sci. Soc. of Am, USA.
Cartwright, B., K.G. Tiller, B.A. Zarcinas and L.R. Spouncer. 1983. The chemical assessment of the boron of soils. Aust. J. Soil Res. 21: 321-332.
Gezgin, S., N. Dursun, M. Hamurcu, M. Harmankaya, M. Önder, B. Sade, A. Topal, N. Çiftçi, B. Acar and M. Babao¤lu. 2002. Determination of Boron contents of soils in Central-Anatolia Cultivated Lands and its relationship, between soil and water characteristics. In: Boron in Plant and Animal Nutrition. 1sted.
(Ed: H. E. Goldbah). Kluwer Academic Pub. New York. pp: 391-400.
Jamjod, S. 1996. Genetics of boron tolerance in durum wheat. Ph. D. Thesis, The University of Adelaide, South Australia.
Jefferies, S.P., M.A. Palotta and J.G. Paull. 2000. Mapping and validation of chromosome regions conferring boron toxicity tolerance in wheat (Triticum aestivum) Theor. Appl. Gen. 101: 767-777.
Keren, R. and Bingham, F.T. 1985. Boron in water, soils and plants. Adv. Soil Sci. 1: 230-276.
Klute, A., G.S. Campbell, R.D. Jackson, M.M. Mortland and D.R. Nielsen. 1986. Methods of soil analysis. Part 1. Physical and Mineralogical Methods (Second edition). Madison, Wisconsin USA. Lindsay, W.L. and W.A. Norvell. 1978. Development of DTPA soil test for zinc, iron, manganese, and copper. Soil Sci. Soc. Am. J. 42: 421-428.
Mahalakshmi, V., S.K. Yau, J. Ryan, and J.M. Peacock. 1995. Boron toxicity in barley (Hordeum vulgare L) seedlings in relation to soil temperature. Plant Soil 177: 151-156
Nable, R.O. 1988. Resistance to boron toxicity amongst several barley and wheat cultivars: a preliminary examination of the resistance mechanism. Plant Soil 112: 45-57.
Nable, R.O., G. S. Banuelos and J. G. Paull. 1997. Boron Toxicity. Plant Soil 198: 111-115.
Page , A.L., R.H. Miller, D.R. Keeney, D.E. Baker, R. Ellis and J.D. Rhoades. 1982. Methods of soil analysis. Part 2. Chemical and Microbiological Properties (Second edition). Madison, Wisconsin USA.
Paull, J.G., R.O. Nable and A.J. Rathjen. 1992a. Physiological and genetic control of the tolerance of wheat to high concentrations of boron and implications for plant breeding. Plant Soil 146: 251-260.
Paull, J.G., R.O. Nable, A.W.H. Lake, M.A. Materne and A.J. Rathjen. 1992b. Response of annual medics (Medicago spp) and field peas (Pisum sativum) to high concentrations of boron: genetic variation and the mechanism of tolerance. Aust. J. Agric. Res. 43: 203-213.
Paull, J.G., A.J. Rathjen and B. Cartwright. 1988. Genetic control of tolerance to high concentrations of soil boron in wheat. In Proc. 7thInt. Wheat Genetics Symposium, Cambridge. Eds. T.E. Miller
and R.M.D. Koebner, pp 871-877.
Sillanpaa, M. 1982. Micronutrients and the nutrient status of soils: A global study. FAO Soils Bulletin 48. Rome: Food and Agriculture Organization of the United Nations.
Torun, B., M. Kalayc›, L. Öztürk, A. Torun, M. Ayd›n, and ‹. Çakmak. 2003. Differences in shoot boron concentrations, leaf symptoms, and yield of Turkish barley cultivars grown on boron-toxic soil in field. J. Plant Nutr. 26: 1735-1747.
Wimmer, M.A., K.H. Muhling, A. Lauchli, P. H. Brown and H.W.E. Goldbach. 2003. The interaction between salinity and boron toxicity affects the subcellular distribution of ions and proteins in wheat leaves. Plant Cell Environ. 26: 1267-1274
Yau, S.K., M.M. Nachit, J. Ryan and J. Hamblin. 1995. Phenotypic variation in boron toxicity tolerance at seedling stage in durum wheat (Triticum durum). Euphytica 83: 185-191.