Dergi web sayfası:
www.agri.ankara.edu.tr/dergi www.agri.ankara.edu.tr/journalJournal homepage:
TARIM BİLİMLERİ DERGİSİ
—
JOURNAL OF AGRICUL
TURAL SCIENCES
21 (2015) 167-176
Green Long Pepper Growth under Different Saline and Water Regime
Conditions and Usability of Water Consumption in Plant Salt Tolerance
Ali ÜNLÜKARAa, Ahmet KURUNÇb, Bilal CEMEKca Erciyes University, Faculty of Agriculture Seyrani, Department of Biosystem Engineering, Kayseri, TURKEY bAkdeniz University, Faculty of Agriculture, Department of Farm Structures and Irrigation, Antalya, TURKEY cOndokuzmayıs University, Faculty of Agriculture, Department of Farm Structures and Irrigation, Samsun, TURKEY
ARTICLE INFO Research Article
Corresponding Author: Ali ÜNLÜKARA, E-mail: [email protected], Tel: +90 (506) 291 52 99 Received: 27 November 2013, Received in Revised Form: 24 March 2014, Accepted: 16 June 2014
ABSTRACT
Both electrical conductivity of soil saturation paste extract (ECe) and plant water consumption (ET) should be considered
for assessing crop yield tolerances to salinity since ET decreases by increased salinity effects. In this study, conducted in a greenhouse under controlled conditions, it was afforded to use soil salinity and water consumption for the purpose of assessing plant responses to salinity. Additionally, growth and yield of green long pepper (Capsicum annuum L.
Demre) under different saline and water regime conditions were examined. For these purposes, the green long pepper
were exposed to six water salinity levels (S1= 0.65; S2= 2.0; S3= 3.0; S4= 4.0; S5= 5.0 and S6= 7.0 dS m-1) and four water
application rates (IR1= 1.43; IR2= 1.0; IR3= 0.75 and IR4= 0.50 times of depleted water). The yield response factor (Ky), is 1.56 for salinity stress and 1.66 for water stress. Water consumption of the plant exponentially decreased (ET=
0.83×ECe-0.17) whereas relative fruit yield decreased linearly (7.03%) for unit increase in soil salinity after a threshold
value of 1.20 dS m-1. A stronger three-dimensional relation was found among relative yield, relative water consumption
and soil salinity (R2= 0.94). Using water consumption as a second factor in evaluation of plant response to salinity may
be useful for reflecting effects of different climatic conditions.
Keywords: Capsicum annuum L. Demre; Water consumption; Salinity; Water deficiency; Yield response factor; Salinity model
Farklı Tuzluluk ve Sulama Rejimi Şartlarında Sivri Biber Gelişimi ve
Bitki Tuzluluk Toleransında Su Tüketiminin Kullanılabilirliği
ESER BİLGİSİ Araştırma Makalesi
Sorumlu Yazar: Ali ÜNLÜKARA, E-posta:[email protected], Tel: +90 (506) 291 52 99 Geliş Tarihi: 27 Kasım 2013, Düzeltmelerin Gelişi: 24 Mart 2014, Kabul: 16 Haziran 2014
ÖZET
Bitki su tüketiminin artan tuzluluğun etkisiyle azalmasından dolayı, bitkilerin tuzluluğa karşı toleranslarının belirlenmesinde, toprağın saturasyon çamuru ekstraktı elektriksel iletkenliği (ECe) ile bitki su tüketimi (ET) birlikte
168
Ta r ı m B i l i m l e r i D e r g i s i – J o u r n a l o f A g r i c u l t u r a l S c i e n c e s 21 (2015) 167-1761. Introduction
Pepper is cultivated nearly all over the world and 29601 Mt produced from 1837704 ha area in 2011. Turkey is the third of largest pepper producer (1975 Mt) after China (15520 Mt) and Mexico (2131 Mt) (FAOSTAT 2014 a, b).
In general, irrigated agriculture has faced the challenge of sustaining its productivity for centuries. As well as irrigation-induced activities, soil and water salinity and sodicity problems continue to plague agricultural production. In order to produce sufficient food for the world’s growing population, control of these problems, increasing productivity of water use in agriculture and also finding new ways to utilize the extensive sodic and saline soils and water resources are vital and urgent. In this respect, proper utilization of water for both plant growth and soil salinity control is important and necessary (Pessarakli & Szabolcs 1999).
Maas & Hoffman (1977) developed a salt tolerance model and the model widely accepted by the other researchers studied on salinity. According to the model, plants tolerate or stand soil salinity until a threshold value and then linear yield reduction was seen for unit increase in soil salinity. Air temperature, humidity and air pollution influence plant salt tolerance significantly. In general, most crops are more tolerance to salinity under cool, humid conditions than under hot, dry conditions (Hoffman & Letey 1990). For the same plant, salt tolerances may also change between varieties of that
plant. In Maas & Hoffman model (1977) climate effects were not considered on plant salt tolerance.
Plant water consumption also decreased with increasing soil salinity. Letey & Dinar (1986) stated that different conditions for evapotranspiration were obtained by applying different soil moisture regimes but rarely by using saline water. Ozturk et al (2004) reported decreasing effect of salinity on water consumption for lemon balm, Yurtseven et al (2005) for tomato, Ünlükara et al (2008) for okra, Düzdemir et al (2009) for cowpea, Ünlükara et al (2010) for eggplant, Kurunc et al (2011) for bell pepper. Plant water consumption also changes with changing climatic conditions. In hot and dry climate, plants deplete more water than in warm and humid climate. Water consumption increases with increasing solar radiation, temperature and wind speed and decrease with increasing relative humidity. In other words, water consumption is a combined result of weather conditions for a given plant.
The first objective of this study is to determine the water consumption changes under saline conditions and effort to use the water consumption as a second factor with soil salinity for assessment of plant salinity responses in case of long green pepper. The second objective is to determine the relation between relative yield decrease and evapotranspiration decrease under water stress and salinity stress. Final purpose is to determine the effects of salinity and water stress on long pepper yield, fruit number and quality, vegetative and root growth.
değerlendirilmelidir. Kontrollü şartlarda serada yürütülen bu çalışmada bitkilerin tuzluluğa karşı tepkilerinin değerlendirilmesinde toprak tuzluluğu ve bitki su tüketimi birlikte dikkate alınmıştır. Buna ilaveten sivri biberin (Capsicum annuum L. Demre) farklı tuz ve su rejimi şartları altında verim ve gelişmesi incelenmiştir. Bu amaçla, sivri biber altı düzeyde sulama suyu tuzluluğuna (S1= 0.65; S2= 2.0; S3= 3.0; S4= 4.0; S5= 5.0 ve S6= 7.0 dS m-1) ve dört su
uygulama oranına (tüketilen suyun IR1= 1.43; IR2= 1.0; IR3= 0.75 ve IR4= 0.50 katı) maruz bırakılmıştır. Tuzluluk stresi
için verim tepki faktörü (Ky) 1.56 ve su stresi için 1.66 olarak belirlenmiştir. Birim toprak tuzluluğu artışı için 1.20 dS m-1
eşik değerinden sonra nispi meyve verimi doğrusal şekilde azalırken (% 7.03), su tüketimi üstel şekilde azalmıştır (ET= 0.83×ECe-0.17). Nispi verim, nispi su tüketimi ve toprak tuzluluğu arasında çok kuvvetli üç boyutlu ilişki bulunmuştur
(R2= 0.94). Bitkilerin tuzluluğa karşı streslerinin belirlenmesinde ikinci bir faktör olarak su tüketiminin kullanılması,
farklı iklim şartlarının etkisinin yansıtılmasında yararlı olabilecektir.
Anahtar Kelimeler: Capsicum annuum L. Demre; Su tüketimi; Tuzluluk; Su kısıtı; Verim tepki faktörü; Tuzluluk modeli © Ankara Üniversitesi Ziraat Fakültesi
169
Ta r ı m B i l i m l e r i D e r g i s i – J o u r n a l o f A g r i c u l t u r a l S c i e n c e s 21 (2015) 167-1762. Material and Methods
To determine the plant water consumption, growth, yield and yield quality of long green pepper (Capsicum annuum l. Demre) under different saline and water regime conditions, two experiments were conducted under greenhouse conditions in Tokat province of Turkey. In the experiment 1, plants were exposed to six different irrigation water salinity levels (S1= 0.65; S2= 2.0; S3= 3.0; S4= 4.0; S5= 5.0 and S6= 7.0 dS m-1) and in the experiment
2, plant were exposed to four different amount of irrigation water (IR1= 1.43; IR2= 1.0; IR3= 0.75 and
IR4= 0.50 times of depleted water from the field
capacity) after seedling establishment. S1 and IR2
treatments were control treatments of the first and second experiments, respectively. Both experiments were conducted in a randomized block design with 5 replications between 10 June and 20 September in 2006.
To determine water depletion precisely, the pepper were grown in weighing pots like lysimeters. Therefore, water depletion was monitored by weighing the pots and irrigation water amounts were calculated by using Equation (1) for the treatments of salinity and Equation (2) for the treatments of irrigation regimes experiments (Ozturk et al 2004; Yurtseven et al 2005; Ünlükara et al 2008; Kurunc et al 2011):
LF
W
W
IW
w P PFC
1
)
(
(1) IR w P PFCW
C
W
IW
(
)
(2) Where; IW is the amount of irrigation water application (L); LF is the leaching fraction (taken as LF= 0.30); WPFC is the pot weight (kg) at field capacity; WP is the pot weight (kg) just before irrigation; w is the unit mass of water (1 kg L-1) and CIR is the water application coefficient for irrigation regime experiment.
After each irrigation application, collected drainage water in a drain pan under each pot observed until drainage water flows from pot orifices nearly ceased and then measured. Irrigation applications were performed between 3 and 6 day intervals throughout the experiment before readily available water in control treatments was not depleted. Water balance method was used to calculate the evapotranspiration (ET) between two consecutive irrigations (Unlukara et al 2008; Yurtseven et al 2005).
In order to eliminate the effects of sodium adsorption ratios (SAR), saline waters were prepared by using the calculated amounts of CaCl2, MgSO4 and NaCl considering the desired salinity levels for the treatments of salinity experiment. Prepared saline waters for each treatment were stored in 100 liter-plastic containers. ECi of these waters were controlled by an EC/pH meter (Jenway 430 model) before each irrigation application and the adjustment was done if necessary (Ünlükara et al 2008; Düzdemir et al 2009; Ünlükara et al 2010). Tap water (ECi= 0.65 dS m-1) was used to irrigate of the control treatment in the salinity experiment and the treatments of the irrigation regime experiment.
Sandy loam textured soil with 17% clay, 16.2% silt and 66.8% sand and a unit weight of 1.57 g cm-3 was used in both experiments. The gravimetric soil water hold at saturation and field capacity were 26.1% and 15.8%, respectively. Forty-five kg of air-dried soil was used to fill each pot with 33 cm height, 32 cm bottom and 39 cm top diameters and 32.7 dm3 in volume. Amount of fertilizer to be applied to each pot were calculated by considering 135 kg ha-1 for N, 37.5 kg ha-1 for P and 75 kg ha-1 for K as suggested by Doorenbos Kassam (1986). All of the P as diammonium phosphates (DAP) and K as potassium sulphate (K2SO4) and one half of the N were applied to each treatment before transplanting whereas other half of the N applied after 20 days from initiation of the experiments. Some part of N requirement were derived from DAP and the rest from ammonium nitrate fertilizers.
Green pepper seedlings were transplanted to the lysimeters in 10 June 2006 and the plants were exposed to saline waters or different amounts of irrigation waters after one week from ones transplanted. As ripened, fruits were harvested throughout the experiments until September 20 (Totally 103 days from the transplanting to the last harvest).
At each harvest, the harvested fruits were weighted as fresh and oven-dried at 70 C to a constant dry weight in order to determine fruit dry matter ratio. A reflectometer was used to determine the total soluble solids (TSS) as brix. At the end of the experiment, plant heights and stem diameters were measured, the plants were cut at 1 cm above the soil surface and vegetative fresh and dry weights (oven-dried at 70 C to a constant weight) were obtained for each replication. Just after the plants were cut, soil samples were taken from entire depth of root zone of each pot to determine electrical conductivities of the saturated soil paste extracts (ECe) by an EC/pH meter (Jenway 430 model) (Richards 1969). After soil sampling, the plant roots were gently removed from each pot by washing the soil inside the pot to determine plant root lengths, fresh and dry weights.
Salt tolerance model suggested by Maas Hoffman (1977) was used in order to evaluate plant response to salinity. The yield response factors (Ky) for both water and salinity stresses were obtained (Stewart Hagan 1973; Doorenbos Kassam 1986).
(1)
LF
W
W
IW
w P PFC
1
)
(
(1) IR w P PFCW
C
W
IW
(
)
(2) Where; IW is the amount of irrigation water application (L); LF is the leaching fraction (taken as LF= 0.30); WPFC is the pot weight (kg) at field capacity; WP is the pot weight (kg) just before irrigation; w is the unit mass of water (1 kg L-1) and CIR is the water application coefficient for irrigation regime experiment.
After each irrigation application, collected drainage water in a drain pan under each pot observed until drainage water flows from pot orifices nearly ceased and then measured. Irrigation applications were performed between 3 and 6 day intervals throughout the experiment before readily available water in control treatments was not depleted. Water balance method was used to calculate the evapotranspiration (ET) between two consecutive irrigations (Unlukara et al 2008; Yurtseven et al 2005).
In order to eliminate the effects of sodium adsorption ratios (SAR), saline waters were prepared by using the calculated amounts of CaCl2, MgSO4 and NaCl considering the desired salinity levels for the treatments of salinity experiment. Prepared saline waters for each treatment were stored in 100 liter-plastic containers. ECi of these waters were controlled by an EC/pH meter (Jenway 430 model) before each irrigation application and the adjustment was done if necessary (Ünlükara et al 2008; Düzdemir et al 2009; Ünlükara et al 2010). Tap water (ECi= 0.65 dS m-1) was used to irrigate of the control treatment in the salinity experiment and the treatments of the irrigation regime experiment.
Sandy loam textured soil with 17% clay, 16.2% silt and 66.8% sand and a unit weight of 1.57 g cm-3 was used in both experiments. The gravimetric soil water hold at saturation and field capacity were 26.1% and 15.8%, respectively. Forty-five kg of air-dried soil was used to fill each pot with 33 cm height, 32 cm bottom and 39 cm top diameters and 32.7 dm3 in volume. Amount of fertilizer to be applied to each pot were calculated by considering 135 kg ha-1 for N, 37.5 kg ha-1 for P and 75 kg ha-1 for K as suggested by Doorenbos Kassam (1986). All of the P as diammonium phosphates (DAP) and K as potassium sulphate (K2SO4) and one half of the N were applied to each treatment before transplanting whereas other half of the N applied after 20 days from initiation of the experiments. Some part of N requirement were derived from DAP and the rest from ammonium nitrate fertilizers.
Green pepper seedlings were transplanted to the lysimeters in 10 June 2006 and the plants were exposed to saline waters or different amounts of irrigation waters after one week from ones transplanted. As ripened, fruits were harvested throughout the experiments until September 20 (Totally 103 days from the transplanting to the last harvest).
At each harvest, the harvested fruits were weighted as fresh and oven-dried at 70 C to a constant dry weight in order to determine fruit dry matter ratio. A reflectometer was used to determine the total soluble solids (TSS) as brix. At the end of the experiment, plant heights and stem diameters were measured, the plants were cut at 1 cm above the soil surface and vegetative fresh and dry weights (oven-dried at 70 C to a constant weight) were obtained for each replication. Just after the plants were cut, soil samples were taken from entire depth of root zone of each pot to determine electrical conductivities of the saturated soil paste extracts (ECe) by an EC/pH meter (Jenway 430 model) (Richards 1969). After soil sampling, the plant roots were gently removed from each pot by washing the soil inside the pot to determine plant root lengths, fresh and dry weights.
Salt tolerance model suggested by Maas Hoffman (1977) was used in order to evaluate plant response to salinity. The yield response factors (Ky) for both water and salinity stresses were obtained (Stewart Hagan 1973; Doorenbos Kassam 1986).
(2) Where; IW is the amount of irrigation water application (L); LF is the leaching fraction (taken as LF= 0.30); WPFC is the pot weight (kg) at field capacity; WP is the pot weight (kg) just before
irrigation; rw is the unit mass of water (1 kg L-1) and
CIR is the water application coefficient for irrigation
regime experiment.
After each irrigation application, collected drainage water in a drain pan under each pot observed until drainage water flows from pot orifices nearly ceased and then measured. Irrigation applications were performed between 3 and 6 day intervals throughout the experiment before readily available water in control treatments was not depleted. Water balance method was used to calculate the evapotranspiration (ET) between two consecutive irrigations (Unlukara et al 2008; Yurtseven et al 2005).
In order to eliminate the effects of sodium adsorption ratios (SAR), saline waters were prepared by using the calculated amounts of CaCl2, MgSO4 and NaCl considering the desired salinity levels for the treatments of salinity experiment. Prepared saline waters for each treatment were stored in 100 liter-plastic containers. ECi of these waters were controlled by an EC/pH meter (Jenway 430 model) before each irrigation application and the adjustment was done if necessary (Ünlükara et al 2008; Düzdemir et al 2009; Ünlükara et al 2010). Tap water (ECi= 0.65 dS m-1) was used to irrigate of
the control treatment in the salinity experiment and the treatments of the irrigation regime experiment.
Sandy loam textured soil with 17% clay, 16.2% silt and 66.8% sand and a unit weight of 1.57 g cm-3
was used in both experiments. The gravimetric soil water hold at saturation and field capacity were 26.1% and 15.8%, respectively. Forty-five kg of air-dried soil was used to fill each pot with 33 cm height, 32 cm bottom and 39 cm top diameters and 32.7 dm3 in volume. Amount of fertilizer to be applied
to each pot were calculated by considering 135 kg ha-1 for N, 37.5 kg ha-1 for P and 75 kg ha-1 for K as
suggested by Doorenbos & Kassam (1986). All of the P as diammonium phosphates (DAP) and K as potassium sulphate (K2SO4) and one half of the N
were applied to each treatment before transplanting whereas other half of the N applied after 20 days from initiation of the experiments. Some part of N requirement were derived from DAP and the rest from ammonium nitrate fertilizers.
170
Ta r ı m B i l i m l e r i D e r g i s i – J o u r n a l o f A g r i c u l t u r a l S c i e n c e s 21 (2015) 167-176 Green pepper seedlings were transplanted tothe lysimeters in 10 June 2006 and the plants were exposed to saline waters or different amounts of irrigation waters after one week from ones transplanted. As ripened, fruits were harvested throughout the experiments until September 20 (Totally 103 days from the transplanting to the last harvest).
At each harvest, the harvested fruits were weighted as fresh and oven-dried at 70 °C to a constant dry weight in order to determine fruit dry matter ratio. A reflectometer was used to determine the total soluble solids (TSS) as brix. At the end of the experiment, plant heights and stem diameters were measured, the plants were cut at 1 cm above the soil surface and vegetative fresh and dry weights (oven-dried at 70 °C to a constant weight) were obtained for each replication. Just after the plants were cut, soil samples were taken from entire depth of root zone of each pot to determine electrical conductivities of the saturated soil paste extracts (ECe) by an EC/pH meter (Jenway 430 model)
(Richards 1969). After soil sampling, the plant roots were gently removed from each pot by washing the soil inside the pot to determine plant root lengths, fresh and dry weights.
Salt tolerance model suggested by Maas & Hoffman (1977) was used in order to evaluate plant response to salinity. The yield response factors (Ky) for both water and salinity stresses were obtained (Stewart & Hagan 1973; Doorenbos & Kassam 1986).
To evaluate the effects of salinity on long pepper, three dimensional regression analyses were carried out. Three dimensional models of long green pepper that relates relative yield (Ya/Ym) against to soil
salinity (ECe) and relative evapotranspiration (ETa/
ETm) were obtained. The experimental data were analyzed using SPSS statistical analysis software (SPSS Inc. USA 2002). The General Linear Model procedure was used to perform analysis of variance. Duncan’s multiple range test was used to separate means of the data at 0.05 level of significance.
3. Results and Discussion
3.1. Effect of irrigation water salinity on soil salinity
Electrical conductivity of soil saturation paste extracts (ECe) for each treatment was presented
in Table 1 for the salinity and in Table 2 for the irrigation regime experiment. As expected, soil salinities increased with increasing electrical conductivities of irrigation water (ECi). Electrical
conductivity of soil saturation paste extracts (ECe) of S1, S2, S3, S4, S5 and S6 treatments increased by 1.0, 1.4, 1.7, 1.8, 2.1 and 1.9 times, respectively with respect to their irrigation water salinity levels. Leaching fraction (LF), among the treatments was not statically significant (Table 1) and LF values were around 0.30 for salinity experiment. In irrigation regime experiment, the highest ECe (2.04
dS m-1) was obtained for IR
2 treatment to which
complete crop requirement was applied, and the lowest ECe (0.64 dS m-1) was for IR
1 treatment to
which excess irrigation water was applied (Table 2). The ECe value of IR1 treatment was not significantly
different from that of the IR4 treatment. ECe of IR2,
IR3 and IR4 increased by 3.1, 1.5 and 1.4 times,
respectively with respect to tap water electrical conductivity (0.65 dS m-1).
3.2. Effects of salinity and amount of irrigation water on fruit yield
For both experiments, yield differences among the treatments were statically significant at 0.01 probability level (Tables 1 - 2).
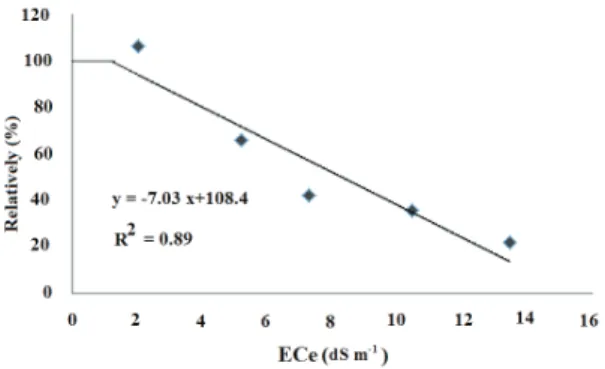
For the salinity experiment, the highest fruit yield (471.5 g) was obtained from S1 and the
lowest fruit yield from S6 (103.2 g) and S5 (168.0 g)
treatments. The relative fruit yield decrease against salinity was plotted in Figure 1 and a slope decrease of 7.03% was determined after the threshold value of 1.20 dS m-1. Hoffman & Letey (1990) reported
that pepper (Capsicum annuum) was a moderately sensitive vegetable with a 1.5 dS m-1 threshold value
and a 14.0% yield decrease slope while Rhoades et al (1992) also reported that pepper is a moderately sensitive vegetable but with a 1.7 dS m-1 threshold
171
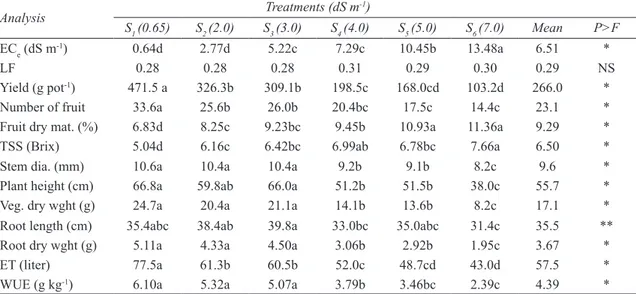
Ta r ı m B i l i m l e r i D e r g i s i – J o u r n a l o f A g r i c u l t u r a l S c i e n c e s 21 (2015) 167-176Table 1- Impact of irrigation water salinity on soil salinity and some plant variables of pepper (Capsicum annuum)
Çizelge 1- Sulama suyu tuzluluğunun toprak tuzluluğuna ve biberin bazı özelliklerine etkisi (Capsicum annuum)
Analysis Treatments (dS m-1)
S1 (0.65) S2 (2.0) S3 (3.0) S4 (4.0) S5 (5.0) S6 (7.0) Mean P>F
ECe (dS m-1) 0.64d 2.77d 5.22c 7.29c 10.45b 13.48a 6.51 *
LF 0.28 0.28 0.28 0.31 0.29 0.30 0.29 NS
Yield (g pot-1) 471.5 a 326.3b 309.1b 198.5c 168.0cd 103.2d 266.0 *
Number of fruit 33.6a 25.6b 26.0b 20.4bc 17.5c 14.4c 23.1 *
Fruit dry mat. (%) 6.83d 8.25c 9.23bc 9.45b 10.93a 11.36a 9.29 *
TSS (Brix) 5.04d 6.16c 6.42bc 6.99ab 6.78bc 7.66a 6.50 *
Stem dia. (mm) 10.6a 10.4a 10.4a 9.2b 9.1b 8.2c 9.6 *
Plant height (cm) 66.8a 59.8ab 66.0a 51.2b 51.5b 38.0c 55.7 *
Veg. dry wght (g) 24.7a 20.4a 21.1a 14.1b 13.6b 8.2c 17.1 *
Root length (cm) 35.4abc 38.4ab 39.8a 33.0bc 35.0abc 31.4c 35.5 **
Root dry wght (g) 5.11a 4.33a 4.50a 3.06b 2.92b 1.95c 3.67 *
ET (liter) 77.5a 61.3b 60.5b 52.0c 48.7cd 43.0d 57.5 *
WUE (g kg-1) 6.10a 5.32a 5.07a 3.79b 3.46bc 2.39c 4.39 *
#, each value is the mean of five replications; ŧ, within rows, means followed by the same letter are not significantly different according to Duncan’s multiple range test at 0.05 significance level; *, **, significant at the 0.01 and 0.05 probability levels respectively; NS, non-significant; TSS, total soluble solids (Brix); WUE, water use efficiency (fresh yield (g)/water consumption (kg)
Table 2- Impact of irrigation water amount on soil salinity and some plant variables of pepper (Capsicum annuum)
Çizelge 2- Sulama suyu miktarının toprak tuzluluğuna ve biberin bazı özelliklerine etkisi (Capsicum annuum)
Treatments
IR1 (1.43) IR2 (1.00) IR3 (0.75) IR4 (0.50) Mean P>F
ECe (dS m-1) 0.64c 2.04a 1.00b 0.88bc 1.14 *
Yield (g pot-1) 471.5ab 502.4a 407.3b 229.0c 402.6 *
Number of fruit 33.6b 37.0a 31.2b 19.4c 30.3 *
Fruit dry mat. (%) 6.83c 7.87b 8.44ab 8.98a 8.03 *
TSS (Brix) 5.04c 5.83b 6.28ab 6.55a 5.92 *
Stem dia. (mm) 10.6a 11.0a 10.5a 9.4b 10.4 *
Plant height (cm) 66.8 72.2 64.8 61.4 66.3 NS
Veg. dry wght (g) 24.7bc 31.3a 27.9ab 21.6c 26.4 *
Root length (cm) 35.4 42.2 36.4 39.6 38.4 NS
Root dry wght (g) 5.11b 6.69a 5.98ab 5.21b 5.75 *
ET (liter) 77.5a 66.0b 58.0c 45.3d 61.7 *
WUE (g kg-1) 6.10b 7.61a 7.01ab 5.07c 6.45 *
#, each value is the mean of five replications; ŧ, within rows, means followed by the same letter are not significantly different according to Duncan’s multiple range test at 0.05 significance level; *, **, significant at the 0.01 and 0.05 probability levels respectively; NS, non-significant; TSS, total soluble solids (Brix); WUE, water use efficiency (fresh yield (g)/water consumption (kg)
172
Ta r ı m B i l i m l e r i D e r g i s i – J o u r n a l o f A g r i c u l t u r a l S c i e n c e s 21 (2015) 167-176 and a 12.0% yield decrease slope. Kurunç et al(2011) found that the threshold salinity was 1.2 dS m-1 and slope was 10.9% for bell peppers grown in
pots under greenhouse conditions. Chartzoulakis & Klapaki (2000) found 1.8 dS m-1 threshold salinities
for Sonar and Lamuyo hybrids of Capsicum annuum but they found yield decrease slopes 8.4% for Sonar and 11.7% for Lamuyo.
Figure 1- The relationship between soil salinity and green long pepper fruit yield
Şekil 1- Toprak tuzluluğu ve sivri biberin meyve verimi arasındaki ilişki
For irrigation regime experiment, the highest fruit yields were obtained from IR2 (502.4 g) and IR1
(471.5 g) treatments whereas the lowest yield (229 g) for IR4 treatment. Compared to IR2 treatment, yield decreases for IR3 and IR4 treatments were
18.9% and 54.4%, respectively. Water stress caused yield lost because as soil become drier, soil water strongly held by soil matrix and the concentration of soil water increase. Dorji et al (2005) only applied half water of control treatment to treatments of partial root zone drying (PRD) and deficit irrigation (DI) and found 19% and 34.7% total fresh fruit yield lost in PRD and DI, respectively for hot pepper.
Effects of salinity and water deficit on fruit number and mean fruit weight were found significantly different. Number of fruit per plant and mean fruit weight were reduced by salinity (Table 1). Limited water applications caused decreases in harvested fruit number and mean fruit weight. Chartzoulakis & Klapaki (2000) under saline conditions and Dorji et al (2005) under different
water deficit strategies also found similar effects of these stresses.
Both salinity and water stress improve fruit dry matter ratio and total soluble solids (TSS) (Tables 1 - 2). Dry matter contents of treatments changed between 6.83% for S1 and 11.36% for S6. TSS
5.04 for S1 improved to 7.66 for S6. Relative yield
reduction slope for dry fruit was 4.8% and it was lower than those of fresh fruit yield. Under water stressed conditions fruit dry matter increased from 6.83% for IR1 to 8.98% for IR4 and TSS from 5.04 brix for IR1 to 6.55 brix for IR4. Increment in dry
matter ratio moderated dry fruit yield lost under both saline and water stress conditions, which agree with Dorji et al (2005) and Ezzo et al (2010).
Vegetative dry weight, plant height, stem diameter and root dry weight were significantly affected by salinity (Table 1). Non-significant differences among these characteristics were not observed until 5.22 dS m-1 of soil salinity (S
3). After
this point, increasing soil salinity reduced vegetative, root dry weights, plant height and stem diameter, significantly. Aktas et al (2006), Chartzoulakis & Klapaki (2000), Genhua et al (2010) and Azuma et al (2010) stated depressed pepper vegetative growth because of salinity. In the water regimes experiment, water stress did not affect plant height and root length statistically but decreased vegetative and root dry weights and stem diameter (Table 2).
3.4. Water consumption
Differences in water consumptions due to salinity and water stress were statistically significant at 0.01 probability level (Tables 1-2). The highest water consumption (77.5 liter pot-1) was observed
for S1 treatment and the lowest for S6 (43.0 liter
pot-1) and S
5 (48.7 liter pot-1). The decreases in the
water consumptions with respect to the control were 20.9%, 21.8%, 32.9%, 37.2% and 44.4% for S2, S3, S4, S5 and S6 treatments respectively. In the
irrigation regime experiment, evapotranspiration was reduced by application of limited water, thus the lower evapotranspiration amount were obtained for IR3 and IR4 treatments. The highest ET was
Farklı Tuzluluk ve Sulama Rejimi Şartlarında Sivri Biber Gelişimi ve Bitki Tuzluluk Toleransında Su Tüketiminin Kullanılabilirliği, Ünlükara et al
173
Ta r ı m B i l i m l e r i D e r g i s i – J o u r n a l o f A g r i c u l t u r a l S c i e n c e s 21 (2015) 167-176and IR4 with respect to IR1 were 14.8%, 25.2% and
41.5%, respectively.
Decreasing effect of salinity on plant evapotranspiration should be considered to prevent excess water application. The following equation, offered by Allen et al (1998), was used to adjust evapotranspiration under saline conditions:
6
water applications caused decreases in harvested fruit number and mean fruit weight. Chartzoulakis Klapaki (2000) under saline conditions and Dorji et al (2005) under different water deficit strategies also found similar effects of these stresses.
Both salinity and water stress improve fruit dry matter ratio and total soluble solids (TSS) (Tables 1 - 2). Dry matter contents of treatments changed between 6.83% for S1 and 11.36% for S6. TSS 5.04 for S1 improved to 7.66 for S6. Relative yield reduction slope for dry fruit was 4.8% and it was lower than those of fresh fruit yield. Under water stressed conditions fruit dry matter increased from 6.83% for IR1 to 8.98% for IR4 and TSS from 5.04 brix for IR1 to 6.55 brix for IR4. Increment in dry matter ratio moderated dry fruit yield lost under both saline and water stress conditions, which agree with Dorji et al (2005) and Ezzo et al (2010).
Vegetative dry weight, plant height, stem diameter and root dry weight were significantly affected by salinity (Table 1). Non-significant differences among these characteristics were not observed until 5.22 dS m-1 of soil salinity (S
3). After this point, increasing soil salinity reduced vegetative, root dry weights, plant height and stem diameter, significantly. Aktas et al (2006), Chartzoulakis Klapaki (2000), Genhua et al (2010) and Azuma et al (2010) stated depressed pepper vegetative growth because of salinity. In the water regimes experiment, water stress did not affect plant height and root length statistically but decreased vegetative and root dry weights and stem diameter (Table 2).
3.4. Water consumption
Differences in water consumptions due to salinity and water stress were statistically significant at 0.01 probability level (Tables 1-2). The highest water consumption (77.5 liter pot-1) was observed for S
1 treatment and the lowest for S6 (43.0 liter pot-1) and S5 (48.7 liter pot-1). The decreases in the water consumptions with respect to the control were 20.9%, 21.8%, 32.9%, 37.2% and 44.4% for S2, S3, S4, S5 and S6 treatments respectively. In the irrigation regime experiment, evapotranspiration was reduced by application of limited water, thus the lower evapotranspiration amount were obtained for IR3 and IR4 treatments. The highest ET was determined for IR1. The ET decrease for IR2, IR3 and IR4 with respect to IR1 were 14.8%, 25.2% and 41.5%, respectively.
Decreasing effect of salinity on plant evapotranspiration should be considered to prevent excess water application. The following equation, offered by Allen et al (1998), was used to adjust evapotranspiration under saline conditions:
m s
adj
K
ET
ET
(3) Where; ETa or ETadj is the actual or adjusted evapotranspiration under saline conditions; ETm is the maximum evapotranspiration of the control treatment (Liters); Ks is the stress coefficient.To determine stress coefficient (Ks), ETa/ETm ratios for saline treatments were plotted against soil salinity values (Figure 2). The relationship between ETa/ETm and ECe was curvilinear (R2= 0.93):
17 . 0
)
(
83
.
0
K
ECe
ET
ET
s m a (4)Plant salt tolerance model developed by Hoffman Maas (1977) have been used to quantify salinity effect on plant yield. In the model, relative yield percent is dependent variable whereas electrical conductivity of soil saturation extract (ECe) is independent variable. Plant tolerances may change with changing of climate, soil and management conditions and plant varieties. For example, a plant is able to tolerate some degree of salinity under cold climate but it is not able to tolerate the same salinity and lost considerable yield under hot climate. Plants consumed more water under hot climate then cold climate. Sunshine, temperature, wind velocity and relative humidity affect plant evapotranspiration. Because of these reasons, using water consumption in the salinity model may reflect the effect of climatic conditions.
(3) Where; ETa or ETadj is the actual or adjusted evapotranspiration under saline conditions; ETm
is the maximum evapotranspiration of the control treatment (Liters); Ks is the stress coefficient.
To determine stress coefficient (Ks), ETa/ETm
ratios for saline treatments were plotted against soil salinity values (Figure 2). The relationship between ETa/ETm and ECe was curvilinear (R2= 0.93):
6
Effects of salinity and water deficit on fruit number and mean fruit weight were found significantly different. Number of fruit per plant and mean fruit weight were reduced by salinity (Table 1). Limited water applications caused decreases in harvested fruit number and mean fruit weight. Chartzoulakis Klapaki (2000) under saline conditions and Dorji et al (2005) under different water deficit strategies also found similar effects of these stresses.
Both salinity and water stress improve fruit dry matter ratio and total soluble solids (TSS) (Tables 1 - 2). Dry matter contents of treatments changed between 6.83% for S1 and 11.36% for S6. TSS 5.04 for S1 improved to 7.66 for S6. Relative yield reduction slope for dry fruit was 4.8% and it was lower than those of fresh fruit yield. Under water stressed conditions fruit dry matter increased from 6.83% for IR1 to 8.98% for IR4 and TSS from 5.04 brix for IR1 to 6.55 brix for IR4. Increment in dry matter ratio moderated dry fruit yield lost under both saline and water stress conditions, which agree with Dorji et al (2005) and Ezzo et al (2010).
Vegetative dry weight, plant height, stem diameter and root dry weight were significantly affected by salinity (Table 1). Non-significant differences among these characteristics were not observed until 5.22 dS m-1 of soil salinity (S
3). After this point, increasing soil salinity reduced vegetative, root dry weights, plant height and stem diameter, significantly. Aktas et al (2006), Chartzoulakis Klapaki (2000), Genhua et al (2010) and Azuma et al (2010) stated depressed pepper vegetative growth because of salinity. In the water regimes experiment, water stress did not affect plant height and root length statistically but decreased vegetative and root dry weights and stem diameter (Table 2).
3.4. Water consumption
Differences in water consumptions due to salinity and water stress were statistically significant at 0.01 probability level (Tables 1-2). The highest water consumption (77.5 liter pot-1) was observed for S
1 treatment and the lowest for S6 (43.0 liter pot-1) and S5 (48.7 liter pot-1). The decreases in the water consumptions with respect to the control were 20.9%, 21.8%, 32.9%, 37.2% and 44.4% for S2, S3, S4, S5 and S6 treatments respectively. In the irrigation regime experiment, evapotranspiration was reduced by application of limited water, thus the lower evapotranspiration amount were obtained for IR3 and IR4 treatments. The highest ET was determined for IR1. The ET decrease for IR2, IR3 and IR4 with respect to IR1 were 14.8%, 25.2% and 41.5%, respectively.
Decreasing effect of salinity on plant evapotranspiration should be considered to prevent excess water application. The following equation, offered by Allen et al (1998), was used to adjust evapotranspiration under saline conditions:
m s
adj
K
ET
ET
(3) Where; ETa or ETadj is the actual or adjusted evapotranspiration under saline conditions; ETm is the maximum evapotranspiration of the control treatment (Liters); Ks is the stress coefficient.To determine stress coefficient (Ks), ETa/ETm ratios for saline treatments were plotted against soil salinity values (Figure 2). The relationship between ETa/ETm and ECe was curvilinear (R2= 0.93):
17 . 0
)
(
83
.
0
K
ECe
ET
ET
s m a (4)Plant salt tolerance model developed by Hoffman Maas (1977) have been used to quantify salinity effect on plant yield. In the model, relative yield percent is dependent variable whereas electrical conductivity of soil saturation extract (ECe) is independent variable. Plant tolerances may change with changing of climate, soil and management conditions and plant varieties. For example, a plant is able to tolerate some degree of salinity under cold climate but it is not able to tolerate the same salinity and lost considerable yield under hot climate. Plants consumed more water under hot climate then cold climate. Sunshine, temperature, wind velocity and relative humidity affect plant evapotranspiration. Because of these reasons, using water consumption in the salinity model may reflect the effect of climatic conditions.
(4) Plant salt tolerance model developed by Hoffman & Maas (1977) have been used to quantify salinity effect on plant yield. In the model, relative yield percent is dependent variable whereas electrical conductivity of soil saturation extract (ECe) is independent variable. Plant tolerances may change with changing of climate, soil and management conditions and plant varieties. For example, a plant is able to tolerate some degree of salinity under cold climate but it is not able to tolerate the same salinity and lost considerable yield under hot climate. Plants consumed more water under hot climate then cold climate. Sunshine, temperature, wind velocity and relative humidity affect plant evapotranspiration. Because of these reasons, using water consumption in the salinity model may reflect the effect of climatic conditions. For this respect, relative evapotranspiration and soil salinity as independent variables and relative yield ratio as dependent variable were used to develop a three-dimensional model (Figure 3). Very stronger relation was found among these three variables (R2= 0.94):
Figure 2- Effect of soil salinity on green long pepper evapotranspiration (SE= 0.032; R2= 0.73; P<0.01)
Şekil 2- Toprak tuzluluğunun sivri biberin bitki su tüketimine etkisi (SE= 0.032; R2= 0.73; P<0.01)
Similar three-dimensional relationship among soil salinity, evapotranspiration and yield/plant growth data were offered by Cemek et al (2011) for lettuce. Different from Cemek et al (2011) model, we afforded to find relationship among relative yield, soil salinity and relative evapotranspiration. We think that by using relative evapotranspiration and relative yield in the model, the effect of different climatic conditions on salt tolerance for a given plant would be considered.
Figure 3- Three-dimensional relations among relative green long pepper yield, relative evapotranspiration and soil salinity
Şekil 3- Sivri biberin nisbi verimi, nisbi bitki su tüketimi ve toprak tuzluluğunun üç boyutlu ilişkisi
174
Ta r ı m B i l i m l e r i D e r g i s i – J o u r n a l o f A g r i c u l t u r a l S c i e n c e s 21 (2015) 167-176 In spite of depressed yield and water consumptionunder saline and water deficit conditions, there were significant differences in water use efficiency (WUE) among the treatments of the both experiments (Table 1-2). In the salinity experiment WUE decreased after ECe= 5.22 dS m-1. Excess and limited water
applications in the irrigation regime experiment also reduced WUE significantly.
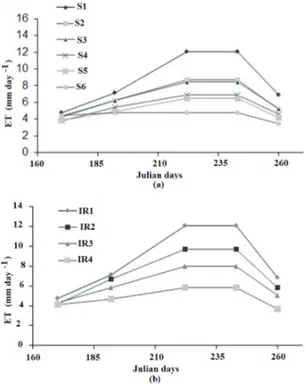
As seen in Figure 4a, daily evapotranspiration decreased as soil salinity increased. Daily ET can be divided into three distinct stages for all treatments in both experiments except for S6. In S6 treatment,
daily ET was nearly constant from the beginning of the experiment to the 240th day of the year and then
it decreased. Water consumption route of the pepper was changed by higher salinity.
Figure 4- Effect of salinity (a) and water stress (b) on daily evapotranspiration of green long pepper
Şekil 4- Tuzluluk (a) ve su stresinin (b) sivri biberin günlük bitki su tüketimi üzerine etkisi
The relation between relative evapotranspiration and relative yield decreases for water stress with yield response factor (Ky) has been used to evaluate
plant tolerance to water stress (Doorenbos &
Kassam 1986). Some scientists have also used this method for salinity assessments (Steawart et al 1977; Shalhevet 1994; Katerji et al 1998; Ünlukara et al 2008; Kurunç et al 2011). In our study, the relation between yield and evapotranspiration of pepper caused both by salinity and by limited water application were shown in Figure 5. As seen in Figure 5, the slopes of straight line (Ky) were 1.56
for salinity and 1.66 for water stress. Although different forces act on plant water uptake under saline and water stress conditions, nearly the same Ky coefficient obtained for both stresses. According
to Ky value, pepper was very sensitive to water
deficit caused by salinity or water stress. Dimitrov & Ovtcharrova (1995) reported that the pepper plant has a shallow root system and extracts 70-80% of its water from the top 0.3 m soil layer. Shallow root system and high stomatal density of pepper explains why pepper is regarded as relatively vulnerable to water stress (Ben-Gal et al 2008).
Figure 5-The relation between relative yield decrease and relative evapotranspiration decrease due to salinity (a) and irrigation regime (b) for green long pepper
Şekil 5- Tuzluluk (a) ve sulama rejimi (b) nedeni ile sivri biberde nispi verim kaybı ve nispi bitki su tüketimi kaybı arasındaki ilişki
175
Ta r ı m B i l i m l e r i D e r g i s i – J o u r n a l o f A g r i c u l t u r a l S c i e n c e s 21 (2015) 167-1764. Conclusions
Long green pepper (Capsicum annuum var. Demre) is a sensitive plant to salinity and water stress caused by water deficit or soil salinity. Salinity and water deficit caused more yield decrease than plant growth. Harmful effect of water stress and salinity on yield improved total soluble solids in fruit. Relative fruit yield decreased linearly for unit increase of soil salinity but relative evapotranspiration decreased exponentially. Depressing effect of salinity on plant water consumption must be considered to avoid excess water application to plant and to keep environment. Yield response factor for water deficit is nearly similar to yield response factor for salinity. Considering plant water consumption as a second parameter in the salinity models may reflect effects of climatic conditions on plant salt tolerance. Especially relative evapotranspiration should be considered in the salinity models.
References
Aktas H, Abak K & Cakmak I (2006). Genotypic variation in response of pepper to salinity. Scientia
Horticulturae 110: 260-266
Allen R G, L S Pereira, D Raes & M Smith (1998). Crop evapotranspiration. Guidelines for computing crop water requirements. FAO Irrigation and Drainage Paper 56, Rome
Azuma R, Ito N, Nakayama N, Suwa R, Nguyen N T, J Larrigana-Mayoral A, Esaka M, Fujiyama H & Saneoka H (2010). Fruits are more sensitive to salinity than leaves and stems in pepper plants (Capsicum annuum L.). Scientia Horticulturae 125: 171-178 Ben-Gal A, Ityel E, Dudley L, Cohen S, Yermiyahu U,
Presnov E, Zigmond L & Shani U (2008). Effect of irrigation water salinity on transpiration and on leaching requirements: A case study for bell peppers.
Agricultural Water Management 95: 587-597
Cemek B, Ünlükara A, Karaman S & Gökalp Z (2011). Effects of evapotranspiration and soil salinity on some growth parameters and yield of lettuce (Lactuca sativa var. crispa). Zemdirbyste-Agriculture 98(2): 139-148 Chartzoulakis K & Klapaki G (2000). Response of two
greenhouse pepper hybrids to NaCl salinity during different growth stages. Scientia Horticulturae 86: 247-260
Dimitrov Z & Ovtcharrova A (1995). The productivity of peppers and tomatoes in case of insufficient water supply. In: Proceedings of ICID Special Technical
Session on the Role of Advanced Technologies in Irrigation and Drainage Systems 1: Ft9.1-ft9.5
Doorenbos J & Kassam A H (1986). Yield response to water. FAO Irrigation and Drainage Paper 33, Rome Dorji K, Behboudian M H & Zegbe-Dominguez J A
(2005). Water relations, growth, yield, and fruit quality of hot pepper under deficit irrigation and partial root zone drying. Scientia Horticulturae 104: 137-149
Düzdemir O, Ünlükara A & Kurunç A (2009). Response of cowpea (Vigna unguiculata) to salinity and irrigation regimes. RSZN New Zealand Journal of Crop and
Horticultural Science 37: 271-280
Ezzo M I, Glala A A, Habib H A M & Helaly A A (2010). Response of Sweet Pepper Grown in Sandy and Clay Soil Lysimeters to Water Regimes.
American-Eurasian Journal of Agricultural & Environment Science 8 (1): 18-26
FAO (2014a). FAOSTAD. Retrieved in January, 13, 2014 from http://faostat.fao.org/site/567/default. aspx#ancor
FAO (2014b). FAOSTAD. Retrieved in January, 13, 2014 from http://faostat.fao.org/site/339/default.aspx Francois L E & Maas E V (1999). Crop Response and
Management of Salt-Affected Soils. In: Pessarakli M. (ed): Handbook of Plant and Crop Stress, CRC Taylor & Francis Group, New York, pp. 169-201
Genhua N, Rodriguez D S, Call E, Bosland P W, Ulery A & Acosta E (2010). Responses of eight chile peppers to saline water irrigation. Scientia Horticulturae 126: 215-222
Hoffman G J & Letey J (1990). Salinity Management. In: Management of Farm Irrigation Systems. ASAE Monograph Number 9, 2950 Niles Road St. Joseph, MI 49085-9659, USA
Katerji N, Van Hoorn J W, Hamdy A, Mastrorilli M & Karam F (1998). Salinity and drought, a comparison of their effects on the relationship between yield and evapotranspiration. Agricultural Water Management 36: 45-54
Kurunc A, Unlukara A & Cemek B (2011). Salinity and drought affect yield response of bell pepper similarly.
Acta Agriculturae Scandinavica, Section B – Plant Soil Science 61: 514-522
176
Ta r ı m B i l i m l e r i D e r g i s i – J o u r n a l o f A g r i c u l t u r a l S c i e n c e s 21 (2015) 167-176 Letey J & Dinar A (1986). Simulated crop-waterproduction functions for several crops when irrigated with saline waters. Hilgardia 54: 1-32
Maas E V & Hoffman G J (1977). Crop salt tolerance-Current assessment. ASCE Journal of Irrigation and
Drainage Division 103: 115-134
Ozturk A, Unlukara A, Ipek A & Gurbuz B (2004). Effects of Salt Stress and Water Deficit on Plant Growth and Essential Oil Content of Lemon Balm (Melissa officinalis L.). Pakistan Journal of Botany 36(4): 787-792
Pessarakli M & Szabolcs I (1999). Soil Salinity and Sodicity as Particular Plant/Crop Stress Factors. In: Pessarakli, M (ed): Handbook of Plant and Crop Stress, CRC Taylor & Francis Group, New York, pp. 1-17
Rhoades J D, Kandiah A & Mashali A M (1992). The use of saline waters for crop production. FAO Irrigation and Drainage Paper 48, Rome
Richards L A (1969). Diagnosis and Improvement of Saline and Alkali Soils. United States Salinity Laboratory Staff, Agriculture Handbook No.60, United State Department of Agriculture, pp. 160
Shalhevet J (1994). Using water of marginal quality for crop production: major issues. Agricultural Water
Management 25: 233-269
Steawart J I & Hagan R M (1973). Functions to predict effects of crop water deficits. ASCE Journal of
Irrigation Drainage Division 99: 421-439
Steaward J L, Danielson R E, Hanks R J, Jackson E B, Hagon R M, Pruit W O, Franklin W T & Riley J P (1977). Optimizing crop production through control of water and salinity levels in the soil. Utah Water Research Lab. PR. 151-1, Logan, Utah
Yurtseven E, Kesmez G D & Ünlükara A (2005). The effects of water salinity and potassium levels on yield, fruit guality and water consumption of a native central anatolian tomato species (Lycopersicon esculentum).
Agricultural Water Management 78: 128-135
Ünlükara A, Kurunç A, Kesmez G D & Yurtseven E (2008). Growth and evapotranspiration of okra (Abelmoschus esculentus L.) as influenced by salinity of irrigation water. Journal of Irrigation and Drainage
Engineering 134(2): 160-166
Ünlükara A, Kurunç A, Kesmez G D, Yurtseven E & Suarez D L (2010). Effects of Salinity on Eggplant (Solanum
Melongena L.) Growth and Evapotranspiration. Irrigation and Drainage 59: 203-214