© 2019 by the Serbian Biological Society 55
Dynamic thiol/disulfide homeostasis in serum of patients with generalized vitiligo
Gökhan Pektaş1, Suzan Demir Pektaş2, Aynure Öztekin3, Coşkun Öztekin4, Salim Neşelioğlu5, Özcan Erel5 and
Gökhan Sadi6,*
1 Department of Hematology, Mugla Sitki Kocman University Training and Research Hospital, 48000, Mugla, Turkey 2 Department of Dermatology, Mugla Sitki Kocman University, Faculty of Medicine, 48000, Mugla, Turkey
3 Department of Dermatology, Hitit University, Faculty of Medicine, 19000, Corum, Turkey 4 Department of Family Medicine, Hitit University, Faculty of Medicine, 19000, Corum, Turkey 5 Department of Biochemistry, Yildirim Beyazit University, Faculty of Medicine, 06800, Ankara, Turkey 6 Department of Biology, Karamanoğlu Mehmetbey University, K.Ö. Science Faculty, 70100, Karaman, Turkey
*Corresponding author: [email protected]
Received: March 10, 2018; Revised: August 10, 2018; Accepted: October 9, 2018; Published online: October 10, 2018 Abstract: Vitiligo is a multifactorial disorder commonly associated with hypo-/depigmentation in the skin and may
influ-ence both children and adults psychologically because of the notable leopard-skin-like appearance. This study was designed to investigate the thiol/disulfide homeostasis in patients with generalized vitiligo and to determine its relationship with some of the demographical characteristics. Seventy-six generalized vitiligo patients and 67 healthy individuals were included in the study. Blood serum native thiol, disulfide and total thiol concentrations, together with some hematological parameters, were determined. Results demonstrated that native and total thiol contents, and their ratios, were significantly lower in vitiligo patients. Disulfide/native thiol and disulfide/total thiol ratios were significantly higher in the patient group. Progressivity of the disease strongly regulated the thiol/disulfide homeostasis in such a way that active vitiligo patients had reduced native and total thiol levels but increased disulfide/native thiol and disulfide/total thiol ratios. Moreover, there was a statistically significant negative correlation between both duration of the vitiligo and native and total thiol contents. As these results clearly demonstrated that thiol/disulfide homeostasis was shifted toward disulfide formation in patients with generalized vitiligo, determining the dynamic nature of thiol/disulfide homeostasis can be used to monitor disease progression.
Keywords: generalized vitiligo; native thiol; disulfide; total thiol; homeostasis
How to cite this article: Pektaş G, Pektaş SD, Öztekin A, Öztekin C, Neşelioğlu
S, Erel Ö, Sadi G. Dynamic thiol/disulfide homeostasis in serum of patients with generalized vitiligo. Arch Biol Sci. 2019;71(1):55-62.
INTRODUCTION
Vitiligo is a complex pathogenesis associated with char-acteristic skin depigmentation caused by melanocyte destruction. The main reason for the development of the disease is the adaptive autoimmune destruction of melanocytes, but this is not sufficient to describe the en-tire pathogenesis [1]. Several intrinsic factors within the melanocytes, such as adhesion defects, inflammasomes and development of oxidative stress in specific areas of skin are proposed to cause the destruction of melano-cytes. Oxidative stress leading to the pathogenic event in melanocytes has been demonstrated in the epidermis of active vitiligo abrasions. Additionally, variations in the antioxidant defense systems have been noted in the epidermis, sera and melanocytes from vitiligo patient [2].
The term thiol generally refers to compounds con-taining sulfur. In biological systems, thiol (-SH)- and dithiol (disulfide or -S-S-)-containing compounds are vital for life [3]. The majority of cellular thiol groups are found in proteins, while compounds such as glu-tathione, free cysteine and homocysteine also contain thiol groups independent of proteins [3]. The reduced free thiol groups and their oxidized disulfide forms can be converted into each other according to the cellular redox state. They therefore play an important role in keeping the intracellular reduction-oxidation potential in balance [4]. Maintenance of cellular antioxidant systems and regulation of signaling mechanisms have been found to be regulated by dynamic thiol/disulfide homeostasis [5]. In their reduced form, thiol groups
have a generally positive role in redox regulation. How-ever, it should also be noted that sometimes they might act as a prooxidant, as in the case of homocysteine, which inhibits the breakdown of hydrogen peroxide by catalase [6].
Thiol compounds have been found to play a role in melanogenesis [7,8], and vitiligo with impaired melanogenesis can be linked with thiol compounds. Such an interaction suggests that there might be a link between plasma thiol levels and vitiligo devel-opment. In that respect, this study was designed to evaluate how thiol/disulfide homeostasis and some blood parameters are regulated in vitiligo patients. This study also aims to investigate whether blood count and thiol-disulfide homeostasis correlate with the demographic characteristics of the vitiligo patients, such as duration of disease, family history and activity (stable or progressive) of disease.
MATERIALS AND METHODS
This cross-sectional study was performed in accordance with the guidelines of the Helsinki Declaration, and was approved by the local ethical committee of Hitit University, Çorum, Tukey (Approval no: 2017/13). Informed consent was obtained from all subjects.
Subjects
The study reviewed 76 patients with generalized vitiligo who were admitted to the department of dermatology, and 67 healthy volunteers. A detailed history regarding the disease was taken and the activity of the disease was assessed as either “stable” or “progressive”, based on the activity of the disease over the past 6 months. Patients with generalized vitiligo who received topical treatment for the last four weeks, systemic treatment in the last three months, who had concurrent systemic disorders, who smoked and consumed alcohol, who were pregnant or breastfeeding were excluded. Patients with any hema-tological or biochemical abnormalities observed during routine laboratory investigations were also excluded.
Collection of blood samples
In the early morning, after the 12-hour-long fasting period, venous blood samples were taken in collection
tubes containing sodium citrate and ethylenediami-netetraacetic acid (EDTA) to prevent the blood to be icteric or hemolyzed. The blood was centrifuged at 700 x g, the supernatants were removed and kept at -80°C until analysis.
Analysis of plasma thiol and disulfide homeostasis
Serum thiol-disulfide components were measured by a Roche Hitachi Cobas c501 automatic analyzer by the automatic measurement method [9]. Accordingly, free functional thiol groups were produced from reducible disulfide bonds with sodium borohydride. The remain-ing sodium borohydride was treated with formaldehyde to prevent unintended reduction of 5,5-dithiobis-(2 nitrobenzoic) (DTNB). Reduced and native thiols were determined with DTNB and the amount of dynamic disulfide was calculated from the half of the difference between total thiol and native thiol. Disulfide/total thiol ratios, native thiol/total thiol ratios, and disulfide/ native thiol ratios were calculated.
Laboratory Studies
Hemoglobin content, leukocyte, lymphocyte, neutro-phil and platelet counts, and mean platelet volumes (MPV) were measured by an automated blood cell counter (Advia 2120 Hematology Analyzer, Siemens Healthcare Diagnostics Deerfield, IL, USA).
Statistical analysis
The Shapiro Wilks (n<30) and Kolmogorov Smirnov tests (n>30) were used to test the normality of variables. Levene’s test was used to check the homogeneity of variances. Independent sample T and Mann Whitney U tests were used for group comparisons when com-patible. The effects of covariates were checked with the multivariate analysis of covariance (MANCOVA) test. Differences between categorical variables were compared using Pearson’s chi-square on 2x2 tables, and Fisher’s exact test on RxC tables. The Pearson correlation coefficient was utilized when the relations between numerical variables were examined. Collected data were analyzed by the Statistical Package for Social Sciences version 21.0 (SPSS IBM, Armonk, NY, USA). P values<0.05 were considered statistically significant.
RESULTS
Changes in serum thiol/disulfide homeostasis with vitiligo
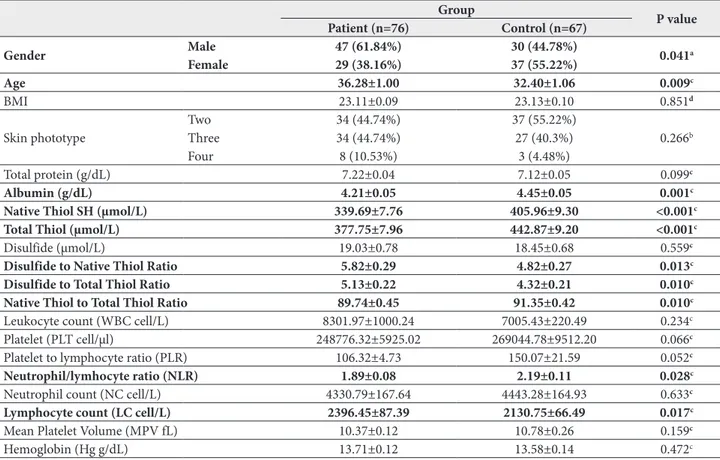
Table 1 shows the demographic characteristics and biochemical parameters of individuals along with the groups. The mean age of the individuals in the patient group was significantly higher than in the control group (P=0.009). While age distribution of the individuals was different, according to the MANCOVA test in which age was taken as covariate, it has no significant effect on all other analyzed dependent variables (except the total protein content). The mean albumin levels of the individuals in the patient group (4.21±0.43 g/dL) were lower than that of the control group (4.45±0.44 g/dL) (P<0.001). When thiol/disulfide homeostasis was ex-amined, native thiol (339.69±67.65 µmol/L) and total thiol contents (377.75±69.41 µmol/L) of the vitiligo pa-tients were significantly lower than in the control group
(405.96±76.10 and 442.87±75.36 µmol/L; respectively) (P<0.001). Likewise, the native/total thiol ratio was also lower in the patient group. The oxidized form of the thiol groups was evaluated with the disulfide contents, and the disulfide/native thiol and disulfide/total thiol ratios were elevated in the vitiligo group (P<0.05). Age and gender did not have any significant effects on these parameters. Several blood parameters were also com-pared, and lymphocyte counts (LC) of vitiligo patients were augmented while the neutrophil/lymphocyte ratio (NLR) was reduced significantly (P<0.05).
Effects of demographic characters of patient groups on thiol/disulfide homeostasis
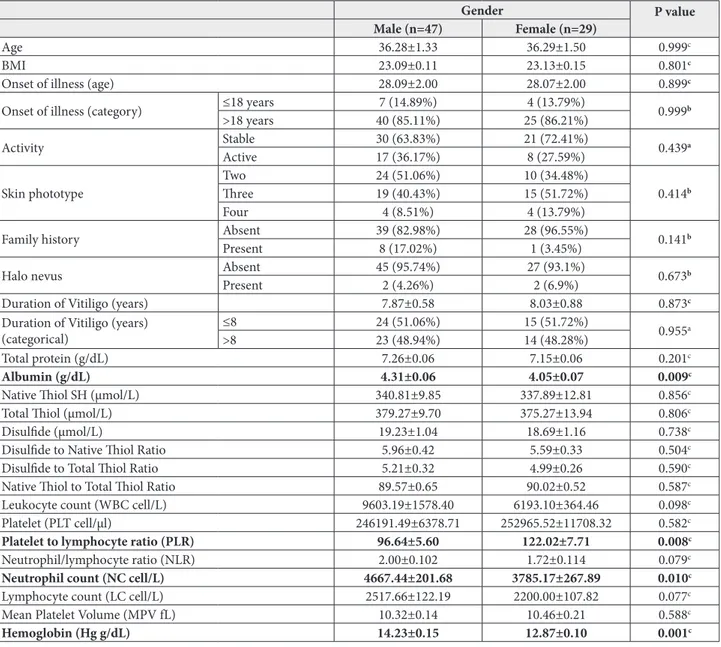
Some demographic characteristics and biochemical markers were compared with respect to genders of vitiligo patients and the results are summarized in Table 2. The albumin concentration in male patients (4.31±0.44 g/dL) was higher than in females (4.05±0.38
Table 1. Comparison of demographic characteristics and biochemical parameters of vitiligo patients and healthy subjects.
Patient (n=76) Group Control (n=67) P value
Gender Male 47 (61.84%) 30 (44.78%) 0.041a
Female 29 (38.16%) 37 (55.22%)
Age 36.28±1.00 32.40±1.06 0.009c
BMI 23.11±0.09 23.13±0.10 0.851d
Skin phototype TwoThree 34 (44.74%)34 (44.74%) 37 (55.22%)27 (40.3%) 0.266b
Four 8 (10.53%) 3 (4.48%)
Total protein (g/dL) 7.22±0.04 7.12±0.05 0.099c
Albumin (g/dL) 4.21±0.05 4.45±0.05 0.001c
Native Thiol SH (µmol/L) 339.69±7.76 405.96±9.30 <0.001c
Total Thiol (µmol/L) 377.75±7.96 442.87±9.20 <0.001c
Disulfide (µmol/L) 19.03±0.78 18.45±0.68 0.559c
Disulfide to Native Thiol Ratio 5.82±0.29 4.82±0.27 0.013c
Disulfide to Total Thiol Ratio 5.13±0.22 4.32±0.21 0.010c
Native Thiol to Total Thiol Ratio 89.74±0.45 91.35±0.42 0.010c
Leukocyte count (WBC cell/L) 8301.97±1000.24 7005.43±220.49 0.234c
Platelet (PLT cell/µl) 248776.32±5925.02 269044.78±9512.20 0.066c
Platelet to lymphocyte ratio (PLR) 106.32±4.73 150.07±21.59 0.052c
Neutrophil/lymhocyte ratio (NLR) 1.89±0.08 2.19±0.11 0.028c
Neutrophil count (NC cell/L) 4330.79±167.64 4443.28±164.93 0.633c
Lymphocyte count (LC cell/L) 2396.45±87.39 2130.75±66.49 0.017c
Mean Platelet Volume (MPV fL) 10.37±0.12 10.78±0.26 0.159c
Hemoglobin (Hg g/dL) 13.71±0.12 13.58±0.14 0.472c
a – Pearson’s Chi-Square Test used; b – Fisher’s Exact Test used; c – Independent Sample T-test used. Descriptive statistics are given as mean±standard error of mean.
g/dL) (P<0.009). The neutrophil count (NC) and the hemoglobin contents of male patients were signifi-cantly (P<0.05) higher than in female patients, but the platelet (PLT) levels were lower. The results also demonstrated that gender did not have any significant effects on other parameters (age of onset of illness, BMI, disease progression, skin phototype, presence of halo nevus, duration of vitiligo, lymphocyte levels, mean platelet volume, total protein, native thiol, total thiol, disulfide, disulfide to native thiol ratio, disulfide to total thiol ratio and native thiol to total thiol ratio) that were examined (P>0.05 for each).
Patients with a family history of vitiligo had high-er blood albumin levels than those without a fam-ily history of vitiligo (P<0.05). Similarly, LC values (2967.78±375.65 cell/L) in patients with a family history of vitiligo were significantly higher (2319.70±82.42 cell/L) than in patients without a family history of vit-iligo. Other demographic characteristics and biochemi-cal parameters were not dependent on the presence of a family history of vitiligo. In another comparison, the duration of vitiligo medication to patients aged 18 years and younger was higher than in those older than 18 years (p<0.001).
Table 2. Comparison of some demographic characteristics and biochemical markers based on the gender of vitiligo patients.
Gender P value
Male (n=47) Female (n=29)
Age 36.28±1.33 36.29±1.50 0.999c
BMI 23.09±0.11 23.13±0.15 0.801c
Onset of illness (age) 28.09±2.00 28.07±2.00 0.899c
Onset of illness (category) ≤18 years 7 (14.89%) 4 (13.79%) 0.999b
>18 years 40 (85.11%) 25 (86.21%)
Activity Stable 30 (63.83%) 21 (72.41%) 0.439a
Active 17 (36.17%) 8 (27.59%)
Skin phototype TwoThree 24 (51.06%)19 (40.43%) 10 (34.48%)15 (51.72%) 0.414b
Four 4 (8.51%) 4 (13.79%)
Family history Absent 39 (82.98%) 28 (96.55%) 0.141b
Present 8 (17.02%) 1 (3.45%)
Halo nevus Absent 45 (95.74%) 27 (93.1%) 0.673b
Present 2 (4.26%) 2 (6.9%)
Duration of Vitiligo (years) 7.87±0.58 8.03±0.88 0.873c
Duration of Vitiligo (years)
(categorical) ≤8>8 24 (51.06%)23 (48.94%) 15 (51.72%)14 (48.28%) 0.955a
Total protein (g/dL) 7.26±0.06 7.15±0.06 0.201c
Albumin (g/dL) 4.31±0.06 4.05±0.07 0.009c
Native Thiol SH (µmol/L) 340.81±9.85 337.89±12.81 0.856c
Total Thiol (µmol/L) 379.27±9.70 375.27±13.94 0.806c
Disulfide (µmol/L) 19.23±1.04 18.69±1.16 0.738c
Disulfide to Native Thiol Ratio 5.96±0.42 5.59±0.33 0.504c
Disulfide to Total Thiol Ratio 5.21±0.32 4.99±0.26 0.590c
Native Thiol to Total Thiol Ratio 89.57±0.65 90.02±0.52 0.587c
Leukocyte count (WBC cell/L) 9603.19±1578.40 6193.10±364.46 0.098c
Platelet (PLT cell/µl) 246191.49±6378.71 252965.52±11708.32 0.582c
Platelet to lymphocyte ratio (PLR) 96.64±5.60 122.02±7.71 0.008c
Neutrophil/lymphocyte ratio (NLR) 2.00±0.102 1.72±0.114 0.079c
Neutrophil count (NC cell/L) 4667.44±201.68 3785.17±267.89 0.010c
Lymphocyte count (LC cell/L) 2517.66±122.19 2200.00±107.82 0.077c
Mean Platelet Volume (MPV fL) 10.32±0.14 10.46±0.21 0.588c
Hemoglobin (Hg g/dL) 14.23±0.15 12.87±0.10 0.001c
a – Pearson’s Chi-Square Test used; b – Fisher’s Exact Test used; c – Independent Sample T-test used. Descriptive statistics are given as mean±standard error of mean.
Vitiligo patients were categorized into two groups as follows: a group of patients that had vitiligo symp-toms for 8 years and less (≤8 years), and a group of vitiligo patients with vitiligo symptoms lasting more than 8 years (>8 years). The demographic character-istics and biochemical markers were compared with respect to disease duration. An interesting result is that the younger the onset of illness, the longer the symptoms that continue or vice versa. Vitiligo patients with vitiligo symptoms for 8 years and less (≤8 years) had an average onset of illness age (31±9 years) that
was significantly higher than patients that presented the symptoms for more than 8 years (25±10 years). Furthermore, the NC in the patients (>8 years) was significantly higher than in those with symptoms last-ing 8 years or less (P=0.026).
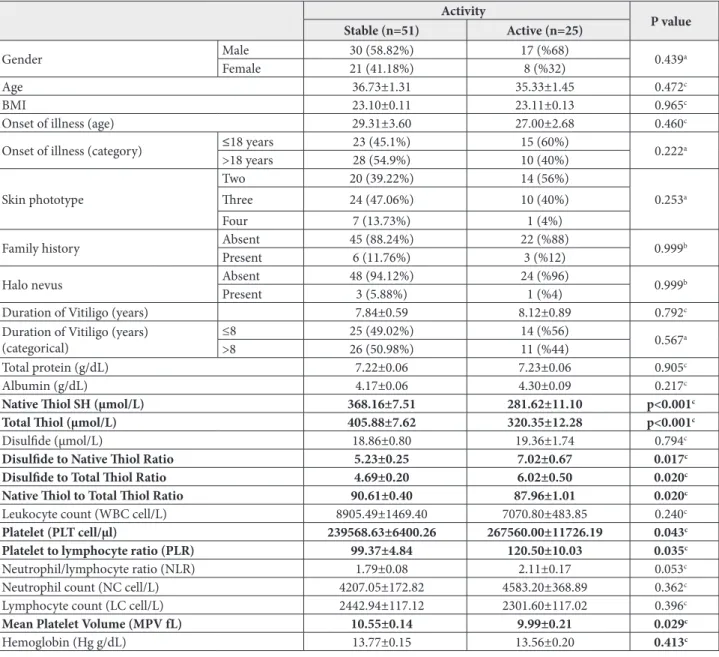
The role of progressivity of vitiligo symptoms on thiol/disulfide homeostasis was also investigated (Table 3). The native thiol levels of stable vitiligo pa-tients were significantly higher (368.16±53.61 µmol/L) than those with progressive (281.62±55.5 µmol/L) symptoms (P<0.001). Likewise, the total thiol
aver-Table 3. Comparison of demographic characteristics and biochemical markers according to activity levels of vitiligo patients. Activity P value Stable (n=51) Active (n=25) Gender Male 30 (58.82%) 17 (%68) 0.439a Female 21 (41.18%) 8 (%32) Age 36.73±1.31 35.33±1.45 0.472c BMI 23.10±0.11 23.11±0.13 0.965c
Onset of illness (age) 29.31±3.60 27.00±2.68 0.460c
Onset of illness (category) ≤18 years 23 (45.1%) 15 (60%) 0.222a
>18 years 28 (54.9%) 10 (40%) Skin phototype Two 20 (39.22%) 14 (56%) 0.253a Three 24 (47.06%) 10 (40%) Four 7 (13.73%) 1 (4%)
Family history Absent 45 (88.24%) 22 (%88) 0.999b
Present 6 (11.76%) 3 (%12)
Halo nevus Absent 48 (94.12%) 24 (%96) 0.999b
Present 3 (5.88%) 1 (%4)
Duration of Vitiligo (years) 7.84±0.59 8.12±0.89 0.792c
Duration of Vitiligo (years)
(categorical) ≤8>8 25 (49.02%)26 (50.98%) 14 (%56)11 (%44) 0.567a
Total protein (g/dL) 7.22±0.06 7.23±0.06 0.905c
Albumin (g/dL) 4.17±0.06 4.30±0.09 0.217c
Native Thiol SH (µmol/L) 368.16±7.51 281.62±11.10 p<0.001c
Total Thiol (µmol/L) 405.88±7.62 320.35±12.28 p<0.001c
Disulfide (µmol/L) 18.86±0.80 19.36±1.74 0.794c
Disulfide to Native Thiol Ratio 5.23±0.25 7.02±0.67 0.017c
Disulfide to Total Thiol Ratio 4.69±0.20 6.02±0.50 0.020c
Native Thiol to Total Thiol Ratio 90.61±0.40 87.96±1.01 0.020c
Leukocyte count (WBC cell/L) 8905.49±1469.40 7070.80±483.85 0.240c
Platelet (PLT cell/µl) 239568.63±6400.26 267560.00±11726.19 0.043c
Platelet to lymphocyte ratio (PLR) 99.37±4.84 120.50±10.03 0.035c
Neutrophil/lymphocyte ratio (NLR) 1.79±0.08 2.11±0.17 0.053c
Neutrophil count (NC cell/L) 4207.05±172.82 4583.20±368.89 0.362c
Lymphocyte count (LC cell/L) 2442.94±117.12 2301.60±117.02 0.396c
Mean Platelet Volume (MPV fL) 10.55±0.14 9.99±0.21 0.029c
Hemoglobin (Hg g/dL) 13.77±0.15 13.56±0.20 0.413c
a – Pearson’s Chi-Square Test used; b – Fisher’s Exact Test used; c – Independent Sample T-test used. Descriptive statistics are given as mean±standard error of mean.
ages (405.88±54.42 µmol/L) were significantly higher (320.35±61.42 µmol/L) than the active ones (p<0.001). In contrast to these findings, active vitiligo patients had disulfide/native thiol and disulfide/total thiol ratios that were significantly higher (P<0.05 for each) than in stable patients. Progressivity also affected some of the blood parameters in such a way that PLT levels were increased, while mean platelet volumes (MPV) were reduced as compared to stable patients. When the other comparisons were inspected, progressivity did not affect other blood parameters (P>0.05). The results also demonstrated that the total protein serum level of patients with halo nevus was significantly higher than in patients without halo nevus (P=0.029) (data not shown).
Correlation analysis
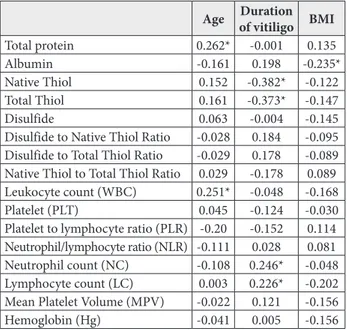
Correlation analysis of biochemical parameters with the demographic characteristics was also performed in this study (Table 4). There was a weak but positive significant correlation between patient age and total serum protein levels (P<0.001). With increasing age, the amounts of total protein also increased. A similar result is also valid for the WBC counts. However, native and total thiol values were negatively
corre-lated (P<0.001 for each) with the duration of vitiligo. Likewise, NC and LC values inversely correlated with vitiligo duration and they were statistically significant. The results also reflected that the body mass index (BMI) of vitiligo patients and serum albumin levels were negatively correlated with each other (P<0.001).
DISCUSSION
Being a chronic skin disorder characterized by ir-regular loss of skin color, vitiligo affects people at any age or ethnicity. The two main types of disease are generalized and segmental vitiligo. The former is the common symmetrical form and the latter is the one affecting only one side of the body [10]. Deteriora-tion of melanocytes is the pathological hallmark of patchy skin, although its underlying mechanisms are not fully understood. Intrinsic factors such as autoim-munity, autotoxicity of melanocytes and mutations, and extrinsic factors like infections and xenobiotics have been considered as contributing factors [11]. Another main contributor to the disease is oxidative stress [12,13]. Aberrant accumulation of free radicals interrupts redox homeostasis and eventually contributes to pathogenesis [14]. Melanocyte destruction caused by the accumulation of toxic free radicals is thought to initiate skin patches of vitiligo [15].
Thiol groups are significantly included in signal-ing/homeostasis through oxidation, reduction and disulfide exchange. In cells, complete free thiols and thiol-containing compounds such as cysteine, glutathi-one and thiol proteins are present at specific oxidized/ reduced ratios. This pool of cellular thiols is controlled by mechanisms connected to their intrinsic activity against oxidant and antioxidant molecules and their dynamic production and elimination from the cells [16]. The conversion of native and oxidized forms to each other is strongly regulated by the cellular redox status which favors disulfide formation under oxidative conditions. Particular thiol pools in biological systems are in bal-ance with the plasma thiol/disulfide pool, which has great biomedical significance because they participate in several processes such as cell signaling, antioxidant defense, and protein regulation [3]. Thiol/disulfide homeostasis is an important and reversible dynamic mechanism of oxidative stress in organisms. A number of studies have shown that thiol-disulfide homeostasis
Table 4. Correlation of some biochemical parameters with age, duration of vitiligo and BMI of groups. Pearson’s correlation coef-ficients are demonstrated.
Age Duration of vitiligo BMI
Total protein 0.262* -0.001 0.135
Albumin -0.161 0.198 -0.235*
Native Thiol 0.152 -0.382* -0.122
Total Thiol 0.161 -0.373* -0.147
Disulfide 0.063 -0.004 -0.145
Disulfide to Native Thiol Ratio -0.028 0.184 -0.095
Disulfide to Total Thiol Ratio -0.029 0.178 -0.089
Native Thiol to Total Thiol Ratio 0.029 -0.178 0.089
Leukocyte count (WBC) 0.251* -0.048 -0.168
Platelet (PLT) 0.045 -0.124 -0.030
Platelet to lymphocyte ratio (PLR) -0.20 -0.152 0.114
Neutrophil/lymphocyte ratio (NLR) -0.111 0.028 0.081
Neutrophil count (NC) -0.108 0.246* -0.048
Lymphocyte count (LC) 0.003 0.226* -0.202
Mean Platelet Volume (MPV) -0.022 0.121 -0.156
Hemoglobin (Hg) -0.041 0.005 -0.156
in human plasma can be related to oxidative reactions and antioxidant defenses in several diseases [5].
Human plasma is relatively poor in thiol-based antioxidants; they are in lower concentrations than in cells and are mostly oxidized [16]. The most abundant protein in plasma is albumin and its thiol groups are the most abundant serum thiols, which are important targets for most radical species. This study demonstrated that albumin levels of vitiligo patients were lower than those in healthy subjects. This could be attributed to the degradation of oxidatively-modified albumins from the serum, since the half-life of a protein decreases under oxidative conditions [17,18]. In a recent study, it was found that native and total thiol levels of vitiligo patients were higher than those of healthy subjects [19]. In contrast to this result, the decrease in native and total thiol contents as well as native/total thiol ratios and elevation of disulfide/native thiol and di-sulfide/total thiol ratios reported in this study, clearly demonstrated changes in serum thiol homeostasis in response to the oxidative state in vitiligo patients. Our study also uncovered a significant negative correlation between native and total thiol values and the duration of vitiligo. Patients with vitiligo are more susceptible to higher levels of oxidative stress than healthy individu-als, and a global shift in serum thiol homeostasis in favor of prooxidants could account for the long-term pathogenesis of the disease. Therefore, quantitative investigation of the thiol redox state of plasma can provide relevant information as clinical evidence of the oxidative burden in vitiligo patients.
Lymphocytes are an important part of the immune system. They help fight diseases, and it is normal to observe a temporary rise in the number of lymphocytes after an infection and in inflammation [20]. The pres-ent study revealed the elevation of lymphocyte counts and a reduced neutrophil/lymphocyte ratio. These changes in inflammatory blood components might be the result of pathogenesis of vitiligo. Considering the effect of gender on blood biomarkers, the serum albumin levels, neutrophil counts and hemoglobin contents were found to be higher in males. This could be due to the faster adaptive response of male patients to vitiligo pathogenesis. In addition to gender, a fam-ily history of vitiligo also affected serum albumin and lymphocyte counts. Another interesting result derived
from our study is that the younger the vitiligo patients are at the onset of illness, the longer the symptoms are suffered. This means that younger vitiligo patients had a worse disease prognosis. The role of progressivity of vitiligo symptoms on thiol/disulfide homeostasis were also investigated in this study. Native thiol and total thiol levels in stable vitiligo patients were significantly higher than in those with progressive symptoms. At the same time, active vitiligo patients had disulfide/ native thiol and disulfide/total thiol ratios that were significantly higher than in stable patients. The increase in oxidative components of thiol/disulfide homoeo-stasis observed with disease progressivity could point to further development of oxidative imbalance and an insufficient response to increased oxidative stress in patients with progressive vitiligo.
CONCLUSION
Impaired thiol/disulfide homeostasis in patients with vitiligo compared to the healthy controls is the central finding of this study. It is possible that impaired dy-namic thiol/disulfide homeostasis plays a role in the pathophysiology of vitiligo by regulating the activity and release of melanin pigment and/or by damaging melanin-producing cells, melanocytes. A causal rela-tionship between vitiligo and dynamic thiol/disulfide homeostasis has not yet been fully confirmed. Thus, further prospective studies are needed to elucidate the connection between these entities.
Funding: This study was supported partially by Hitit University and Yıldırım Beyazıt University which kindly provided laboratory reagents and equipment.
Author contributions: SDP, AO and CO collected the samples from the patients. GP designed the study and performed the hema-tological measurements, SN and ÖE measured thiol homeostasis. GS organized the research, performed the statistical analysis and wrote the paper.
Conflict of interest disclosure: The authors declare no conflict of interest.
REFERENCES
1. Rashighi M, Harris JE. Vitiligo Pathogenesis and Emerging Treatments. Dermatol Clin. 2017;35(2):257-65.
2. Speeckaert R. Vitiligo: An Update on Pathophysiology and Treatment Options. Am J Clin Dermatol. 2017;18(6):733-44.
3. Oliveira PVS, Laurindo FRM. Implications of plasma thiol redox in disease. Clin Sci. 2018;132(12):1257-80.
4. Biswas S, Chida AS, Rahman I. Redox modifications of protein-thiols: Emerging roles in cell signaling. Biochem Pharmacol. 2018;71(5):551-64.
5. Ates I, Ozkayar N, Inan B, Yilmaz FM, Topcuoglu C, Nese-lioglu S, Erel O, Dede F, Yilmaz N. Dynamic thiol/disulphide homeostasis in patients with newly diagnosed primary hypertension. J Am Soc Hypertens. 2016;10(2):159-66. 6. Milton NGN. Homocysteine Inhibits Hydrogen Peroxide
Breakdown by Catalase. Open Enzym Inhib J. 2008;1:34-41. 7. Kishida R, Kasai H, Aspera SM, Arevalo RL, Nakanishi H. Branching Reaction in Melanogenesis: The Effect of Intra-molecular Cyclization on Thiol Binding. J Electron Mater. 2017;46(6):3784-8.
8. Jara JR, Aroca P, Solano F, Martinez JH, Lozano JA. The role of sulfhydryl compounds in mammalian melanogen-esis: the effect of cysteine and glutathione upon tyrosinase and the intermediates of the pathway. BBA - Gen Subj. 1988;967(2):296-303.
9. Erel O, Neselioglu S. A novel and automated assay for thiol/ disulphide homeostasis. Clin Biochem. 2014;47(18):326-32. 10. Whitton ME, Pinart M, Batchelor J, Leonardi-Bee J, González U, Jiyad Z, Eleftheriadou V, Ezzedine K. Inter-ventions for vitiligo. Cochrane Database Syst Rev. 2015;24(2):CD003263.
11. Taïeb A. Intrinsic and extrinsic pathomechanisms in vitiligo. Pigment cell Res. 2000;13(8):41-7.
12. Shi M-H, Wu Y, Li L, Cai Y-F, Liu M, Gao X-H, Chen ED. Meta-analysis of the association between vitiligo and the level of superoxide dismutase or malondialdehyde. Clin Exp Dermatol. 2017;42(1):21-9.
13. Jain A, Mal J, Mehndiratta V, Chander R, Patra SK. Study of Oxidative Stress in Vitiligo. Indian J Clin Biochem. 2011;26(1):78.
14. Qiu L, Song Z, Setaluri V. Oxidative Stress and Vitiligo: The Nrf2-ARE Signaling Connection. J Invest Dermatol. 2014;134(8):2074-6.
15. Karsli N, Akcali C, Ozgoztasi O, Kirtak N, Inaloz S. Role of oxidative stress in the pathogenesis of vitiligo with special emphasis on the antioxidant action of narrowband ultra-violet B phototherapy. J Int Med Res. 2014;42(3):799-805. 16. Turell L, Radi R, Alvarez B. The thiol pool in human plasma:
The central contribution of albumin to redox processes. Free Radic Biol Med. 2013;65:244-53.
17. Vogel C, Silva GM, Marcotte EM. Protein expression regulation under oxidative stress. Mol Cell Proteomicst. 2011;10(12):M111.009217.
18. Pandey KB, Mehdi MM, Maurya PK, Rizvi SI. Plasma pro-tein oxidation and its correlation with antioxidant potential during human aging. Dis Markers. 2010;29(1):31-6. 19. Akoglu G, Neselioglu S, Karaismailoglu E, Aktas A, Erel O.
Plasma Thiol Levels are Associated with Disease Severity in Nonsegmental Vitiligo. Indian J Dermatol. 2018;63(4):323-7. 20. Koyasu S, Moro K. Role of innate lymphocytes in infection