A
SIAN
J
OURNAL OF
C
HEMISTRY
A
SIAN
J
OURNAL OF
C
HEMISTRY
https://doi.org/10.14233/ajchem.2018.21329
INTRODUCTION
Activated carbon has important adsorbent, peripheral, thermal, mechanical and electrical features for new practices of activated carbon [1]. It is a highly ambidextrous substance with wide surface field, wide interior surface field, pore volume, well chemical steadiness, diverse oxygen-having functional groups on the surface. Because of its perfect adsorption ability, it is extensively usaged in refinement and distinction in numerous industrial operation inclusive medical usage, gas storage, conta-minant and smell rustication, gas decomposition and catalysis
[2,3]. Activated carbons are manufactured from distinct crude materials of organic origin that are rich in elemental carbon, including biomass waste. The selection of the crude material for the manufacturing of activated carbon is decided by the ultimate designation of the activated carbon as well as the availability and cost of the raw material [4]. Activated carbon can be produced such as agricultural wastes, inclusive a corn crust [5,6], peanut crust [7], cotton handle [8], coal, wood, coconut shell, peat [9], almond crust [10], date palm [11], rice shell [11], hazel nut [12], walnut shells [13]. There are two significant process to manu-facturing activated carbon [14]: (a) Carbonization which is pyrolysis of the pioneers in an inert atmosphere. Along this process, the organic materials carbon ingredient increases and the constricted or plugged pores are created. Carbonization warmth of cellulosic biomass is at under than 800 °C and (b) Activation
Preparation and Characterization of Activated Carbon Produced from
Eriobotrya japonica Seed by Chemical Activation with ZnCl
2FEVZI KILIÇEL* and HACER SIBEL KARAPINAR
Department of Chemistry, Kamil Özdag Sciences Faculty, Karamanoglu Mehmetbey University, Karaman, Turkey *Corresponding author: E-mail: [email protected]
Received: 13 March 2018; Accepted: 10 May 2018; Published online: 30 June 2018; AJC-18981
This study reports the utilization of Eriobotrya japonica seed in activated carbon arranging by chemical activation with ZnCl2 agent and the effect of carbonization situations surface properties. The influences of diverse activation temperatures (500, 600, 700 °C) on the pore structure properties of activated carbons were discussed by using N2 adsorption/desorption isotherms, scanning electron microscopy, thermogravimetric analysis, Fourier transform infrared spectroscopy and X-ray diffraction. The conclusions indicated that the carbonization temperature have favourable effect on Teller (BET) surface field, aggregate pore volume. The highest Brunauer-Emmett-Teller surface area of activated carbon produced at 700 °C was 1079 m2/g, total pore volume was 0.52 cm3/g, carbonization time was 2 h and impregnation rate was 1/1. Eriobotrya japonica activated carbon (EJAC)-ZnCl2 can be considered as an ideal low-expense and eco-friendly adsorbent.
Keywords: Eriobotrya japonica seed, Chemical activation, Activated carbon, Characterization. Asian Journal of Chemistry; Vol. 30, No. 8 (2018), 1823-1828
is a method used to further improve pores. There are two types of chemical activation and physical activation. Throughout physical activation, a substance is carbonized in an inert atmos-phere and after that activated by vapour or carbonic-acid gas to improve inner porousness. The activation temperature for cellulosic carbon is between 800 and 1000 °C [15,16]. In chemical activation, the raw sample is carbonized by mixing with activation agents like zinc chloride, phosphoric acid, sodium hydroxide and potassium hydroxide [17,18]. Chemical activation generally gets location at lesser temperature and smaller process time than physical activation [15,19]. The energy spending and the cost are also decreased by inferior temperatures [15,16]. In addition to, chemical activation keeps bigger surface field and more elevated carbon efficiency than physical activation [19]. Usually, the activation temperature, activation time, impregnation ratio, carbonization conditions, heating conditions, nitrogen flow rate and activation agents are the most important factors impressing the surface fields and pore volumes of the produced activated carbon [20,21]. In this study, activated carbon is produced from
Eriobotrya japonica seed by chemical activation with ZnCl2.
The characterization of the produced activated carbons are determined by SEM, BET, FT-IR, TGA and XRD analyzes.
EXPERIMENTAL
Eriobotrya japonica seed was used activated carbon
spring and summer in Karaman Turkey. The Eriobotrya japonica seed was separated from the fruit and dried by warming at 80 °C during night. After that, the crude material was milled in grinder and screened to 20-200 mesh grain dimension by standard sieves. The obtained samples were stored in sealed containers until the experimentation.
All reagents (analytical grade AgNO3, HCl, ZnCl2 and
H2O) were bought from Merck. pH studies were done usage a
pH meter (Model Cyberscan 510). The FT-IR spectra for func-tional group determination were recorded in KBr discs on a spectrophotometer (Model Perkin Elmer-400 Series). A scanning electron microscopy (SEM, HITACHI S-520) was utilizationed for scanning the adsorbent surface. The outer and micropore surface fields, sum pore, micropore capacity and pore size distribution were obtained with the Brunauer–Emmett–Teller (BET) method (Micromeritics ASAP 2020). Powder X-ray diffraction (XRD) models of the examples were registered at room temperature on the Bruker D8 Advance diffractometer handling CuKα radiation. The thermal evolution of the
precursor and ZnCl2 impregnated samples were studied by the
thermogravimetric analysis (TGA-50 analyzer) from room temperature until 1000 °C at a ratio of 10 °C min–1 with a N
2
flow rate of 100 mL min–1. The total weight losses of the
examples were detected from the corresponding TGA curves.
Preparation of activated carbons: The preparation of
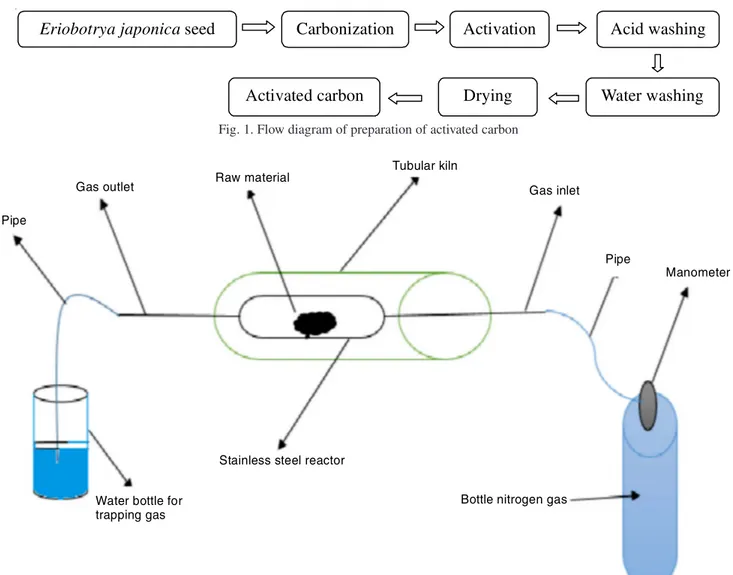
the activated carbon (AC) primarily contains carbonization and activation. The aim of carbonization is to get first pore form for activation and suitable carbon concentrate. The aim of activation is to compose new pores and widen the surface field of activated carbon. The flow scheme for the production of activated carbon is given in Fig. 1.
The Eriobotrya japonica powder was impregnated into the zinc chloride with rates 1/1 (10 g/10 g). 150 mL of distilled water was joined to the mixture. The blend was kept to stand at room temperature for 1 day. The mixtures were dehydrated in an oven at 110 °C throughout 24 h. Carbonization of the precursor is applied in a hollow cylindrical rust proof steel reactor of 30 cm in width. The reactor has an inlet and a gas outlet. It is warmed with a tubular oven (Model Protherm) equipped by a heat programmer controller. This system allows the management of the temperature rate, the rise level and the analyses duration of the final temperature. The examples were warmed to last temperatures of 500, 600, 700 °C with 5 °C min-1 warming ratio for residence time of 2 h. Finally,
tempe-rature drop until room tempetempe-rature. The activation is carried out by using nitrogen (9,880 mLmin-1) during the hall
experi-ment (Fig. 2). After cooling to room temperature, the produce activated carbon was bathed with 2 M HCl solution by warming
Eriobotrya japonica
seed
Carbonization
Activation
Acid washing
Water washing
Drying
Activated carbon
Fig. 1. Flow diagram of preparation of activated carbon
Pipe
Gas outlet Raw material
Tubular kiln
Gas inlet
Pipe
Manometer
Bottle nitrogen gas Stainless steel reactor
Water bottle for trapping gas
at about 95 °C for 0.5 h, strained and rinsed with warm pure water till neutral pH, desiccated at 110 °C in a furnace for just about 12 h and weighed to compute the yield.
RESULTS AND DISCUSSION
Yield and specific surface BET: Influences of
carbo-nization temperature on the surface field (S) and yield (%) of activated carbon were assess below the terms of the impreg-nation rate of 1/1 (g/g) and carbonization period of 2 h. The carbon yield was computed based on the mass of Eriobotrya
japonica (EJ) seed on a dry base from the following equality:
Weight of activated carbon (g) Carbon yield (wt %) 100
Weight of EJ seed (g)
= ×
The most important study parameters affecting the yield of activated carbon are carbonization temperature, carboni-zation duration and impregnation rate. As seen from Table-1, with the rising in carbonization temperature, the yield of active carbon increased. This may be connected to the promotion of carbon flaming-off, tar evaporation and the vaporization of biomass would be increased because of rise of temperature
[22,23]. The specific surface BET of activated carbons for diverse carbonization temperatures were detected by nitrogen adsorption at 77.3 K. The surface field has changed in direct proportion to the temperature. As viewed from the Table-2, when temperature rised from 500 to 700 °C, the SBET, Smic, Sext,
Vt, Vmic and Dp values increased from 863.3 to 1079 m2/g, from
207.0 to 417.0, from 656.3 to 662.2, from 0.44 to 0.52 cm3
/g, from 0.09 to 0.19 and from 3.31 to 3.55 nm, respectively. This increase, is thought to be due to the continued deterioration of the volatile components of activated carbon as the temperature rises and the formation of new pores. As a result, 700 °C was selected as the ideal carbonization temperature in order to the best pore area and yield. The BET surface field of active carbon produced at 600 °C was not measured.
TABLE-1
EFFECT OF EXPERIMENTAL PARAMETERS ON THE YIELD OF ACTIVATED CARBON SAMPLES Sample Impregnation rate Carbonization temperature (°C) Carbonization time (hold time) (min) Yield (%) AC1 1/1 500 120 42.58 AC2 1/1 600 120 43.09 AC3 1/1 700 120 43.40 TABLE-2
STRUCTURAL CHARACTERISTICS OF ACTIVATED CARBON Structural properties AC1 AC2 AC3 BET surface area, SBET (m
2
/g) 863.3 ND* 1079 Micropore area, SMIC (m2/g) 207.0 417.0
External surface area, SEXT (m2/g) 656.3 662.2
Total pore volume, Vt (cm 3
/g) 0.44 0.52 t-plot micropore volume, VMIC (cm3/g) 0.09 0.19
Average pore size, DP (nm) 3.31 3.55
*ND = None detected
Adsorption isotherms: The chemical properties of the
adsorbent, the porous structure and the heat adsorption are determined with adsorption isotherms. The porosity of
acti-vated carbon substances is generally described by handling N2 adsorption method [24]. Fig. 3 shows the N2 adsorption/
desorption isotherms at 77.3 K of the three dissimilar activated carbon examples made from Eriobotrya japonica seed. The isotherm created from these works were found to follow the tendency of complex Type I and Type IV isotherms accordingly to the International Union of Pure and Applied Chemistry (IUPAC) [25]. 16 14 12 10 8 6 4 2 0 Q u a n ti ty ad so rb e d ( m mo l/ g) 0 0.2 0.4 0.6 0.8 1.0 1.2 Relative pressure (P/P )o AC1 AC3
Fig. 3. N2 adsorption and desorption isotherms of Eriobotrya japonica seed
produced activated carbon
Pore magnitude distribituan is a very important property of poriferous sorbents because the dissimilarity in the pore magnitude effects the adsorption capability in order to mole-cules of distinct dimensions and shape. According to the rating IUP activated carbon accepts, sorbent pores are examined in three groups as micropores (< 2 nm), mesopores (2-50 nm) and macropores (> 50 nm) [26]. Fig. 4 shows that large surface area activated carbon was obtained. The curves formed at low pressure show adsorption into the micropores [27]. The increase in the graph indicates the growth of the pores and the improving of mesopores. 0.12 0.10 0.08 0.06 0.04 0.02 0 Por e v o lu m e ( c m /g ) 3 0 50 100 150 200 Pore diameter (nm) AC1 AC3
Fig. 4. Pore size distributions and N2 adsorption of activated carbon
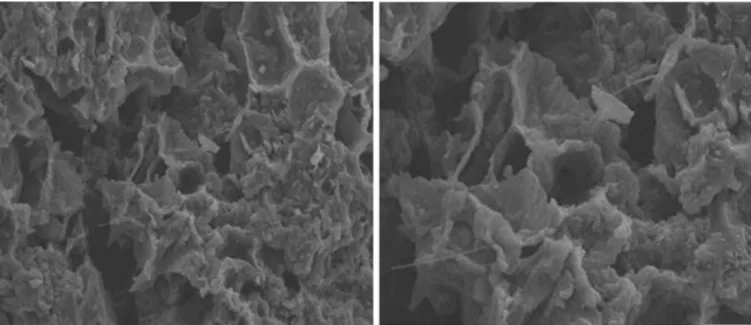
SEM analysis: SEM views of activated carbons produced
at distinct temperatures are given in Figs. 5-7.
SEM technique was used to watch the surface physical features of the activated carbon. According to Figs. 5-7; when the SEM images of 1000 and 2000 fold magnifications of each active carbon are taken, activated carbon has a porous structure. The obtained activated carbon displayed a highly porous struc-ture with various sizes of mesopores and macropores. Micro-pores were observed at this resolution. Additionally, a three dimensional interconnected and irregular mesopore structure can also be clearly observed. These pores are caused by the
Fig. 5. SEM images of activated carbon produced at 500 °C carbonization temperature
Fig. 6. SEM images of activated carbon produced at 600 °C carbonization temperature
evaporation of the ZnCl2 chemical agent during carbonization
to leave free space [28]. The mesopores can offer adsorption sites for goal contaminants.
Fourier transform infrared spectroscopy (FT-IR): The
FT-IR spectra of active carbon produced at 500 °C and 700 °C is given in Fig. 8. T ra n s mi tt a nc e ( % ) 4000 3600 3200 2800 2400 2000 1800 1600 1400 1200 1000 800 Wavenumber (cm )–1 (a) (b) 3320.12 3005.20 3005.20 3320.12 1745.30 1634.53 1510.341380.72 1180.131050.57 1745.30 1634.53 1510.34 1380.72 1180.131050.57
Fig. 8. FT-IR spectra with carbonization temperatures of 500 °C (a) and 700 °C (b)
The spectra show a number of absorption peaks defining the compound structure of the materials. According to Fig. 8, the existence of the wide and intensive absorption peak at 3320.12 cm-1 shows the O-H stretching oscillation of cellulose,
hemi-cellulose, absorbed water, pectin and lignin. The peak appeared at 3005.2 cm-1 may be assign to the aliphatic satiated C-H tension
oscillations of in lignin polysaccharides bearing cellulose and hemicellulose [29]. The peak at 1745.30 cm-1 display the
carbonyl (C=O) tension oscillation of the carboxyl classes of pectin, hemicellulose and lignin [30]. The peak at 1634.53 cm-1 may be due to adsorbed water H-O-H bend. The oscillation
at 1510.34 cm-1 and 1380.72 cm-1 could be owing to aliphatic
and aromatic (C-H) groups in the horizontal oscillation of methyl, methoxy and methylene groups. The band at 1180.13 cm-1 is due to the C-O stretching oscillation of phenol group
[31,32]. The band seen nearby 1634.53 cm-1, could be ascribe
to (C=C) vibration in aromatic rings [33]. The peaks in the range of 1250-1000 cm-1 may belong to the C-O stretching
oscillation of alcohols and carboxylic acids [32]. Many absor-ption peaks were not observed while the carbonization tempe-rature increased. This is probably due to the evaporation of organic substances at high temperatures.
Thermal analysis: The TGA curve showing the % mass
change of activated carbon produced by ZnCl2 activation in
Fig. 9. When TGA curve of active carbon produced by ZnCl2
activation are taken into account, it is seen that the initial mass loss is around 8.29 % at 25-109 °C. This reduction is thought to be caused by the removal of phenolic groups from the environment. The second mass loss is about 4.18 % at 109-445 °C and the third mass loss is around 11.75 % at 109-445-660 °C. The total mass loss is 2.11 mg (24.22 %).
XRD analysis: XRD models of the activated carbon are
indicated in Fig. 10. According to Fig. 4, activated carbon sample exhibit with five broad peaks corresponding to
We ig h t ( % ) Temperature (°C) 100 90 80 70 100 200 300 400 500 600 700 800 900
Fig 9. TGA curve of the activated carbon
4000 3000 2000 1000 0 C o unt s 20 30 40 50 60 70 80 2 (°)θ 1 2 3 4 5
Fig. 10. XRD patterns of activated carbon
2θ = 38.9°, 44.1°, 64.5°, 77.6° and 80.9°. When the elemental pairings of the peaks are made 2, 3 and 5th peaks are formed C-C bonds, 1th peak is formed Zn-H and 4th peak is formed H-H. The presence of many C-C pairs shows less impurities.
Conclusion
In this study, active carbon was produced from Eriobotrya
japonica seed using chemical activation method with ZnCl2
agent. Activated carbon was produced at three different carboni-zation temperatures (500, 600, 700 °C). The highest BET surface field (1079 m2
/g), micropore surface area (417 m2
/g) and total micropore volume (0.52 cm3
/g) were obtained below the following terms: impregnation ratio of 1/1, activation temperature of 700 °C and activation time of 2 h. This suggests that ZnCl2 is a activating agent in order to producing activated
carbon by an improved microporous structure. The results show that the chemical activation with ZnCl2 from Eriobotrya japonica seed is good in terms of specific surface field, pore
improvement and the structural order of activated carbon.
Erio-botrya japonica activated carbon-ZnCl2 can be contemplated
as an excellent low-cost and eco-friendly adsorbent.
ACKNOWLEDGEMENTS
The authors are grateful for he financial support of the Scientific Research Project of Karamanoglu Mehmetbey University, Karaman, Turkey (Project Number 01-D-17).
REFERENCES
1. H.P.S. Khalil, M. Jawaid, P. Firoozian, U. Rashid, A. Islam and H.M. Akil, J. Biobased Mater. Bioenergy, 7, 708 (2013);
https://doi.org/10.1166/jbmb.2013.1379.
2. D. Kalderis, D. Koutoulakis, P. Paraskeva, E. Diamadopoulos, E. Otal, J.O. Valle and C. Fernández-Pereira, Chem. Eng. J., 144, 42 (2008);
3. O. Ioannidou and A. Zabaniotou, Renew. Sustain. Energy Rev., 11, 1966 (2007);
https://doi.org/10.1016/j.rser.2006.03.013.
4. P.T. Williams and A.R. Reed, Biomass Bioenergy, 30, 144 (2006);
https://doi.org/10.1016/j.biombioe.2005.11.006.
5. C. Saka, J. Anal. Appl. Pyrolysis, 95, 21 (2012);
https://doi.org/10.1016/j.jaap.2011.12.020.
6. Ö. Sahin and C. Saka, Bioresour. Technol., 136, 163 (2013);
https://doi.org/10.1016/j.biortech.2013.02.074.
7. H. Dolas, O. Sahin, C. Saka and H. Demir, Chem. Eng. J., 166, 191 (2011);
https://doi.org/10.1016/j.cej.2010.10.061.
8. M. Özdemir, T. Bolgaz, C. Saka and Ö. Sahin, J. Anal. Appl. Pyrolysis,
92, 171 (2011);
https://doi.org/10.1016/j.jaap.2011.05.010.
9. R.R. Bansode, J.N. Losso, W.E. Marshall, R.M. Rao and R.J. Portier,
Bioresour. Technol., 90, 175 (2003);
https://doi.org/10.1016/S0960-8524(03)00117-2.
10. D. Savova, E. Apak, E. Ekinci, F. Yardim, N. Petrov, T. Budinova, M. Razvigorova and V. Minkova, Biomass Bioenergy, 21, 133 (2001);
https://doi.org/10.1016/S0961-9534(01)00027-7.
11. P.K. Malik, Dyes Pigments, 56, 239 (2003);
https://doi.org/10.1016/S0143-7208(02)00159-6.
12. A. Aygün, S. Yenisoy-Karakas and I. Duman, Micropor. Mesopor. Mater.,
66, 189 (2003);
https://doi.org/10.1016/j.micromeso.2003.08.028.
13. A.A. Bagreev, A.P. Broshnik, V.V. Strelko and Y.A. Tarasenko, Russ. J.
Appl. Chem., 74, 205 (2001);
https://doi.org/10.1023/A:1012757730582.
14. Z.Z. Chowdhury, S.B. Abd Hamid, R. Das, M.R. Hasan, S.M. Zain, K. Khalid and M.N. Uddin, BioResources, 8, 6523 (2013);
https://doi.org/10.15376/biores.8.4.6523-6555.
15. J. Guo and A.C. Lua, J. Therm. Anal. Calorim., 60, 417 (2000);
https://doi.org/10.1023/A:1010137308378.
16. S.G. Herawan, M.S. Hadi, M.R. Ayob and A. Putra, Sci. World J., Article
ID 624865 (2013);
https://doi.org/10.1155/2013/624865.
17. J. Katesa, S. Junpirom and C. Tangsathitkulchai, Suranaree J. Sci. Technol.,
20, 269 (2013).
18. V. Sricharoenchaikul, C. Pechyen, D. Aht-ong and D. Atong, Energy
Fuels, 22, 31 (2008);
https://doi.org/10.1021/ef700285u.
19. N. Mohamad Nor, L.C. Lau, K.T. Lee and A.R. Mohamed, J. Environ.
Chem. Eng., 1, 658 (2013);
https://doi.org/10.1016/j.jece.2013.09.017.
20. M.A. Lillo-Ródenas, D. Cazorla-Amorós and A. Linares-Solano, Carbon,
41, 267 (2003);
https://doi.org/10.1016/S0008-6223(02)00279-8.
21. A. Sánchez-Sánchez, F. Suárez-García, A. Martínez-Alonso and J.M. Tascón, ACS Appl. Mater. Interfaces, 6, 21237 (2014);
https://doi.org/10.1021/am506176e.
22. Q. Qian, M. Machida and H. Tatsumoto, Bioresour. Technol., 98, 353 (2007);
https://doi.org/10.1016/j.biortech.2005.12.023.
23. Q. Lu, Z. Wang, C.Q. Dong, Z.F. Zhang, Y. Zhang, Y.P. Yang and X.F. Zhu, J. Anal. Appl. Pyrolysis, 91, 273 (2011);
https://doi.org/10.1016/j.jaap.2011.03.002.
24. X. Wang, D. Li, W. Li, J. Peng, H. Xia, L. Zhang, S. Guo and G. Chen,
BioResources, 8, 6184 (2013).
25. K.S.W. Sing, Pure Appl. Chem., 54, 2201 (1982);
https://doi.org/10.1351/pac198254112201.
26. H. Xiao, H. Peng, S. Deng, X. Yang, Y. Zhang and Y. Li, Bioresour.
Technol., 111, 127 (2012);
https://doi.org/10.1016/j.biortech.2012.02.054.
27. W. Wang and D. Yuan, Sci. Rep., 4, 5711 (2015);
https://doi.org/10.1038/srep05711.
28. H. Deng, G. Li, H. Yang, J. Tang and J. Tang, Chem. Eng. J., 163, 373 (2010);
https://doi.org/10.1016/j.cej.2010.08.019.
29. A. Gundogdu, C. Duran, H.B. Senturk, M. Soylak, M. Imamoglu and Y. Onal, J. Anal. Appl. Pyrolysis, 104, 249 (2013);
https://doi.org/10.1016/j.jaap.2013.07.008.
30. V.O. Njoku, K.Y. Foo and B.H. Hameed, Chem. Eng. J., 215-216, 383 (2013);
https://doi.org/10.1016/j.cej.2012.10.068.
31. B.H. Hameed and F.B.M. Daud, Chem. Eng. J., 139, 48 (2008);
https://doi.org/10.1016/j.cej.2007.07.089.
32. D. Angin, Fuel, 115, 804 (2014);
https://doi.org/10.1016/j.fuel.2013.04.060.
33. A.C. Lua and T. Yang, J. Colloid Interface Sci., 290, 505 (2005);