Sciences
Volume 15, Issue 2, (2020) 208-219
www.cjes.eu
Prediction of the time spent on Instagram by social media addiction
and life satisfaction
Ferahim Yesilyurt, Department of Education, Fatih Sultan Mehmet Vakif University, Istanbul, Turkey https://orcid.org/0000-0003-2490-2685
Nihan Solpuk Turhan*, Department of Education, Fatih Sultan Mehmet Vakif University, Istanbul, Turkey https://orcid.org/0000-0002-9279-7699
Suggested Citation:
Yesilyurt, F. & Solpuk Turhan, N. (2020). Prediction of the time spent on instagram by social media addiction and life satisfaction. Cypriot Journal of Educational Science. 15(2), 208–219.
https://doi.org/10.18844/cjes.v15i2.4592
Received September 2, 2019; revised February 5, 2020; accepted April 2, 2020.
Selection and peer review under responsibility of Prof. Dr. Huseyin Uzunboylu, Higher Education Planning, Supervision, Accreditation and Coordination Board, Nicosia, Cyprus.
©2020 United World Center of Research Innovation and Publication. All rights reserved.
Abstract
There are many different debates regarding the time spent on Instagram by social media addiction and life satisfaction. In consequence, in this research, it is aimed to reveal the variables that predict the time spent on Instagram by university students. The research is done in accordance with the causal and correlation model by using a quantitative research method. The results of the research are predicted by the time spent on Instagram, gender, age and social media addiction. Time spent on Instagram differentiates in accordance with the level of social media addiction (Sig = 0.00, p < 0.05) but does not differentiate by life satisfaction (Sig = 0.06, p > 0.05). As social media addiction increases, life satisfaction decreases (r = −0.19). Women spent 0.42 times more time, and the women at the age of 21–22 years spent 0.38 times more time on Instagram.
Keywords: Instagram, life satisfaction, social media, addiction.
*ADDRESS FOR CORRESPONDENCE: Nihan Solpuk Turhan, Fatih Sultan Mehmet Vakıf University, Istanbul, Turkey. E-mail address:
1. Introduction
Social media is an Internet (online) platform, where the persons sharing similar interests communicate with each other. Users, through social media, may reach their friends, develop new friendships and convey their messages by sharing posts to large masses. Social media emerged as a modern fact in our life as a result of the increase in Internet usage (Boyd & Ellison, 2007). With the proliferation of the Internet and the advancement of mobile devices, the number of social media users increases gradually. The number of Facebook and Instagram users in the world reached to one and a half billion, and each of these users spends 136 minutes on these media per day (‘Instagram istatistikleri’, 2019a).
With the widespread use of social media, the problematic uses are seen, and the concept of social media addiction took place in the literature (Kuss & Griffiths, 2017). Although social media addiction is still not regarded as a medical diagnosis, it has become a field of an intensive study. Generally speaking, the symptoms of social media addiction are examined similarly with the symptoms of all kinds of dependencies.
Various risk factors related to social media addiction were investigated. Various research works were conducted on subjects such as perceived social support (Bilgin & Tas, 2018), self-respect (Andreassen & Pallesen, 2014; Bozoglan, Demirer & Sahin, 2013; Hawi & Samaha, 2017; Hou, Xiong, Jiang, Song & Wang, 2019; Zhan, Sun, Wang & Zhang, 2016), mental health (Hou et al., 2019; Jeri-Yabar et al., 2019), success in courses (Hou et al., 2019), social commitment (Savci & Aysan, 2017), subjective well-being (Mackson, Brochu & Schneider, 2019), life satisfaction (Bozoglan et al., 2013; Hawi & Samaha, 2017; Sahin, 2017; Wilczek, 2018; Ye, Hashim, Baghirov & Murphy, 2018), (Campisi, Folan, Diehl, Kable & Rademeyer, 2015), gender (Huang & Su, 2018; Shane-Simpson, Manago, Gaggi & Gillespie-Lynch, 2018; Simsek, Elciyar & Kizilhan, 2019; Thelwall & Vis, 2017) and cultural differences (Sheldon, Rauschnabel, Antony & Car, 2017).
It is seen that the studies on social media addiction are predominantly conducted with regard to Facebook and Twitter (Andreassen & Pallesen, 2014; Hawi & Samaha, 2017). The number of research works conducted on Instagram is relatively limited (Frison & Eggermont, 2017; Huang & Su, 2018; Kircaburun & Griffiths, 2018). Instagram is a social media application, which enables the users to share photos and videos. It is the most popular social media channel recently (Huang & Su, 2018). Instagram has the highest number of users amongst social media applications worldwide after Facebook and YouTube. The number of shares per day is 95 million, and the number of ‘likes’ per day is five billion on the average (Instagram istatistikleri, 2019b). Those, who begin to use Instagram, keep at it due to the perceived ease of use, social interaction and being satisfied with entertainment (Hwang & Cho, 2018).
The use of social media generally increases life satisfaction (Zhan et al., 2016). Life satisfaction is a part of subjective well-being and forms the cognitive aspect of happiness (Diener, Emmons, Larsem & Griffin, 1985). Life satisfaction is defined as meeting the needs and wants (Deniz, Avsaroglu, Deniz & Bek, 2010). Similarly, it can also be defined as having more positive emotions than negative ones with regard to all events experienced on the same day. Thus, it can be said that the persons who have positive emotions as their needs and wants are met to have high life satisfaction. The previous studies conducted on social media addiction have revealed the contradictory results. Whilst, in some studies, a negative correlation was found between social media addiction and life satisfaction (Bozoglan et al., 2013; Hawi & Samaha, 2017), this correlation was not found in some others (Campisi et al., 2015).
This research is conducted to find the different results regarding the time spent on Instagram. The primary purpose of this research is to determine whether there is a correlation between social media addiction and life satisfaction. The second purpose is to reveal whether the university students’ social media addiction or level of life satisfaction differs by the time that they spend on Instagram. The third
2. Method
The quantitative research method is used in this research, and the research designs of this method are developed on the basis of the comparative model and ex post facto model. The comparative model aims to determine the existence of a covariance between two or more variables or the degree of this covariance if any. Ex post facto model, on the other hand, examines the revealed or existing cause and effect relationships amongst some variables (Nunnally, 1978).
2.1. Study group
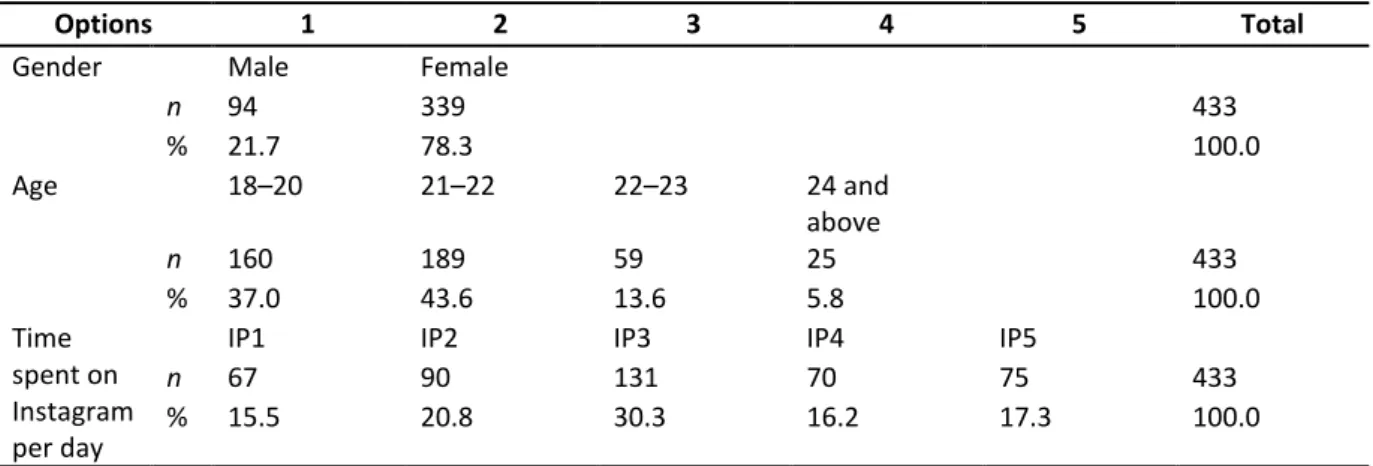
The study group of the research is composed of 433 university students studying in two different faculties of education located in Istanbul Province in the 2019–2020 fall semester. It is suggested that the size of the sample should be at least 10 times more than the number of items (Nunnally, 1978). Accordingly, the number of participants in the research is sufficient. The sampling technique of the research is random sampling in the form of simple random sampling. In this method, a random sample is selected by the researcher from a sampling frame either manually or through a computer by using a random number table or through an online number generator (Fraenkel, Wallen & Hyun, 2012). Daily time spent on Instagram is classified under five categories as shown in Table 1.
Table 1. Distribution regarding the demographic characteristics of the study group
Options 1 2 3 4 5 Total
Gender Male Female
n 94 339 433 % 21.7 78.3 100.0 Age 18–20 21–22 22–23 24 and above n 160 189 59 25 433 % 37.0 43.6 13.6 5.8 100.0 Time spent on Instagram per day
IP1 IP2 IP3 IP4 IP5
n 67 90 131 70 75 433
% 15.5 20.8 30.3 16.2 17.3 100.0
The ones spending 15–29 minutes on Instagram per day (IP1), 30–59 minutes (IP2), 60–119 minutes (IP3), 120–179 minutes (IP4) and more than 180 minutes (IP5).
According to the demographic characteristics of the participants, the number of male students was 94 (21.7%), and the number of female students was 339 (78.3%). According to the ages of the participants, the highest number was in the age group of 21–22 years (43.6%), and the least number was 24 years and older (5.8%). In terms of the time spent on the Instagram, the highest number of participants was in IP3 category (131 participants, 30.3%). The least number of participants was in IP1 category (67 participants, 15.5%).
2.2. Data collection tool
The social media addiction scale developed by Sahin and Yagci (2017) is used in this research. As the research is designed to use a university sample, this scale prepared for adults is used. This five-point Likert scale is composed of 20 items and two subdimensions. The virtual tolerance factor load for these subdimensions was determined as 0.61, and the virtual communication factor load was determined as 0.87. Confirmatory factor analysis is made, and the suitability index values are found (RMSA = 0.059; SRMR = 0.060; NFI = 0.59; CFI = 0.96; GFI = 0.90 and AGFI = 0.88). Cronbach’s alpha internal consistency coefficient is determined as 0.94 for the whole scale, 0.92 for virtual tolerance
and 0.91 for virtual communication subdimensions. Test–retest reliability coefficients used to analyse the reliability of the scale, which are obtained as 0.93 for the whole scale, 0.91 for virtual tolerance and 0.90 for virtual communication subdimensions. Turkish version adopted by Dagli and Baysal (2016) of the ‘life satisfaction’ (SWL) developed by Diener et al. (1985) is used in the research. The scale is one-dimensional and includes five items. In reliability analysis of the scale, Cronbach’s alpha internal consistency coefficient is found to be 0.88, and test–retest reliability is found to be 0.97. Factor analysis results obtained in the validity analysis reveal that the life satisfaction has a one factor structure and is composed of five items as the original scale.
2.3. Analysis of process and data
Personal information form and scales are applied to participants in the research to collect data. The process is managed through Google Survey with volunteer participants. The collected data are analysed by using the SPSS_25 statistical package program. First, one-way and multivariable extreme values of the data are looked at, and no extreme value is found. In the Kolmogorov–Smirnov test for normality distribution, p is found as <0.005. The data obtained from the participants are evaluated with relational, one-way analysis of variance (ANOVA) and multinomial logistic regression analysis. First, the correlation between the independent variables is analysed. Then, the differences in the variables depending on the time spent on Instagram are analysed. Finally, multinomial logistic regression analysis is made to analyse which variables are predictors. Multinomial logistic regression enables the creation of a model that explains the categorical change in a dependent variable based on the multiple independent variables (Starkweather & Moske, 2011).
3. Findings
In this part, the findings regarding the below hypotheses are presented by using the data obtained from the data collection tool used in the research.
Hypothesis 1: There is a correlation between social media addiction and life satisfaction.
The Pearson correlation test is made in relation to Hypothesis 1, and the findings regarding the correlation between social media addiction and life satisfaction are presented as follows:
Table 2. Total Pearson’s correlation analysis scores of social media addiction scale and life satisfaction Total Score of Life
Satisfaction Total Score of Social
media addiction Scale R p N −0.187 0.000 433
According to Table 2, there is a weak negative correlation between social media addiction and life satisfaction (r = −0.187; (p < 0.05). According to this analysis, the satisfaction of students with life decreases as their social media addiction increases. However, the correlation between them is weak.
Hypothesis 2: Social media addiction or life satisfaction differs for university students according to
the time spent on Instagram.
Hypothesis 2 is tested with one-way ANOVA. Whether university students’ social media addiction and life satisfaction differ by the time that they spend on Instagram or not determined accordingly.
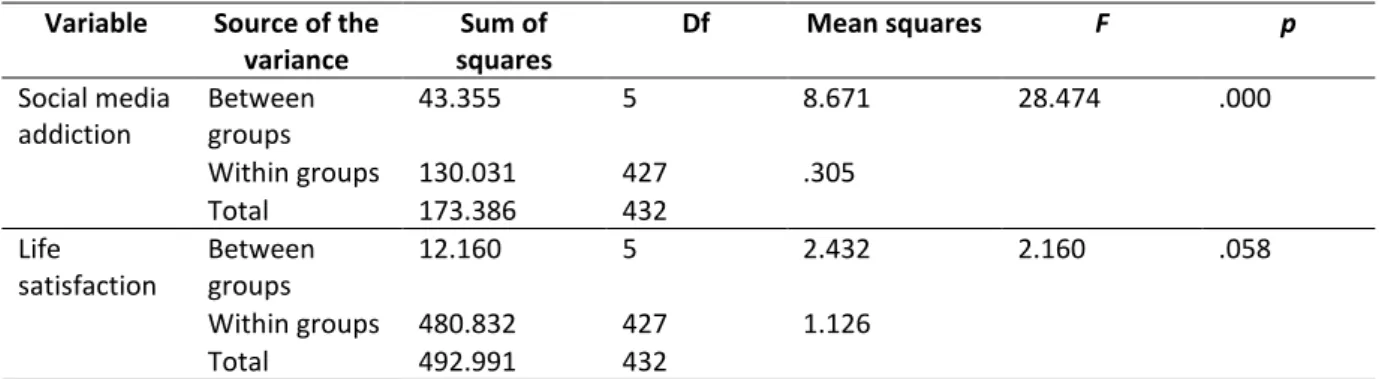
Table 3. One-way ANOVA for social media addiction and life satisfaction difference by the time spent on Instagram
Variable Source of the variance Sum of squares Df Mean squares F p Social media addiction Between groups 43.355 5 8.671 28.474 .000 Within groups 130.031 427 .305 Total 173.386 432 Life satisfaction Between groups 12.160 5 2.432 2.160 .058 Within groups 480.832 427 1.126 Total 492.991 432
At the end of ANOVA analysis, F value is found as 228.474, and it is concluded that there is a significant difference (p < 0.05). According to this analysis, social media addiction differs by the time spent on Instagram. However, no statistically significant difference is found between the life satisfaction average scores of students (F = 2.160, p > 0.05).
On completion of ANOVA analysis, supplementary post hoc analysis is made to determine the source groups of the significant difference observed in social media addiction. Thus, the hypothesis regarding the homogeneity of group distribution variances is tested with Levene’s test, and the homogeneity of the variances is confirmed (p > 0.05). Then, Scheffe multiple comparison test, which is frequently used if the variances are homogeneous, is made. The Scheffe test is preferred because it is sensitive to alpha errors.
Table 4. Post-hoc (Scheffe) test on the difference in social media addiction by the time spent on Instagram (l) Time spent on
(J) Mean difference Time spent on Instagram (I-J) Std. error p IP1 IP2 −0.33146 .09162 .012 IP3 −0.52793 .08528 .000 IP4 −0.71416 0.09704 0.000 IP5 −0.91301 0.09545 0.000 IP2 IP4 −0.38270 0.09048 0.002 IP5 −0.58156 0.08877 0.000 IP3 IP5 −0.38508 0.08221 0.000
According to Table 4, the differences are observed between category IP1 and categories IP2, IP3, IP4 and IP5. Furthermore, the differences are found between category IP2 and categories IP4 and IP5. It is also revealed that there is a difference between categories IP3 and IP5.
Hypothesis 3: Time spent on Instagram is predicted by gender, age and social media addiction.
Multinomial logistic regression analysis is made to analyse Hypothesis 3, and the findings are presented in tables and texts. Model compliance information regarding the model estimated in the research and pseudo R2 values are shown in Table 1.
Table 5. Model compliance information and pseudo R2 values
Model Compliance information Pseudo R2
Model −2LL df P Cox and Snell 0.287
Intercept only 1106.361 Nagelkerke 0.297
According to Table 5, model compliance information (LR X2 = 146.336; df = 25; p = 0.000) confirms that the model is statistically significant. Pseudo R2 values of Cox and Snell and Nagelkerke represent the amount of variance explained by the logistic model, and the result obtained as 0.685 shows a good compliance. Besides, as Cox and Snell R2 will never be 1, Nagelkerke R2 is calculated to make a clearer interpretation (Cokluk, 2010).
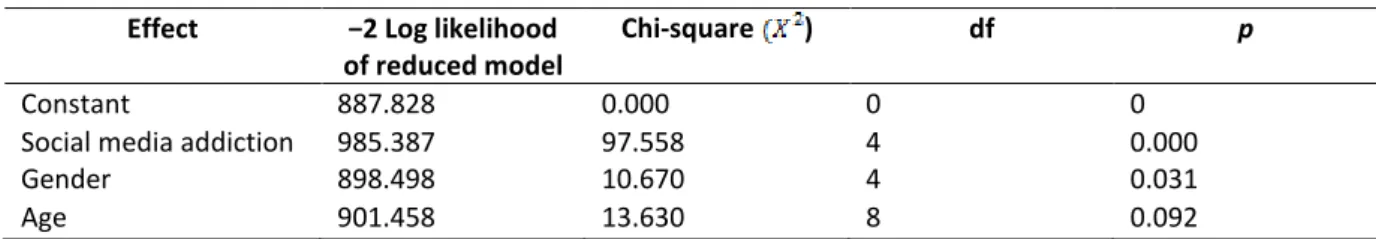
Table 6 shows if each one of the independent variables (social media addiction, gender and age) used in the research significantly explains the dependent variable (time spent on Instagram) as a whole.
Table 6. Likelihood ratio test values Effect −2 Log likelihood
of reduced model
Chi-square ) df p
Constant 887.828 0.000 0 0
Social media addiction 985.387 97.558 4 0.000
Gender 898.498 10.670 4 0.031
Age 901.458 13.630 8 0.092
The likelihood ratio test is used to measure the significance of an independent variable in the logistic regression model. Table 6 shows that the independent variable of social media addiction (p = 0.00 < 0.05) and gender (p = 0.0310.05) has a statistically significant effect on the dependent variable of the time spent on Instagram. On the other hand, it is concluded that the independent variable of age does not have a significant effect (p = 0.069 > 0.05).
Table 7. Multinomial logistic regression model’s coefficient, standard error, odds rate predictions, df p and Exp (β) values
Categories On Instagram
per day
β Std. error Wald df p Exp(β)
Category IP2 Intercept −3.239 0.842 0.842 1 0.000 Social media addiction 0.947 0.294 0.294 1 0.001 2.579 Gender (female) 0.866 0.389 0.389 1 0.026 2.377 Gender (male) 0 . . 0 . . Age (18– 20 years) 0.334 0.454 0.454 1 0.462 1.396 Age (21– 22 years) 1.381 0.472 0.472 1 0.003 3.980 Age (23 years and above) 0 . 0 . .
Category IP3 Constant −4283 0.835 0.842 1 0.000
Social media addiction 1.566 0.290 0.294 1 0.000 4.788 Gender (female) 0.994 0.373 0.389 1 0.008 2.701
Gender (male) 0 . . 0 . . Age (18– 20 years) 0.004 0.412 0.454 1 0.992 1.004 Age (21– 22 years) 0.970 0.438 0.472 1 0.027 2.638 Age (23 years and above) 0 . . 0 . .
Category IP4 Constant −6.992 1.061 0.842 1 0.000
Social media addiction 2.181 0.344 0.294 1 0.000 8.856 Gender (female) 1.315 0.463 0.389 1 0.004 3.724 Gender (male) 0 . . 0 . . Age (18– 20 years) 0.131 0.492 0.454 1 0.790 1.140 Age (21– 22 years) 1.036 0.514 0.472 1 0.044 2.818 Age (23 years and above) 0 . . 0 . .
Category IP5 Constant −8.396 1.115 0.842 1 0.000
Social media addiction 2.862 0.361 0.294 1 0.000 17.491 Gender (female) 0.649 0.426 0.389 1 0.127 1.913 Gender (male) 0 . . 0 . . Age (18– 20 years) −0.090 0.502 0.454 1 0.858 0.914 Age (21– 22 years) 1.107 0.513 0.472 1 0.031 3.024 Age (23 years and above) 0 . . 0 . .
Reference Category: Category IP1
According to Table 7, the dependent variable of time spent on Instagram is analysed on five categories in accordance with the multinomial logistic regression model. The dependent variable of the research is time spent on Instagram, and the independent variables are social media addiction, gender and age. Category IP1 is taken as a reference value for spending time on Instagram. In other categories, the time spent on Instagram by participants is assessed in consideration of social media addiction, gender, age, β coefficients of the time spent on Instagram by participants and Wald statistics. According to multinomial logistic regression analysis, it is concluded that independent variables are significant predictive variables. Life satisfaction, which is not found statistically significant
in the research, is not added to the model. Furthermore, these variables do not significantly affect the reliability of the model.
Social media addiction: Time spent on Instagram by university students is statistically significant for all levels (p < 0.05).
• Probability of ‘time spent on Instagram in category IP2’ is 2.579 times less or, in other words, 0.39 (1/2.579) times more than the probability of ‘time spent on Instagram in category IP1’ at Social media addiction level.
• Probability of ‘time spent on Instagram in category IP3’ is 4.788 times less than the probability of ‘time spent on Instagram in category IP1’ at social media addiction level.
• Probability of ‘time spent on Instagram in category IP4’ is 8.856 times less than the probability of ‘time spent on Instagram in category IP1’ at social media addiction level.
• Probability of ‘time spent on Instagram in category IP5’ is 17.491 times less than the probability of ‘time spent on Instagram in category IP1’ at social media addiction level.
Gender: Time spent by university students on Instagram is statistically significant for all levels except time longer than 180 minutes (p < 0.05).
• Probability of ‘time spent on Instagram in category IP2’ is 2.477 times less than the probability of ‘time spent on Instagram in category IP1’ for females (the level of males is the reference category). • Probability of ‘time spent on Instagram in category IP3’ is 2.701 times less than the probability of
‘time spent on Instagram in category IP1’ for females (the level of males is the reference category). • Probability of ‘time spent on Instagram in category IP4’ is 3.724 times less than the probability of
‘time spent on Instagram in category IP1’ for females (the level of males is the reference category). Age: Time spent on Instagram by university students is statistically significant for all levels (p < 0.05).
• Probability of ‘time spent on Instagram in category IP2’ is 3.980 times less than the probability of ‘time spent on Instagram in category IP1’ for the age group of 21–22 years (23 years and above is the reference category).
• Probability of ‘time spent on Instagram in category IP3’ is 2.638 times less than the probability of ‘time spent on Instagram in category IP1’ for the age group of 21–22 years (23 years and above is the reference category).
• Probability of ‘time spent on Instagram in category IP4’ is 2.818 times less than the probability of ‘time spent on Instagram in category IP1’ for the age group of 21–22 years (23 years and above is the reference category).
• Probability of ‘time spent on Instagram in category IP5’ is 3.024 times less than the probability of ‘time spent on Instagram in category IP1’ for the age group of 21–22 years (23 years and above is the reference category).
4. Discussion and conclusions
This research is conducted to find the different results for different discussions regarding the time spent on Instagram. The primary purpose of this research is to determine whether there is a correlation between social media addiction and life satisfaction. The second purpose is to reveal whether university students’ social media addiction or level of life satisfaction differs by the time that they spend on Instagram. The third purpose is to explain the model where the time spent on Instagram is predicted by gender, age and social media addiction.
First of all, an analysis is made to see whether there is a correlation between social media addiction and life satisfaction. At the end of this analysis, a weak negative correlation is found between social
effect rate is less effective due to the weak correlation. In some studies, it is concluded that there is a negative correlation between social media addiction and life satisfaction (Sahin, 2017; Wilczek, 2018). In the study of Sahin (2017), another study conducted with a university sample concluded that there is a negative and moderate correlation between life satisfaction and social media addiction. Wilczek (2018) revealed in his study on media platforms that radio and television have no effect on life satisfaction whilst social networks are effective. In another study, it is concluded that life satisfaction has significant effects on both general Internet dependency and social media addiction (Longstreet et al., 2017). The findings of the study do not show parallelism with some studies in the literature. Campisi et al. (2015) revealed in their study that the frequency of using social networks is not correlated with the quality of life. In the study conducted by Hawi and Samaha (2017), it is revealed that the effect of using social media leads to dependency, and it has a positive correlation with life satisfaction. It is considered that the differences in the findings of studies may originate from the selection of samples and the assessment devices used.
Then, an analysis is made to see whether social media addiction and life satisfaction levels of university students differ depending on the time that they spend on Instagram. Consequently, it is found that social media addiction differs to the degree of the time that they spend on Instagram. In some previous studies, it is also revealed that social media addiction is correlated with the time spent on social media (Kircaburun & Griffiths, 2018). An important conclusion of a study by Muhammad (2018) is that the social media may affect particularly the Instagram users positively and negatively. The positive effect is that people interconnection is increasing compared to the past. Its negative effects may be harmful leading to anxiety and depression.
Finally, an analysis is made as to whether the time spent on Instagram is predicted by gender, age and social media addiction or not. Time spend on Instagram is analysed in accordance with multinomial logistic regression in five categories. The time spent on Instagram in Category IP1 is taken as the reference variable.
• In the order of priorities, the variables in category IP2 such as constant (β = −3.239; Wald = 0.842:
p < 0.05), age group of 21–22 (β = 1.381; Wald = 0.472: p < 0.05); females (β = 0.866; Wald = 0.389: p < 0.05) and social media addiction (β = 0.947; Wald = 0.294: p < 0.05) affect the time spent by
university students on Instagram.
• In the order of priorities, the variables in category IP3 such as constant (β = −4.283; Wald = 0.842:
p < 0.05), age group of 21–22 years (β = 0.970; Wald = 0.472: p < 0.05); females (β = 0.994; Wald =
0.389: p < 0.05) and social media addiction (β = 1.566; Wald = 0.294: p < 0.05) affect the time spent by university students on Instagram.
• In the order of priorities, the variables in category IP4 such as constant (β = −6.992; Wald = 0.842:
p < 0.05), age group of 21–22 years (β = 1.036; Wald = 0.472: p < 0.05); females (β = 1.315; Wald =
0.389: p < 0.05) and social media addiction (β = 2.181; Wald = 0.294: p < 0.05) affect the time spent by university students on Instagram.
• In the order of priorities, the variables in category IP5 such as constant (β = −8.396; Wald = 0.842:
p < 0.05), age group of 21–22 years (β = 1.107; Wald = 0.472: p < 0.05) and social media addiction
(β = 2.862; Wald = 0.294: p < 0.05) affect the time spent by university students on Instagram. Numerous research works are found on the time spent on Internet in the literature search. Time spend on Instagram is examined in terms of different variables such as gender, social media addiction and age. According to the previous research, gender, professional education background and the level of dependency on Instagram have an impact on the time spent on Instagram (Huang & Su, 2018). Penni (2017) also found that the variables of age and gender are predictive variables for social media addiction. In a study conducted to determine the correlation between time spent on social media and gender, it is found that females spend more time on social media and have a higher risk of dependency (Thelwall & Vis, 2017). Similarly, in a sectional study conducted in Taiwan, it is found that the time spend on Instagram varies by gender (Huang & Su, 2018). Females and males are affected by social media applications in different ways (Yurdagul, Kircaburun, Emirtekin, Wang & Griffiths, 2019).
It attracts attention that males are more risk in terms of technological dependencies such as Internet and game dependency (Ayas, 2012; Bozkurt, Sahin & Zoroglu, 2016; Kuss, Griffiths & Pontes, 2017; Yesilyurt & Erdogan, n.d.). However, it is a bit different when we consider social media addiction. This study reveals that females are more risk than males with respect to the time spent on Instagram.
In the conclusion of statistical analyses, it is found that the variable that predicts the time spent on Instagram the most is gender, and it is followed by age and social media addiction. The findings obtained in the literature search coincide with the results of the present research. It is considered that the present research will contribute to future studies to be conducted on the impact of life satisfaction, gender and social media addiction on the time spent on Instagram. However, the study has some limitations. The first limitation is that the sample is not selected from amongst the people who have clinically diagnosed with social media addiction. The studies conducted with people who are clinically diagnosed with social media addiction may provide more information about the model. The second limitation of the study is that the sample is only composed of the university students who study in Istanbul Province. Therefore, it is recommended to select different samples in the future studies. As females constitute a riskier group with respect to social media and Instagram dependency, it is recommended that future research works should be made with samples composed of females. Research works can be made on different variables that predict the time spent on Instagram. It is recommended to test the correlation between social media addiction and life satisfaction with a larger sample.
References
Andreassen, C. & Pallesen, S. (2014). Social network site addiction—an overview. Current Pharmaceutical Design, 20(25). doi:10.2174/13816128113199990616
Ayas, T. (2012). Lise Ogrencilerinin Internet ve Bilgisayar Oyun Bagimlilik Duzeylerinin Utangaclikla Iliskisi. Kuram ve Uygulamada Egitim Bilimleri, 12(2), 527–636.
Bilgin, O. & Tas, I. (2018). Effects of perceived social support and psychological resilience on social media addiction among university students. Universal Journal of Educational Research, 6(4), 751–758. doi:10.13189/ujer.2018.060418
Boyd, D. M. & Ellison, N. B. (2007). Social network sites: Definition, history, and scholarship. Journal of Computer-Mediated Communication. doi:10.1111/j.1083-6101.2007.00393.x
Bozkurt, H., Sahin, S. & Zoroglu, S. (2016). Internet Bagimliligi: Guncel Bir Gozden Gecirme. Journal of Contemporary Medicine, 6(3). doi:10.16899/ctd.66303
Bozoglan, B., Demirer, V. & Sahin, I. (2013). Loneliness, self-esteem, and life satisfaction as predictors of Internet addiction: a cross-sectional study among Turkish university students. Scandinavian Journal of Psychology, 54(4), 313–319. doi:10.1111/sjop.12049
Campisi, J., Folan, D., Diehl, G., Kable, T. & Rademeyer, C. (2015). Social media users have different experiences, motivations, and quality of life. Psychiatry Research, 228(3). doi:10.1016/j.psychres.2015.04.042
Deniz, M., Avsaroglu, S., Deniz, M. E. & Bek, H. (2010). Motional intelligence and life satisfaction of teachers working at private special education institutions. Procedia—Social and Behavioral Sciences, 2, 2300–2304. doi:10.1016/j.sbspro.2010.03.325
Diener, E., Emmons, R. A., Larsem, R. J. & Griffin, S. (1985). The Life Satisfaction. Journal of Personality Assessment, 49(1), 71–75. https://doi.org/10.1207/s15327752jpa4901_13
Fraenkel, J. R., Wallen, N. E. & Hyun, H. H. (2012). How to design and evaluate research in education (8th ed.). Climate change 2013—the physical science basis.
Frison, E. & Eggermont, S. (2017). Browsing, posting, and liking on Instagram: the reciprocal relationships between different types of Instagram use and adolescents’ depressed mood. Cyberpsychology, Behavior, and Social Networking, 20(10). doi:10.1089/cyber.2017.0156
Hou, Y., Xiong, D., Jiang, T., Song, L. & Wang, Q. (2019). Social media addiction: Its impact, mediation, and intervention. Cyberpsychology, 13(1). doi:10.5817/CP2019-1-4
Huang, Y. T. & Su, S. F. (2018). Motives for instagram use and topics of interest among young adults. Future Internet, 10(8). doi:10.3390/fi10080077
Hwang, H. S. & Cho, J. (2018). Why instagram? Intention to continue using instagram among Korean college students. Social Behavior and Personality, 46(8), 1305–1315. doi:10.2224/SBP.6961
İnstagram istatistikleri. (2019a). Retrieved from https://www.statista.com/topics/1164/social-networks/ İnstagram istatistikleri. (2019b). Retrieved from
https://www.brandingturkiye.com/instagram-istatistikleri-guncel/
Jeri-Yabar, A., Sanchez-Carbonel, A., Tito, K., Ramirez-delCastillo, J., Torres-Alcantara, A., Denegri, D. & Carreazo, Y. (2019). Association between social media use (Twitter, Instagram, Facebook) and depressive symptoms: are Twitter users at higher risk? International Journal of Social Psychiatry, 65(1). doi:10.1177/0020764018814270
Kircaburun, K. & Griffiths, M. D. (2018). Instagram addiction and the Big Five of personality: the mediating role of self-liking. Journal of Behavioral Addictions, 7(1). doi:10.1556/2006.7.2018.15
Kuss, D. J. & Griffiths, M. D. (2017). Social networking sites and addiction: ten lessons learned. International Journal of Environmental Research and Public Health. doi:10.3390/ijerph14030311
Kuss, D. J., Griffiths, M. D. & Pontes, H. M. (2017). DSM-5 diagnosis of Internet Gaming disorder: Some ways forward in overcoming issues and concerns in the Gaming studies field: Response to the commentaries. Journal of Behavioral Addictions. doi:10.1556/2006.6.2017.032
Longstreet, P., Brooks, S., Bozoglan, B., Demirer, V., Sahin, I., Kwak, C., … Samaha, M. (2017). Instagram effects as social media toward adolescence and young adult users: uses and gratification approach. Logistic Regression: Concept and Application. (English), 10(59), 1250–1262. doi:10.2991/iccsr-18.2018.44
Mackson, S. B., Brochu, P. M. & Schneider, B. A. (2019). Instagram: Friend or foe? The application’s association with psychological well-being. New Media and Society, 21(10). doi:10.1177/1461444819840021
Nunnally, J. C. (1978). Psychometric theory (2nd ed.). New York, NY: McGraw-Hill.
Penni, J. (2017). The future of online social networks (OSN): a measurement analysis using social media tools and application. Telematics and Informatics. doi:10.1016/j.tele.2016.10.009
Sahin, C. (2017). The predictive level of social media addiction for life satisfaction: a study on university students. Turkish Online Journal of Educational Technology, 16(4).
Savci, M. & Aysan, F. (2017). Technological addictions and social connectedness: predictor effect of internet addiction, social media addiction, digital game addiction and smartphone addiction on social connectedness. Dusunen Adam: The Journal of Psychiatry and Neurological Sciences, 30(3), 202–216. doi:10.5350/DAJPN2017300304
Shane-Simpson, C., Manago, A., Gaggi, N. & Gillespie-Lynch, K. (2018). Why do college students prefer Facebook, Twitter, or Instagram? Site affordances, tensions between privacy and self-expression, and implications for social capital. Computers in Human Behavior, 86. doi:10.1016/j.chb.2018.04.041
Sheldon, P., Rauschnabel, P. A., Antony, M. G. & Car, S. (2017). A cross-cultural comparison of Croatian and American social network sites: exploring cultural differences in motives for Instagram use. Computers in Human Behavior, 75. doi:10.1016/j.chb.2017.06.009
Simsek, A., Elciyar, K. & Kizilhan, T. (2019). A comparative study on social media addiction of high school and university students. Contemporary Educational Technology, 10(2). doi:10.30935/cet.554452
Thelwall, M. & Vis, F. (2017). Gender and image sharing on Facebook, Twitter, Instagram, Snapchat and WhatsApp in the UK: Hobbying alone or filtering for friends? Aslib Journal of Information Management, 69(6). doi:10.1108/AJIM-04-2017-0098
Wilczek, B. (2018). Media use and life satisfaction: the moderating role of social events. International Review of Economics, 65(2). doi:10.1007/s12232-017-0290-7
Ye, Z., Hashim, N. H., Baghirov, F. & Murphy, J. (2018). Gender differences in Instagram Hashtag use. Journal of Hospitality Marketing and Management, 27(4). doi:10.1080/19368623.2018.1382415
Yesilyurt, F. & Erdogan, I. (n.d.). Ergenlerin Oynadıklari Cevrim Ici Oyunların Cinsiyet, Sinif Duzeyi ve Ders Basarisina Gore Incelenmesi. HAYEF: Journal of Education, 15(2), 100–121. doi:10.26650/ hayef.2018.15.2.0010
Yurdagul, C., Kircaburun, K., Emirtekin, E., Wang, P. & Griffiths, M. D. (2019). Psychopathological consequences related to problematic Instagram use among adolescents: the mediating role of body image dissatisfaction and moderating role of gender. International Journal of Mental Health and Addiction. doi:10.1007/s11469-019-00071-8
Zhan, L., Sun, Y., Wang, N. & Zhang, X. (2016). Understanding the influence of social media on people’s life satisfaction through two competing explanatory mechanisms. Aslib Journal of Information Management, 68(3). doi:10.1108/AJIM-12-2015-0195