ANALYSIS OF LSAMP GENE AS A TUMOR SUPPRESSOR IN
NEUROBLASTOMA
A THESIS SUBMITTED TO
THE DEPARTMENT OF MOLECULAR BIOLOGY AND GENETICS AND THE INSTITUTE OF ENGINEERING AND SCIENCE OF
BILKENT UNIVERSITY
IN PARTIAL FULFILLMENT OF THE REQUIREMENTS FOR THE DEGREE OF
MASTER OF SCIENCE
BY
ATIL ÇAĞDAŞ SAYDERE DECEMBER 2009
i
SIGNATURE PAGE
I certify that I have read this thesis and that in my opinion it is fully adequate, in scope and in quality, as a thesis for the degree of Master of Science.
____________________________ Assist. Prof. M. Cengiz Yakıcıer
I certify that I have read this thesis and that in my opinion it is fully adequate, in scope and in quality, as a thesis for the degree of Master of Science.
____________________________ Assist. Prof. Özlen Konu
I certify that I have read this thesis and that in my opinion it is fully adequate, in scope and in quality, as a thesis for the degree of Master of Science.
____________________________ Assoc. Prof. Hilal Özdağ
Approved for the Institute of Engineering and Science
____________________________ Prof. Dr. Mehmet Baray Director of Institute of Engineering and Science
ii
ABSTRACT
ANALYSIS OF LSAMP GENE AS A TUMOR SUPPRESSOR IN NEUROBLASTOMA
ATIL ÇAĞDAŞ SAYDERE M.Sc. in Molecular Biology and Genetics Supervisor: Assist. Prof. M. Cengiz Yakıcıer
December 2009, 59 pages
Neuroblastoma constitutes approximately 10 % of all childhood tumors with a worldwide considerable morbidity and mortality. Frequently, in children under the age of 1, it can spontaneously regress and transform into a benign tumor. However, in children older than age of 1 the disease often behaves aggressively and metastasizes to other organs. This unpredictable behavior of unknown origin makes therapeutic applications ineffective.
Limbic system associated membrane protein gene (LSAMP) functions in neurite growth, axonal guidance and acts as a cell adhesion and recognition molecule. Recent studies revealed its association to several cancer types and proposed a potential tumor suppressor role. Markers in the LSAMP gene region were also shown to be homozygously deleted in neuroblastoma. In the framework of this study, we investigated LSAMP gene in respect of its potential tumor suppressor role in neuroblastoma. 6 clinical patient samples and 2 neuroblastoma cell lines were studied via PCR methodology to detect any loss in LSAMP gene. Immunohistochemistry (IHC) was applied to 6 neuroblastoma tissue sections to determine protein level changes of LSAMP. Moreover, expression analysis in a set of brain tumors was performed. As a result of these efforts, one possible LOH and one homozygous deletion in two different patients were observed. Low levels of LSAMP protein in all of the tumor samples compared to controls were recorded.
iii
Downregulation of LSAMP in brain tumors was detected. Based on these results,
LSAMP is suggested as a candidate tumor suppressor in neuroblastoma and in
iv
ÖZET
LSAMP GENĐNĐN NÖROBLASTOMALARDA TÜMÖR BASKILAYICI OLARAK ANALĐZĐ
ATIL ÇAĞDAŞ SAYDERE
Moleküler Biyoloji ve Genetik Bölümü Yüksek Lisansı Danışman: Assist. Prof. M. Cengiz Yakıcıer
Aralık 2009, 59 sayfa
Nöroblastoma dünya çapında önemli morbidite ve mortaliteye sahip olup tüm çocukluk çağı tümörlerinin yaklaşık %10’unu oluşturmaktadır. Sıklıkla, 1 yaş altındaki çocuklarda, kendiliğinden gerileyerek ve iyi huylu bir tümör haline dönüşmektedir. Ancak, 1 yaş üzeri çocuklarda genellikle agresif davranır ve diğer organlara metastaz olur. Kaynağı bilinmeyen bu beklenmedik davranış tedavi uygulamalarını etkisiz hale getirir.
Kromozom bölgesi 3q13.3 üzerinde bulunan limbik sistem ilişkili membran proteini geni (LSAMP) sinir hücrelerinin büyümesinde ve akson rehberliğinde görevlidir. Ayrıca, bir adezyon ve hücreler arası tanıma molekülü gibi davranır. Son yıllarda yapılan çalışmalarda çeşitli kanser türleriyle ilişkisi gösterilmiş ve potansiyel bir tümör baskılayıcı rolü önerilmiştir.Ayrıca LSAMP geni bölgesindeki markörlerin homozigot kayıplara uğradığı gösterilmiştir. Bu çalışma çerçevesinde, LSAMP geninin nöroblastomada olası bir tümör baskılayıcı rolü araştırıldı. 6 klinik hasta numunesi ve 2 nöroblastoma hücre hattı PCR yöntemi ile LSAMP gen kaybını ortaya çıkarmak için çalışıldı. 6 nöroblastoma doku kesitinde LSAMP protein düzeyindeki değişiklikleri belirlemek için immunohistokimya (ĐHK) uygulandı. Bir grup beyin tümöründe ifade analizi yapıldı. Đki farklı hastada bu çabalar, olası bir LOH ve bir homozigot kayıp sonuçları olarak gözlemlendi. Kontrol grubuna göre tüm tümör örneklerinde LSAMP proteinin düşük seviyeleri kaydedildi. Beyin tümörlerinde
v
LSAMP ifadesinde azalma belirlendi.Bu sonuçlara dayanarak, LSAMP tümör
baskılayıcı adayı olarak nöroblastomada ve daha geniş anlamda sinir sistemi tümörlerinde önerilmektedir.
vi
Aileme…
vii
ACKNOWLEDGEMENTS:
First of all, I am indebted to my supervisor Assist.Prof. M. Cengiz Yakıcıer for his continuous support and patience during my studies. I am grateful to him for providing me the opportunity to work with him. Without his invaluable suggestions, scientific knowledge and personal guidance this study would not be completed.
I would like to thank Tolga Acun for his friendship and everything he helped me in. My studies would not be the same without his support.
I would like to thank Assoc. Prof. Dr.Aylin Okçu Heper (Ankara University) and Assoc.Prof. Dr.Hasan Uğur Çağlar (Ankara University) for providing us precious neuroblastoma and brain tumor samples used in this study.
I am grateful to Assoc. Prof. Dr. Emin Öztaş (GMMA) for his experimental support in IHC.
I want to thank Öztürk lab. for their equipment supports during my study. I also want to thank Şerif Şentürk for his friendship and help in my study.
I am thankful to members of “Molecular Genetics Lab.” for the friendly and warm atmosphere they created.
I would like to thank all of my friends in the department whose existence have always supported me during my undergraduate and graduate years especially Tamer Kahraman, Fatih Semerci, Muammer Üçal, Sinan Gültekin, Onur Kaya, Raşit Öztürk, Gurbet Karahanlı and Nilüfer Sayar. I won’t forget our conversations, trips, coffee breaks, and the good memories in which we were together.
I would like to thank Đbrahim Fırat Taş for his friendship and for being or “not being” such a good roommate in the dorm.
viii
I am grateful to Emre Kul, Deniz Ashan Madencioğlu and Ceren Özgün for their warm friendship and relaxing conversations in my stressful times.
I want to express my greatest feelings for A. Necat Kırkıl, Z. Özgün Ocak, Ozan Ö. Dolu, Akif Boynueğri, Ozan Kamiloğlu, Tayyar Toygar Kerman and the first floor of dorm 72. When a man lies he murders some part of the world, but I know our friendship won’t be there. It is hard to forget things we have been through together in all those years. Thank you all for being at my side in my saddest and happiest times.
I am thankful to Derya Dönertaş for her unconditional support and patiently encouraging me all the time. I thank you with all my heart for being always next to me.
I would like to thank my brother Barış Saydere for his presence, sharing my life and creating a second home in Bilkent.
Last but not least, I cannot express my feelings for my father Taner Saydere and my mother Behiye Saydere who are my greatest luck in my life. Thank you for your unconditional love, everything you have done for me in every step of my life and always encouraging me not to give up. I dedicate this thesis to you.
ix
Table of Contents
SIGNATURE PAGE ... I ABSTRACT ... II ÖZET ... IV ACKNOWLEDGEMENTS: ... VII TABLE OF CONTENTS ... IX TABLE OF FIGURES: ... XILIST OF TABLES: ... XII
ABBREVIATIONS ... XIII
1 INTRODUCTION ... 1
1.1 EPIDEMIOLOGY ... 1
1.2 PATHOGENESIS AND AETIOLOGY ... 2
1.2.1 Pathogenesis ... 2
1.2.2 Aetiology ... 4
1.3 GENETIC ABERRATIONS IN NEUROBLASTOMA ... 4
1.3.1 Genomic Gains:... 5
1.3.2 Genetic Deletions and Allelic Losses: ... 7
1.3.3 Abnormal Expression of Neurotrophin Receptors: ... 10
1.4 LSAMP GENE: ... 11
2 AIM: ... 16
3 MATERIALS AND METHODS: ... 17
3.1 MATERIALS: ... 17
3.1.1 Chemical Solutions and Reagents: ... 17
3.1.2 PCR Primers and Conditions: ... 18
3.1.3 Tumor Samples: ... 20
3.1.4 Cell Culture: ... 22
3.2 METHODS: ... 23
3.2.1 The cDNA Synthesis: ... 23
3.2.2 Multiplex PCR Reaction: ... 24
x
3.2.4 Quantitative RT-PCR Reaction: ... 27
3.2.5 Agarose Gel Electrophoresis ... 29
3.2.6 Thawing and Culturing Cell Lines ... 29
3.2.7 Growth and Passaging of Cell Lines ... 30
3.2.8 Pelleting and Collecting Cells ... 30
3.2.9 Genomic DNA Isolation ... 31
3.2.10 Immunohistochemical Analysis of LSAMP Protein ... 31
3.2.11 DNA extraction from Paraffin Embedded Tissues ... 32
4 RESULTS: ... 33
4.1 GENETIC ANALYSIS OF LSAMPGENE REGION IN TUMORS AND CELL LINES: ... 33
4.1.1 Homozygous Deletion of LSAMP Gene: ... 33
4.1.2 LOH at LSAMP Genomic Region: ... 34
4.2 ASSESSMENT OF LSAMPPROTEIN IN NEUROBLASTOMA TISSUES: ... 35
4.3 ANALYSIS OF LSAMPEXPRESSION IN BRAIN TUMORS:... 37
4.3.1 Semi Quantitative PCR Results: ... 37
4.3.2 Q-RT-PCR Detection of LSAMP Expression in Brain Tumors: ... 39
5 DISCUSSION: ... 44
6 FUTURE PERSPECTIVES: ... 49
xi
Table of Figures:
Figure 1: The lineages derived from neural crest and the origin of neuroblastoma. ... 3
Figure 2: MYCN amplification pattern ... 6
Figure 3: Schematic presentation of genetic alterations in neuroblastoma and classification into different types ... 11
Figure 4: Location of LSAMP gene in long arm of chromosome 3. ... 12
Figure 5: Expression of LSAMP in different tissues (Data from Genomics Institute of the Novartis Research Foundation) ... 13
Figure 6: Homozygous deletion of LSAMP region in patient #28231 is shown ... 34
Figure 7: Possible LOH in LSAMP locus of patient sample #12116 is shown ... 35
Figure 8: LSAMP protein levels in neuroblastoma tissues revealed by IHC ... 37
Figure 9: LSAMP and GAPDH expression levels of the same glioblastoma samples. ... 38
Figure 10: LSAMP expression in brain tumors. ... 39
Figure 11: Expression differences in brain tumors relative to normal brain tissue. .. 43
xii
List of Tables:
Table 1: Proven or speculated chromosomal loci involved in neuroblastoma
tumorigenesis ... 9
Table 2: Primers Used in PCR reactions ... 19
Table 3: List of neuroblastoma tumor samples and tissue sections used in this study, two samples from each patient were provided ... 21
Table 4: List of brain tumors of different types and grades used in this study ... 22
Table 5: MP-PCR master mix reagents and concentrations... 24
Table 6: MP-PCR Reaction conditions ... 25
Table 7: Semi-Q-PCR master mix reagents and concentrations ... 26
Table 8: Semi-Q-PCR Reaction conditions ... 26
Table 9: Q-RT-PCR reaction mixture for LSAMP gene ... 28
Table 10: Q-RT-PCR reaction mixture for beta-actin (ACTB) reference gene ... 28
Table 11: Reaction setup in quantitative RT-PCR experiments ... 29
Table 12: The relative expression levels of LSAMP and GAPDH in different types and grades of brain tumors revealed by semi quantitative PCR ... 41
Table 13: Quantitative RT-PCR results of LSAMP in brain tumors ... 42
Table 14: Multiplex-PCR analysis of LSAMP in neuroblastoma tissues showing possible deletions ... 45
xiii
ABBREVIATIONS
ACTB: B-actin
bp: Base Pair
cDNA : Complementary DNA
CGH: Comparative Genomic Hybridization
∆H2O: Double Distilled Water
DM: Double Minutes
DNA: Deoxyribonucleicacid
dNTP: Deoxyribonucleotide Triphosphate
EtBr: Ethidium Bromide
EDTA: Ethylenediaminetetraacetic acid
FBS: Fetal Bovine Serum
FISH: Fluorescent in situ Hybridization
g: Gram
GAPDH: Glyceraldehyde-3-Phosphate Dehydrogenase
HCC: Hepatocellular carcinoma
HSR: Homogenously Staining Regions
IHC: Immunohistochemistry
LOH: Loss of Heterozygosity
LSAMP: Limbic System Associated Membrane Protein
min: Minute
ml: Mililiter
mM: Milimolar
MP-PCR: Multiplex PCR
mRNA: Messenger RNA
MYCN: v-myc Avian Myelocytomatosis Viral Related Oncogene, Neuroblastoma Derived
NaCl: Sodium Chloride
PBS: Phosphate Buffered Saline
xiv
pm: Picomole
Q-RT-PCR: Quantitative Real Time PCR
RNA: Ribo Nucleic Acid
Rpm: Revolutions Per Minute
Sec : Second
TAE: Tris Acetate EDTA Buffer
Tris: Tris (Hydroxymethyl)-Methylamine
UV: Ultraviolet
w/v: Weight/Volume
µg: Microgram
µl: Microliter
1
1
INTRODUCTION
Neuroblastoma was first identified and characterized as a tumor by Virchow in 1864 and by Marchand in 1891, respectively (Hayes PA, 1989; Voute PA, 1984). Since their identification, the tumor has succeeded to stimulate interests of the researchers by its distinct characteristics. The neuroblastoma tumor tissues either regress spontaneously as observed especially in infants or they mature into benign tumors called ganglioneuroma (Brodeur and Castleberry, 1993). However, it is almost impossible to predict the behavior and most children over 1 year of age already have tumor metastasized into other organs at the time of diagnosis (Brodeur, 2003). The heterogeneous behavior of the disease prevented comprehensive clinical studies and resulted in poor prognosis until studying the tumor with the tools of molecular genetics and biochemistry.
1.1
Epidemiology
Neuroblastoma is the most common extracranial solid tumor seen in pediatric population. It accounts for 8-10 % among all childhood cancers and it is the most common diagnosed cancer type for infants (Gurney et al., 1997). Neuroblastoma is diagnosed in United States and Canada one case in 7000 live births per year and approximately 700 new cases per year are observed (Brodeur and Castleberry, 1993). In Europe compared to USA and Canada more than two times higher, 1500 cases occur per year (Gao et al., 1997; Spix et al., 2006). Among all cancers diagnosed in European and USA infants, neuroblastoma accounts for about 28% (Gurney et al., 1997; Spix et al., 2006). Almost the same incidence rate for the rest of the world according to reported cases are observed (Brodeur and Castleberry, 1993). The incidence has a peak before the age 1 and the median age of the patients diagnosed with neuroblastoma is 18 months (Brodeur and Castleberry, 1993; Heck et al., 2009).
2
There is an equivalent or slightly higher prevalence of the disease in boys than girls in most countries. There is no difference between the ethnic groups for the incidence of the disease (Gao et al., 1997; Ries et al., 2005; Spix et al., 2006).
1.2
Pathogenesis and Aetiology
1.2.1
Pathogenesis
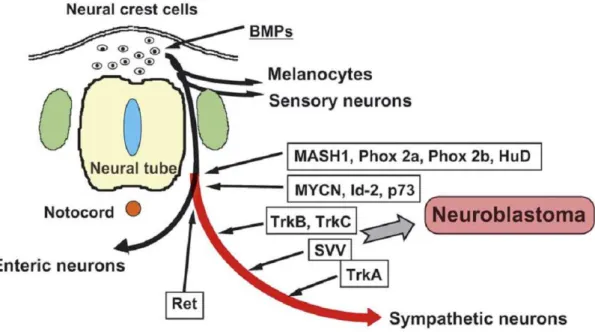
Neuroblastoma is a malignant tumor originating from the neural crest cells which arise in the third to fourth week of embryonic development. Some pluripotent cells or neuroblasts of this layer can form the components of the sympathetic nervous system by differentiating into sub populations (Fig.1). These cells invaginate and migrate along the neuraxis and accumulate in sympathetic ganglia, adrenal medulla and different sites of the bone and soft tissue (Gray H, 2005). The distribution of these cells into the sub regions of the sympathetic system correlates with the primary diagnosis sites of the neuroblastoma. In most cases, approximately 40%, the origin side of the tumor is one of the adrenal glands or in other cases it is observed in the chest, abdomen and pelvic (Gao et al., 1997; Ries et al., 2005).
Among other known human malignancies, neuroblastoma distinguishes itself by an enigmatic behavior in which some cells undergo a spontaneous regression from a malign state to a benign state while others persistently progress (Brodeur and Maris, 2006) . The tumor may undergo differentiation and/or apoptosis in patients under 1 year of age in contrast with patients older than 1 year of age where it shows an aggressive behavior and leads to death (Brodeur, 2003; Nakagawara, 1998).
3
Figure 1: The lineages derived from neural crest and the origin of neuroblastoma. (Nakagawara and Ohira, 2004)
In order to facilitate diagnosis and prognosis of the disease a classification system called Shimada System which classify patients into three risk groups; low, intermediate and high was created in 1984 (Shimada et al., 1984). It was used to determine the curability of the patient ; low risk and intermediate risk patients which usually comprise infants have a higher chance of cure compared to high risk group patients who have poor diagnosis and outcome (Maris, 2005). The majority of the patients older than 18 months have the disease metastasized to lymph nodes, liver, bone and bone marrow but despite the intensive therapies followed by autologous bone marrow transplant, more than half of the patients cannot survive (Spix et al., 2006)
The recent advances allowed the disease to be re-classified into different stages and risk groups by using factors like differentiation state, MYCN amplification, age, Schwannian stroma content and mitosis-karyorrhexis index at the time of diagnosis (Maris et al., 2007; Shimada et al., 1999). The efforts of International Neuroblastoma Risk Group (INRG) developed a classification system in modifying the previously used Schimada System. According to this classification schema the tumors are
4
categorized into three risk groups; low, intermediate and high and different stages of the disease is defined from 1 to 4 where 4 represents the metastasized tumor (Maris et al., 2007). One stage called 4s which is special for the patients younger than 1 year of age and seen nearly 5% of the patients is also described. In this case, the tumor is spread to liver, skin or bone marrow but show a spontaneous regression (D'Angio et al., 1971).
1.2.2
Aetiology
The sporadic occurrence of the disease makes it challenging to study and there is not much known about the aetiology of the disease but as a common reason in tumorigenesis environmental effects are thought to play a role for the development of the disease (Brodeur, 2003). Among these environmental factors, using medications like pain killers, exposure to electro-magnetic fields, the use of sex hormones and vitamins has been hypothesized for the aetiology of the disease (Carachi, 2002). In recent studies maternal alcohol consumption, paternal exposure to nonvolatile and volatile hydrocarbons, wood dusts and solders, use of diuretics and low birth weight are suggested to be positively associated with the disease (Heck et al., 2009).
1.3
Genetic Aberrations in Neuroblastoma
The molecular pathology of neuroblastoma is still poorly understood. However, common genetic alterations have been observed in patients diagnosed with neuroblastoma and these alterations are used for risk stratification. The best characterized genetic alterations include amplification of the proto-oncogene MYCN, gain of chromosome arm 17q and losses of 1p, 3p, and 11q. Based on these aberrations, neuroblastoma is classified into three genetic sub groups. Beside MYCN on chromosome arm 2p which was previously identified as an oncogene, further efforts are focused on identifying any candidate tumor suppressor genes or
5
oncogenes located within the regions of loss or gain, respectively. Until now, no new genes that drive neuroblastoma development and progression have been successfully characterized.
1.3.1
Genomic Gains:
1.3.1.1
Ploidy:
DNA content is an important prognostic marker for the neuroblastoma patients. Although in most cases tumors have diploid karyotypes, a distinct case for lower stage neuroblastoma patients exist as they may often have hyperdiploid or near triploid (Kaneko et al., 1987). Thus, during prognosis the karyotype analysis of neuroblastomas is performed to determine the ploidy status and having near-triploidy is more favorable for the patients associated with longer survival. However, it is more significant for infants compared to children older than 1 year of age. The reason behind is that less aggressive tumlors have a major defect in mitosis which results in whole chromosomal gains and losses where aggressive tumors additionally imperfect in genomic stability which ends in structural rearrangements (Brodeur, 2003; Look et al., 1984).
1.3.1.2
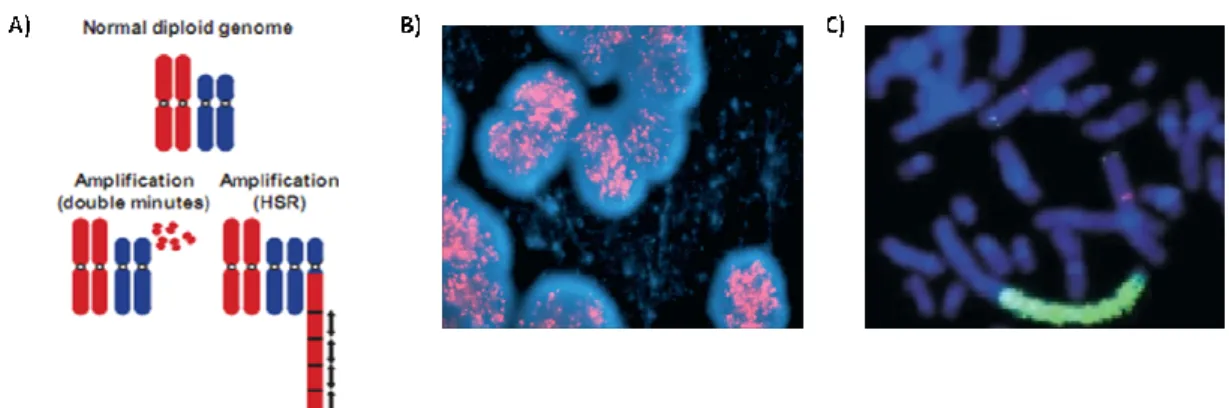
MYCN Genomic Amplification:
The well known associated marker of neuroblastoma is the genomic amplification of
MYCN which occurs in 20% of patients and strongly correlates with higher stages of
the disease and poor outcome (Brodeur and Seeger, 1986; Schwab et al., 2003; Shimada et al., 1999). MYCN gene is located on chromosome 2p24 locus and it was identified in neuroblastoma cell lines as an amplified DNA sequence homologous to proto-oncogene c-MYC. The amplified region that contains MYCN chromosome
6
2p24 locus form double minute chromosomes (DM) and they are integrated linearly to random chromosomes resulting in homogenously staining regions (HSR) that may contain copies up to 500 (Schwab et al., 1983) (Fig. 2). Rather than a mutation in this amplified region, it is suggested that overexpression of wild type MYCN leads to tumorigenesis as overexpressing MYCN in neural crest of transgenic mice can develop neuroblastomas and decreasing MYCN mRNA levels by using antisense
MYCN can induce differentiation of human neuroblastoma cell lines (Schmidt et al.,
1994; Weiss et al., 1997).
Figure 2: MYCN amplification pattern; A) Amplification patterns of double minutes (DM) and homogenously staining regions (HSR) are observed in solid tumors (Albertson et al., 2003) B) FISH image of MYCN amplification presented in DM (Maris et al., 2007) C) HSR for MYCN amplification in neuroblastoma cell line NGP (Schwab et al., 2003)
1.3.1.3
Gain of 17q:
Extra copies of chromosome arm 17q are observed in more than half of the neuroblastomas. The gain of 17q may occur independently but more often results from unbalanced translocation events with chromosome 1p or 11q and associated with poor outcome (Bown et al., 1999; Caron, 1995). The gene dosage effect of one or more genes in extra copies is thought to provide a selective advantage to cells resulting in aggressive phenotype (Lastowska et al., 2002). Although there is no exact site of breakpoint, the region of 17q22-qter has been suggested as carrying
7
genes that promotes cell survival (Van Roy et al., 1997). The most of the genes have not been identified yet but among the known genes overexpression of BIRC5 (survivin) which encodes an inhibitor of apoptosis proteins has been proposed for the reason of aggressive phenotype seen in gain of 17q (Islam et al., 2000). In some cases segmental gains of 1q, 5q and 18q are also observed but their characterizations still remain in question (Schwab et al., 2003).
1.3.2
Genetic Deletions and Allelic Losses:
1.3.2.1
Loss of 1p:
The most common loss of heterozygosity (LOH) seen in neuroblastoma patients is the loss of 1p which is seen about 30-35% of the cases (Brodeur, 2003). Deletions in chromosome region 1p correlate with the advanced stages of the disease and frequently associated with MYCN amplification and unbalanced translocation with 17q, t (1; 17) (Caron, 1995). Studies identified the smallest region that overlaps in tumors with loss of 1p as the locus 1p36 and loss of putative tumor suppressors in this region is thought to be responsible for disease progression (Caron et al., 2001). However, there is no consensus about the role of this locus independent of other factors as there are inconsistent data presented by different groups.
1.3.2.2
Loss of 11q:
Approximately 35% of the diagnosed neuroblastoma patients have deletions at chromosome region 11q. Translocations involving 11q21 and 11q22, deletion at 11q23, inversion at 11q21-11q23 and allelic losses are observed (Brodeur and Maris, 2006). In most of the cases allelic losses are reported and it is negatively correlated with MYCN amplification. Deletion in 11q is frequently found in neuroblastomas
8
without MYCN amplification (Guo et al., 1999; Plantaz et al., 2001). However, the loss at this region associates with the advanced stages of the disease and poor prognosis. The existence of tumor suppressor genes in this region is thought to be responsible for malignant progression upon inactivation by allelic losses in MYCN single copy neuroblastomas (van Noesel and Versteeg, 2004).
1.3.2.3
Losses at Other Chromosomes:
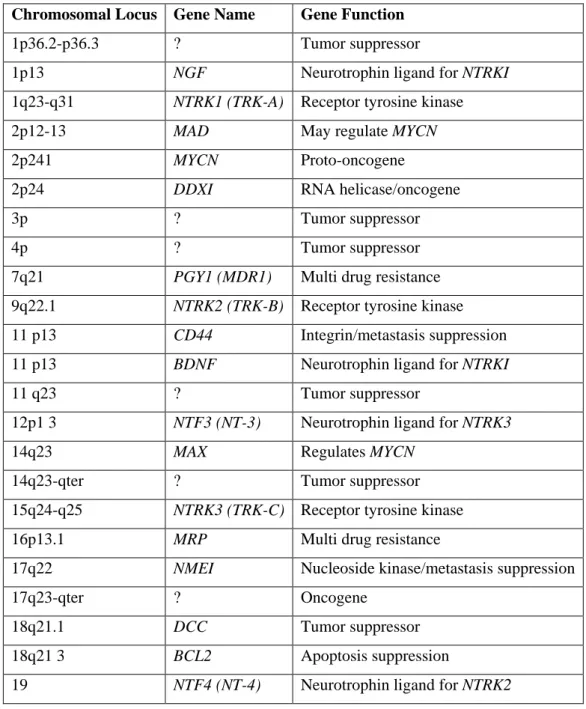
Beside chromosome regions 1p and 11q, allelic losses at chromosome arms 2q, 3p, 4p, 9p.12p, 14q, 15q, 16p and 19q are observed in lower frequencies. Several genes are identified in these regions as tumor suppressors or important regulators of cellular functions, but further investigation are needed for their prognostic significance (Table 1).
9
Chromosomal Locus Gene Name Gene Function
1p36.2-p36.3 ? Tumor suppressor
1p13 NGF Neurotrophin ligand for NTRKI 1q23-q31 NTRK1 (TRK-A) Receptor tyrosine kinase
2p12-13 MAD May regulate MYCN
2p241 MYCN Proto-oncogene
2p24 DDXI RNA helicase/oncogene
3p ? Tumor suppressor
4p ? Tumor suppressor
7q21 PGY1 (MDR1) Multi drug resistance 9q22.1 NTRK2 (TRK-B) Receptor tyrosine kinase
11 p13 CD44 Integrin/metastasis suppression 11 p13 BDNF Neurotrophin ligand for NTRKI
11 q23 ? Tumor suppressor
12p1 3 NTF3 (NT-3) Neurotrophin ligand for NTRK3
14q23 MAX Regulates MYCN
14q23-qter ? Tumor suppressor 15q24-q25 NTRK3 (TRK-C) Receptor tyrosine kinase
16p13.1 MRP Multi drug resistance
17q22 NMEI Nucleoside kinase/metastasis suppression
17q23-qter ? Oncogene
18q21.1 DCC Tumor suppressor 18q21 3 BCL2 Apoptosis suppression
19 NTF4 (NT-4) Neurotrophin ligand for NTRK2
Table 1: Proven or speculated chromosomal loci involved in neuroblastoma tumorigenesis (Maris and Matthay, 1999)
10
1.3.3
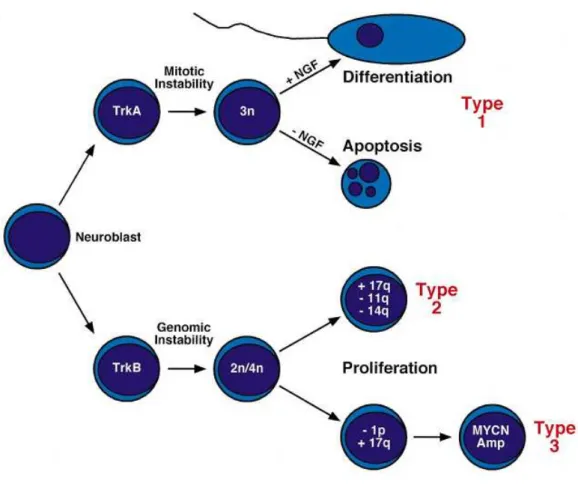
Abnormal Expression of Neurotrophin Receptors:
Neurotrophins are essential soluble factors needed during neural development and majorly include nerve growth factor (NGF), brain derived neurotrophic factor (BDNF), neurotrophin-3 (NT-3) and neurotrophin-4 (NT-4). Neuroblastomas as originating from neural crest have alterations in normal neural development pathway resulting in malignant transformation (Fig.3). However, in cases of spontaneous regression where the cells start to differentiate and apoptosis takes place, the recovery of neuronal development pathway occurs (Maris and Matthay, 1999). The signaling cascades are regulated through the Trk family of tyrosine kinases and
TRKA, TRKB and TRKC have been defined as key receptors in this pathway. Specific
receptor–ligand interactions occur; TRKA is the receptor for ligand NGF, TRKB serves for both BDNF and NT-4, and TRKC is the receptor for NT-3 (Nakagawara and Brodeur, 1997). The expression of TRKA is highly associated with favorable tumors and spontaneous regression where expression of TRKB is usually observed in aggressive tumors. The TRKB/BDNF signaling promotes cell survival enhancing angiogenesis and drug resistance. TRKC is also found expressed in lower stage tumors and is not expressed in MYCN amplified tumors (Matsumoto et al., 1995; Nakagawara, 1998).
11
Figure 3: Schematic presentation of genetic alterations in neuroblastoma and classification into different types (Maris and Matthay, 1999)
1.4
LSAMP gene:
LSAMP (Limbic System Associated Membrane Protein) encodes a neuronal surface
glycoprotein protein and belongs to a family of genes called IgLON consisting of
LSAMP (LAMP), OPCML/OBCAM (Opioid Binding Protein/Cell Adhesion
Molecule Like), NTM (Neurotrimin) and NEGR1/KILON (Neuronal Growth Regulator 1) (Funatsu et al., 1999; Pimenta et al., 1995). The IgLONs are identified as immunoglobulin subfamily of glycosylphosphatidylinositol-anchored cell adhesion molecules. The expressions of these genes are distributed in cortical and subcortical regions of the limbic system (Levitt, 1984; Struyk et al., 1995). During nervous system development, specific connections between neuronal cell populations
12
must be established correctly for proper growth and the axonal targeting molecules play a major role during this process. LSAMP together with other IgLONs is highly conserved among higher organisms and it mediates neuronal growth and axon targeting as well as acting in cell-cell recognition and cell adhesion (Zhukareva and Levitt, 1995).
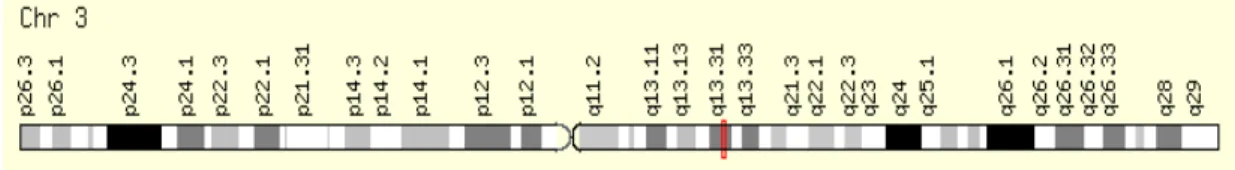
LSAMP is located on chromosome 3q13.31-q21 locus in the human genome (Fig.4)
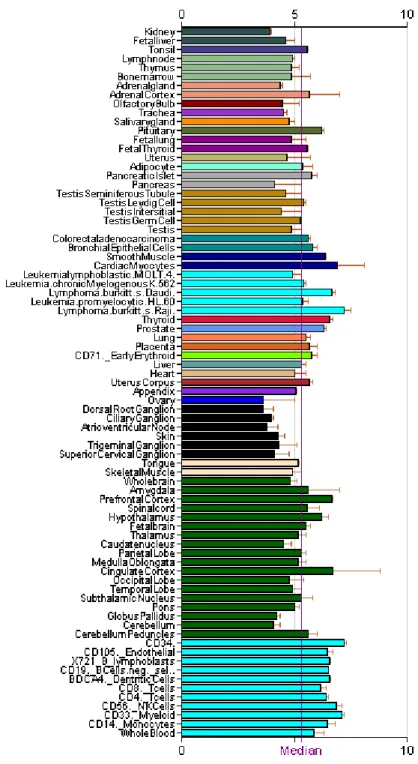
(Pimenta et al., 1998). It has seven exons with six alternative forms identified recently and encodes a plasma membrane protein with three Ig-like C2 type (immunoglobulin-like) domains and one glycosylphosphatidylinositol anchor. Microarray data reveal that LSAMP is highly expressed in cortical and subcortical regions of limbic system as well as tissues of parasympathetic and sympathetic nervous system (Fig.5). Markers in this region were also shown to be homozygously deleted in neuroblastoma cell lines (Caren et al., 2008).
13
Figure 5: Expression of LSAMP in different tissues (Data from Genomics Institute of the Novartis Research Foundation)
14
Until recently, there was not any data associating LSAMP to cancer and suggesting it as a tumor suppressor gene. However, low expression and polymorphism of LSAMP was found to be associated with behavioral disorders like hyperactivation, anxiety and panic in studies done with mice (Catania et al., 2008; Koido et al., 2006; Maron et al., 2006). Moreover, a study by Must et al. (2008) correlated LSAMP polymorphism to completed male suicide (Must et al., 2008). Wang. et al. (2008) proposed that genetic variations in LSAMP are associated with left main coronary artery disease (Wang et al., 2008)
The first hypothesis for LSAMP to be a tumor suppressor gene came from the study of Chen et al. (2003) in familial clear cell renal cell carcinoma (CCRCC) (Chen et al., 2003). A translocation, t (1; 3), involving NORE1 and LSAMP as breakpoint spanning genes was identified in CCRCC. Although no mutation was observed for
LSAMP, the promoter of LSAMP was found as hypermethylated and silenced in
CCRCC cell lines. Moreover, LSAMP was also found to be methylated in 26 % of colorectal cancers by additional experiments. In several tumors independent of methylation status loss of heterozygosity (LOH) of LSAMP was observed. Increasing expression of LSAMP in samples where it is methylated, had an inhibitory effect on cell proliferation which supported the hypothesis of LSAMP as a candidate tumor suppressor gene in CCRCCs (Chen et al., 2003).
In a broad study investigating the status of IgLON family genes in epithelial ovarian cancer, LSAMP was shown to be a potential tumor suppressor gene in epithelial ovarian cancer (Ntougkos et al., 2005). Besides being differentially expressed between normal and tumor, LSAMP expression was also found to be associated with differentiation status as it is highly expressed in well or moderate tumors (Ntougkos et al., 2005) Among the IgLON family members, OPCML was also suggested as a tumor suppressor gene based on data obtained from epithelial ovarian cancer. Inactivation by LOH and hypermethylation was frequently observed in tumor
15
samples. Moreover, decreased expression and epigenetic inactivation of OPCML has been shown in brain tumors, multiple carcinomas and lymphomas (Cui et al., 2008; Reed et al., 2007) .
Recently, two different groups identified LSAMP deletions in osteosarcomas (Kresse et al., 2009; Yen et al., 2009a). Kresse et al. (2009) showed that chromosomal region containing LSAMP gene is frequently deleted in osteosarcoma tumor samples and cell lines by using CGH array analysis. Moreover, at the expression level, low expression of LSAMP in tumors was shown to be correlated with poor survival (Kresse et al., 2009). Yen et al. (2009) also identified chromosomal aberrations in the region of 3q13.31 where LSAMP is located to be associated with progression of osteosarcomas. Homozygous or heterozygous deletions of LSAMP in primary osteosarcomas were detected and further supported with reduced expression levels of
16
2
AIM:
Clinical studies are not sufficient for good prognosis in advanced stages of neuroblastoma which has a poor survival. Elucidating the molecular biology of neuroblastoma is a crucial step for improved prognosis and therapies. Inactivation of one or more tumor suppressor gene(s) in a neuroblast cell has been proposed for the initial step of the neuroblastoma genesis. Identification of tumor suppressor genes has a great potential for revealing the mechanism of tumor development and further investigation of new therapeutic approaches. Previous efforts identified several genetic alterations that may be used as prognostic markers in neuroblastoma. Among these alterations the amplification of MYCN which is identified in 20% of the cases has been used widely since its detection as the first strong indicator of poor outcome. However, MYCN amplification or other aberrations are not enough in classifying patients into low or high risk groups because of the heterogeneity of neuroblastoma.
Since neuroblastoma is neural crest originated, it is rational to inspect genes that drive neural development. IgLON family members (LSAMP, OPCML, NTM, and
NEGR1) are well characterized for their function in developing neural system.
Furthermore, they function as cell adhesion molecules whose roles in tumorigenesis are well established. Recently, several studies suggested two members of this family,
LSAMP and OPCML, as potential tumor suppressors for epithelial ovarian cancer.
Loss of OPCML is further associated with brain tumors. LSAMP is also linked to clear cell renal cell carcinoma and osteosarcomas. Moreover, homozygous deletions of LSAMP marker in neuroblastoma cell lines were shown.
In the light of these data and necessitate for improving prognosis in neuroblastoma, this study aims to identify a novel candidate tumor suppressor; LSAMP, which we hypothesize to be a gene that plays a role in neuroblastoma tumorigenesis.
17
3
MATERIALS AND METHODS:
3.1
Materials:
3.1.1
Chemical Solutions and Reagents:
Ethidium Bromide (EtBr):
10mg/ml in water (stock solution) 30ng/ml (working solution)
50X TAE Buffer:
121 g Tris Base
28.55 ml Acetic Acid (Glacial)
18.6 g Na2EDTA.H2O (Triplex) (Added in last step to ease dissolving) ∆H2O is added to 500 ml. 6X Loading Buffer: 30% Glycerol 0.04% Bromphenolblue 0.04% Xylene Cyanol ∆dH2O 2% (w/v) Agarose Gel: 50 ml 1X TAE
18 10 mM TE Buffer: ∆dH2O to 400 ml 0.61 g Tris 0.15 g EDTA (m.w. 292.1) ∆dH2O to bring volume to 500 ml Adjust pH to 7.5 - 8.0 10mM TE/1% Tween 20:
1 ml Tween 20 is added into 100 ml of 10mM TE Buffer
3.1.2
PCR Primers and Conditions:
3.1.2.1
Semi-Quantitative and Multiplex PCR Reactions:
3.1.2.1.1 Master Mix:
PhireTM Hot Start DNA polymerase (F-120S) and DyNAzymeTM II DNA Polymerase (F-503S) were purchased from Finnzymes’s (Espoo, Finland) and were used in semi Q-PCR and Multiplex PCR reactions, respectively. Reaction buffers and MgCl2 buffers provided with the DNA polymerases were used. dNTP mix (10 mM of each nucleotide) (#R0192) of Fermentas (Burlington, Canada) and HyClone HyPureTM Molecular Biology Grade Water produced by Thermo Scientific (Waltham, USA) were used in all reactions. Primers used in the study were synthesized by IONTEK (Istanbul, Turkey).
3.1.2.1.2 Primers:
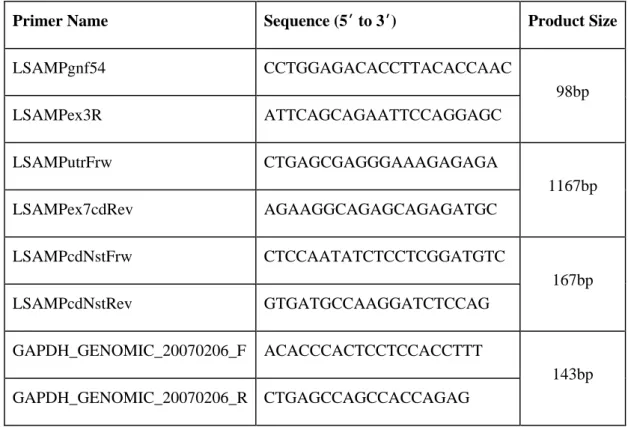
Primers for LSAMP and GAPDH were designed by using Primer3 program available online at http://frodo.wi.mit.edu/. Intron – exon boundaries were used in design of LSAMPgnf54 and LSAMPex3r primer pairs which was used for amplifying only genomic DNA of 98 bp in neuroblastoma PCR reactions. LSAMPutrFrw and
19
LSAMPex7cdRev primer pairs were used in brain tumors with a product size of 1167bp. A second primer pair LSAMPcdNstFrw and LSAMPcdNstRev were used further in Nested PCR reactions of brain tumors producing a band of 167 bp.
GAPDH primers were designed for genomic amplifications and cover 143 bp.
Designed primers were ordered from IONTEK (Istanbul, Turkey) and purchased in lyophilized form. All primers were hydrated to a concentration of 100 pm. The sequences of the primers are given in Table 2.
Primer Name Sequence (5ʹ to 3ʹ) Product Size
LSAMPgnf54 CCTGGAGACACCTTACACCAAC 98bp LSAMPex3R ATTCAGCAGAATTCCAGGAGC LSAMPutrFrw CTGAGCGAGGGAAAGAGAGA 1167bp LSAMPex7cdRev AGAAGGCAGAGCAGAGATGC LSAMPcdNstFrw CTCCAATATCTCCTCGGATGTC 167bp LSAMPcdNstRev GTGATGCCAAGGATCTCCAG GAPDH_GENOMIC_20070206_F ACACCCACTCCTCCACCTTT 143bp GAPDH_GENOMIC_20070206_R CTGAGCCAGCCACCAGAG
20
3.1.2.2
Quantitative Real Rime PCR (Q-RT-PCR) Reactions:
3.1.2.2.1 Master Mix:
For all Q-RT-PCR reactions master mix of Bio-Rad IQ SYBR Green Supermix (California, USA) was used. Reaction steps were performed according to the manufacturer’s instructions. Reaction conditions are listed in Table 7.1 & 7.2 in methods section under “Quantitative-RT-PCR Reaction” title.
3.1.2.2.2 Primers:
SybGREEN qPCR LSAMP primer mix was commercially purchased from Ori-Gene Company (Cat. no: HP206046). Primer sequences are not specified in respect to company’s confidentiality procedure. Primers are known to amplify a region around 95 to 140 bp. Beta-actin gene (ACTB) was selected to use as internal control.
3.1.2.2.3 Instrument:
Stratagene Mx5000P (California, USA) instrument was used to perform Q-RT-PCR experiments.
3.1.3
Tumor Samples:
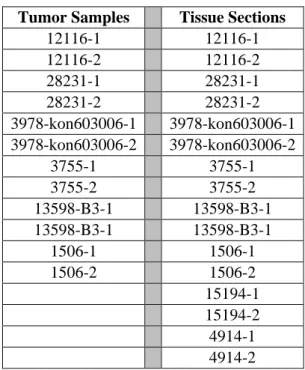
Neuroblastoma tumor samples and tissue sections were provided by Dr. Aylin Okçu Heper from School of Medicine, Department of Pathology, Ankara University. 6 neuroblastoma patients provided research materials. 2 paraffin embedded tissue sections from each of 6 patients, 12 samples in total, and 14 poly-l lysine coated tissue slides were kindly provided. 12 samples and 8 tissue slides involving 6 tumors and 2 controls were used for protein level analysis of LSAMP (Table 3).
21
Tumor Samples Tissue Sections
12116-1 12116-1 12116-2 12116-2 28231-1 28231-1 28231-2 28231-2 3978-kon603006-1 3978-kon603006-1 3978-kon603006-2 3978-kon603006-2 3755-1 3755-1 3755-2 3755-2 13598-B3-1 13598-B3-1 13598-B3-1 13598-B3-1 1506-1 1506-1 1506-2 1506-2 15194-1 15194-2 4914-1 4914-2
Table 3: List of neuroblastoma tumor samples and tissue sections used in this study, two samples from each patient were provided
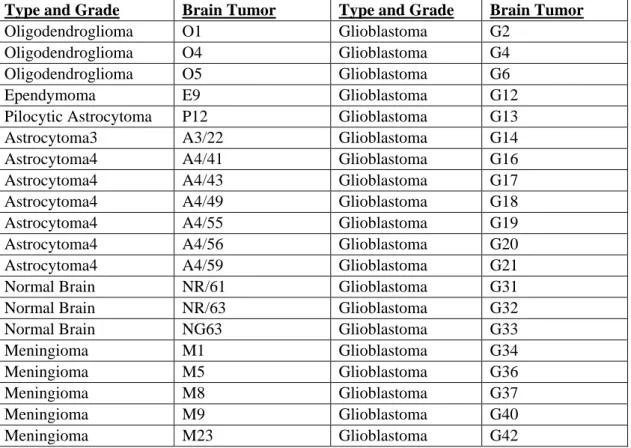
Brain tumor samples of 37 patients with different types and grades of brain tumor and 3 normal brain tissues were kindly provided by Assoc. Prof. Hasan Uğur Çağlar from School of Medicine, Department of Neurosurgery, Ankara University (Table 4)
22
Type and Grade Brain Tumor Type and Grade Brain Tumor
Oligodendroglioma O1 Glioblastoma G2 Oligodendroglioma O4 Glioblastoma G4 Oligodendroglioma O5 Glioblastoma G6
Ependymoma E9 Glioblastoma G12
Pilocytic Astrocytoma P12 Glioblastoma G13 Astrocytoma3 A3/22 Glioblastoma G14 Astrocytoma4 A4/41 Glioblastoma G16 Astrocytoma4 A4/43 Glioblastoma G17 Astrocytoma4 A4/49 Glioblastoma G18 Astrocytoma4 A4/55 Glioblastoma G19 Astrocytoma4 A4/56 Glioblastoma G20 Astrocytoma4 A4/59 Glioblastoma G21 Normal Brain NR/61 Glioblastoma G31 Normal Brain NR/63 Glioblastoma G32
Normal Brain NG63 Glioblastoma G33
Meningioma M1 Glioblastoma G34
Meningioma M5 Glioblastoma G36
Meningioma M8 Glioblastoma G37
Meningioma M9 Glioblastoma G40
Meningioma M23 Glioblastoma G42
Table 4: List of brain tumors of different types and grades used in this study
3.1.4
Cell Culture:
3.1.4.1
Cell Lines:
Two frozen neuroblastoma cell lines SK-NAS and CLB-MA1 (LT) were obtained from Dr. Valérie Combaret of Oncologie Génétique Centre Léon Bérard, France. Cells were tested and mycoplasma free. Cell lines in cryotubes were immediately stored in liquid nitrogen tanks after their arrival in dry ice.
3.1.4.2
Media and Solutions
Two cell lines SK-NAS and CLB-MA1 (LT) were cultured in 25 ml flasks (Greigner-Bio) as monolayer. Cell lines were grown in RPMI-1640 (Biological
23
Industries) supplied with 10% FBS (Sigma), 50mg/ml penicillin / streptomycin and non-essential amino acids (Biochrom AG). Cell lines were cultured at 37°C in an incubator with 5% CO2 (Heto-Holten, Surrey, UK). Cells were handled in sterile laminar hoods (Heto-Holten, Surrey, UK). Reagents were kept at 4°C except Trypsin – EDTA which was stored at -20 °C and pre-heated to 37°C before use.
3.1.4.3
Antibody
Rabbit polyclonal antibody to LSAMP (ab64427) was purchased from Abcam (Cambridge, USA).
3.2
Methods:
3.2.1
The cDNA Synthesis:
RevertAidTM First Strand cDNA synthesis kit (#k1622) (Fermentas, USA) was used for all cDNA synthesis reactions. All reagents were provided by the kit. Total RNA samples isolated from brain tumor patients were reverse transcribed according to manufacturer’s protocol. 2 µg of RNA template was mixed with 1 µl oligodT and DEPC treated water is added to 12 µl. Mixture was gently pipetted and incubated at 70°C for 5 minutes. After incubation 4 µl of 5X reaction buffer, 1 µl of RibolockTM Ribonuclease inhibitor and 2 µl of dNTP mixture were added in order. The mixture was gently pipetted and incubated at 37°C for 5 minutes. In next step, 1 µl of Revert Aid TM M-MuLV Reverse Transcriptase is added and incubated at 42°C for 1 hour proceeded by 10 minutes at 70°C. The products were stored at -20°C for further use.
24
3.2.2
Multiplex PCR Reaction:
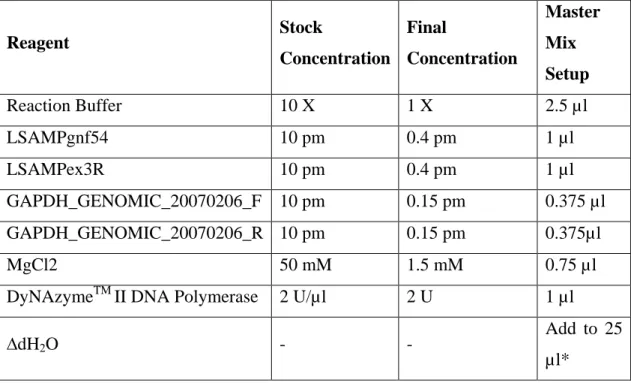
Multiplex PCR (MP-PCR) was performed by using genomic primers for LSAMP and
GAPDH. All PCR reactions were carried out by using Techne-512 PCR machine
(Techne Inc). Optimal conditions were obtained by changing primer concentrations and temperature. Reaction conditions and final concentrations of reagents used in master mix for one tube (25 µl) are listed in Table 5 and Table 6, respectively. Templates containing 100 ng or 200 ng of DNA were used in reactions. All resulting PCR products were assessed by running in 2% agarose gels with EtBr and visualized under UV. Reagent Stock Concentration Final Concentration Master Mix Setup Reaction Buffer 10 X 1 X 2.5 µl LSAMPgnf54 10 pm 0.4 pm 1 µl LSAMPex3R 10 pm 0.4 pm 1 µl GAPDH_GENOMIC_20070206_F 10 pm 0.15 pm 0.375 µl GAPDH_GENOMIC_20070206_R 10 pm 0.15 pm 0.375µl MgCl2 50 mM 1.5 mM 0.75 µl
DyNAzymeTM II DNA Polymerase 2 U/µl 2 U 1 µl
∆dH2O - -
Add to 25 µl*
25
Reaction Steps Cycle Numbers
5 min. of initial denaturation at 95°C 1 30 sec. at 95°C
35 30 sec. at 60°C
35 sec. at 72°C
10 min. at 72°C 1
Table 6: MP-PCR Reaction conditions
3.2.3
Semi-Quantitative PCR Reaction:
Brain tumor cDNAs were tested for LSAMP expression level by semi Q-PCR method. GAPDH was selected as a housekeeping gene before starting to experiments and all samples were tested for GAPDH expression. All PCR reactions were done in Techne-512 PCR equipment (Techne Inc). Optimal conditions were obtained by changing primer concentrations and temperature. Reaction conditions and final concentrations of reagents used in master mix for one tube (20 µl) are listed in Table 7 and Table 8, respectively. All resulting PCR products were assessed by running in agarose gels with EtBr and visualized under UV.
26 Reagent Stock Concentration Final Concentration Master Mix Setup Reaction Buffer 5 X 1 X 4 µl
LSAMP Forward Primer# 10 pm 0.5 pm 1 µl
LSAMP Reverse Primer# 10 pm 0.5 pm 1 µl
PhireTM Hot Start DNA
polymerase - - 0.4 µl
∆dH2O - - Add to 20 µl*
Table 7: Semi-Q-PCR master mix reagents and concentrations
Reaction Steps Cycle Numbers
30sec. initial denaturation at 98°C 1 5 sec. at 98°C
30 5 sec. at 63°C
20 sec. at 72°C
1 min. at 72°C 1
27
3.2.4
Quantitative RT-PCR Reaction:
SYBR Green I method recommended by manufacturer was applied for analysis of
LSAMP expression in brain tumors and normal brain tissue. LSAMP primer mix and
Beta-actin gene (ACTB) primers were purchased from OriGene and used in all reactions. Beta-actin gene was used as internal control. 37 tumor and 3 normal brain samples were tested in duplicates for both LSAMP and beta-actin gene (ACTB). Reaction mixture setup for one tube and conditions are listed in Table 9, 10 and 11.
Corresponding readings of expression for both genes in tumors and normal samples were used in calculating expression differences (Table 12). The relative expression of LSAMP in tumors compared to normal brain tissues has been calculated by delta - delta CT method. The formula used in these calculations is as below:
• Relative Expression Ratio = [E (LSAMP) ∆CtLSAMP
(Ct normal - Ct tumor)
/
E (ACTB) ∆CtACTB
(Ct normal -Cttumor)
]
In this formula, E (LSAMP) and E (ACTB) represent the primer efficiencies of LSAMP and
ACTB primers, respectively. Efficiency of the primers was approximated as 100% therefore a two fold increase at each cycle (E (LSAMP) = 2, E (ACTB) = 2). ACTB gene
(B-actin) was used as reference for normalization. Ct normal values correspond to Ct values of normal brain samples, where Ct tumor belongs to Ct values of brain tumors. Results were log2 transformed and plotted (Fig.11). Statistical analysis of significance was performed by using one sample t-test at 95% confidence interval (H0 = No difference exists in tumors compared to normal = 0).
28
Reaction Mixture Volume
2X Master mix (Bio-Rad IQ ) 12.5 µl
LSAMP primer mix 1 µl
Template cDNA 1 µl
dH2O 10.5 µl
Mineral oil 12.5 µl
Total 37.5 µl
Table 9: Q-RT-PCR reaction mixture for LSAMP gene
Reaction Mixture Volume
2X Master mix (Bio-Rad IQ ) 12.5 µl Beta-actin forward primer (10pm) 1 µl Beta-actin reverse primer (10pm) 1 µl
Template cDNA 1 µl
dH2O 9.5 µl
Mineral oil 12.5 µl
Total 37.5 µl
29
Reaction Steps Cycle Number
5 min. of initial denaturation at 95°C 1 15 sec. at 95°C
40 15 sec. at 62°C
15 sec. at 72°C
10 min. at 72°C 1
Melting Curve Step
1 min. at 95 °C
1 30 sec. at 55 °C
30 sec. at 95 °C
Table 11: Reaction setup in quantitative RT-PCR experiments
3.2.5
Agarose Gel Electrophoresis
2% agarose gels with 30ng/µl EtBr were prepared to run PCR products. 2µl of 6X DNA loading dye was added to 10µl of each PCR product and gently pipetted. 1X TAE buffer was added into gel electrophoresis equipment and gel tray was placed properly. Gene Ruler DNA Ladder Mix of Fermentas (100-10,000bp) (Burlington, Canada) was used as size marker and loaded into the first well. Samples were loaded into separate wells which are horizontally aligned and run vertically under 100 V for approximately 30 minutes. Visualization and photography of DNAs were carried out by using Bio-Rad (California, USA) Transilluminator equipment under UV light of 340 nm wavelength.
3.2.6
Thawing and Culturing Cell Lines
Cryotubes were removed from liquid nitrogen tanks and thawed at 37°C. Lids of the
tubes were carefully loosened and pressure inside the tubes was decreased. The cells were resuspended gently by using a pipette and 5ml of growth medium pre-heated to 37°C was added into each tube inside the sterile hood. The cells were centrifuged at
30
1500 rpm for 5 minutes. Supernatants were discarded and the pellets were resuspended in 5 ml growth medium to plate into 25 ml flasks. Flasks were stored in a humidified incubator at 37°C with 5% CO2. Culture mediums were refreshed in the next day.
3.2.7
Growth and Passaging of Cell Lines
Cells were examined under bright field microscope everyday for their confluency and culture mediums were refreshed. All culture mediums and enzymes were pre-heated to 37°C. Inside the sterile hood, the old mediums were vacuumed and the cells were washed twice with PBS. PBS was removed with vacuum and 0.5 ml of trypsin was added to each flask. Cells were incubated for 2-3 minutes at room temperature. Detachment of cells from the flask surface was confirmed via microscope and 5 ml of fresh RPMI 1640 (with supplements) medium was added to deactivate trypsin. Medium was pipetted gently to scatter cells from flask surface. Each cell line was divided into two by transferring 2.5 ml into new two 25 ml flask for each. 2.5 ml of medium was added into each bringing the total volumes to 5 ml. Flasks were kept in incubators at 37°C with 5% CO2.
3.2.8
Pelleting and Collecting Cells
The medium of flasks, where cells reached to optimal confluency, was aspirated and washed with PBS twice. 0.5 ml of trypsin was used for each flask to detach cells from the surface. Flasks were incubated at room temperature for 2-3 minutes. Fresh medium was supplied for each and gently pipetted. Suspensions were collected to 15 ml falcon tubes and centrifuged at 1400 rpm for 5 minutes. Supernatants were discarded and the pellets were washed with PBS twice. Tubes were centrifuged again at 1400 rpm for 5 minutes and resulting supernatants were aspirated via vacuum carefully. Pellets were immediately kept at -80°C.
31
3.2.9
Genomic DNA Isolation
Cell pellets were removed from -80°C refrigerator and thawed at room temperature. Qiagen DNeasy Tissue Kit (Venlo, The Netherlands) was used for isolating genomic DNA according to manufacturer’s recommended protocol. Nanodrop Spectrophotometer (Nanodrop Technologies) was used for assessing the quality and amount of genomic DNA extracted. Samples were stored at -20°C.
3.2.10
Immunohistochemical Analysis of LSAMP Protein
Immunohistochemistry (IHC) was performed on sections of 6 neuroblastoma, 1 fetal kidney & suprarenal and 1 adult cerebellum tissues. Neuroblastoma tissues from patients were sectioned on poly-l lysine coated slides and were provided by Dr. Aylin Okçu Heper from School of Medicine, Department of Pathology, Ankara University. Dr. Emin Öztaş from Gülhane Military Medical Academy (GMMA) helped us with the IHC protocol. In brief, tissue sections were deparaffinized at 70°C and then in Xylene. After rehydration in graded alcohol series, glass slides were immerged in 10 mM citrate buffer, pH 6.0 and transferred into microwave for 20 minutes for antigen retrieval. Endogenous peroxidase was blocked by incubation of slides in 0.3 % H2O2 for 30 minutes. Phosphate buffered saline (PBS) was used in all
washing steps. Tissue sections were incubated with LSAMP polyclonal antibody used at 1:500 dilutions in blocking solution, 50 µl was used for each slide. Slides were left overnight in humid chamber at 4 °C. Next day slides are washed with PBS and then universal staining kit (LabVision) was used according to manufacturer recommendations. Diaminobenzidine (DAB) was used as chromogen, and the slides were counterstained using Mayer’s haematoxylin. Normal serum or phosphate buffered saline were used as negative controls, instead of the primary antibodies. Both positive and negative controls were processed in the same slides which have two distinct regions of tissue sections. Regions close to the slide ID was used as
32
positive where regions at the terminal ends were used as negative. Dark brown staining in sections was taken as positive reaction.
3.2.11
DNA extraction from Paraffin Embedded Tissues
5 µm sections of 12 paraffin embedded tissue samples collected from neuroblastoma patients were provided by Dr. Aylin Okçu Heper from Ankara University, Medical School, Department of Pathology. The same patients studied for LSAMP expression by using IHC were chosen. Boiling method protocol of Cao et al (2003) was used for DNA extraction from paraffin embedded tissues (Cao et al., 2003). Briefly, 1 ml of Xylene was added into the eppendorfs containing paraffin sections. Tubes were inverted several times and incubated a few minutes at room temperature. The samples were centrifuged for 5 min at 13,000 rpm to pellet the tissue. After obtaining pellets, the two steps, adding Xylene and centrifugation, were repeated. The pellets were washed by adding 100% ethanol, the tubes were inverted several times and centrifuged as 13,000 rpm for 5 min. The supernatant was removed and the step was repeated. 1 ml of 10 mM TE buffer was added into each tube and inverted several times before centrifuging at 13,000 rpm for 5 min. Supernatants were removed. 100 µl of 10 mM TE/1% Tween 20 containing 200 µg proteinase K was added into each tube and left to incubation at 55°C overnight. Next day, the tubes were heated at 97°C for 10 min to inactivate proteinase K and centrifuged at 13,000 rpm for 5 min. Supernatants were removed into new tubes and stored at - 20 °C.
33
4
RESULTS:
4.1
Genetic Analysis of LSAMP Gene Region in Tumors and Cell
Lines:
Neuroblastoma genomic DNA was isolated from paraffin sections from 6 patients (2 sections for each) and 2 neuroblastoma cell lines; SK-NA-S and CLB-MA1, were analyzed for LSAMP. Samples 13598-1, 13598-2, 3755-1, 3755-2 and 3978-2 did not result in amplifications for both genes (data not shown). GAPDH was used as reference gene and GAPDH primers were used in combination with LSAMP primers in Multiplex-PCR reactions. 2 HCC (hepatocellular carcinoma) samples, SKHep-1 and Hep-3B, which have normal copy numbers of LSAMP, were used as positive controls. Products were loaded together with Gene Ruler DNA Ladder mix (100-10,000 bp) in 2% agarose gels under constant voltage of 100V about 30 min. The expected product sizes for amplified LSAMP and GAPDH genomic regions were 98bp and 143bp, respectively. Visualization with Bio-Rad Transilluminator, revealed the banding patterns corresponding to two genomic regions. Although, GAPDH was longer in base pairs, it was amplified in all samples, but LSAMP having smaller base pairs, which would be easier to amplify, was not detected to be fully amplified in a few samples. This suggested possible deletions in LSAMP genomic region in these samples. Thus, among 6 clinical patient samples, one possible homozygous deletion and one LOH in LSAMP region was identified.
4.1.1
Homozygous Deletion of LSAMP Gene:
Although amplification patterns of GAPDH region were similar for all patient samples, cell lines and controls, in patient #28231 any band corresponding to LSAMP gene could not detected which suggests a homozygous deletion of LSAMP genomic region (Fig.6).
34
Figure 6: Homozygous deletion of LSAMP region in patient #28231 is shown. Multiplex-PCR result of LSAMP and GAPDH in neuroblastoma tumor and cell lines where HCC samples SK-Hep-1 and Hep-3B were used as positive control.
4.1.2
LOH at LSAMP Genomic Region:
Although, there was a band corresponding to LSAMP genomic region in tumor sample of patient #12116, the intensity of the band was weaker compared to GAPDH band. This result may suggest a possible LOH in correspondent LSAMP chromosomal region 3q13.31 (Fig.7).
35
Figure 7: Possible LOH in LSAMP locus of patient sample #12116 is shown. Multiplex-PCR result of LSAMP and GAPDH in neuroblastoma tumor and cell lines where HCC sample SK-Hep-1 was used as positive control.
4.2
Assessment of LSAMP Protein in Neuroblastoma Tissues:
6 neuroblastoma tissues sectioned from the same patients analyzed for any genomic aberrations in LSAMP gene were further assessed at the protein level. IHC was used to detect LSAMP protein in neuroblastoma tissues. Additionally, healthy adult cerebellum and fetal kidney & suprarenal tissues were used as positive controls. Pictures of successful staining were shot with Zeiss Axiocam Imager A1 microscope (Gottingen, Germany). We observed a common weak staining pattern for all tumor samples compared to positive controls. Moreover, consistent to the result of genomic analysis, we did not see any protein in patient sample #28231 (Fig.8).
37
Figure 8: LSAMP protein levels in neuroblastoma tissues revealed by IHC (A, B, C, D, E, and F). Healthy adult cerebellum and fetal kidney &suprarenal tissue sections are used as controls (G & H).
4.3
Analysis of LSAMP Expression in Brain Tumors:
In addition to genomic and protein level analyses, we also assessed the expression of
LSAMP in mRNA level in other tumors derived from neural tissues. A set of brain
tumor patient RNAs were first reverse transcribed into cDNAs and tested for
GAPDH gene levels which was used as reference gene in semi-quantitative PCR
experiments (Fig.9 & Fig 10). All samples were used in analysis of LSAMP expression with semi quantitative PCR and Q-RT-PCR methods.
4.3.1
Semi Quantitative PCR Results:
All brain tumor samples were first tested by using primer pairs designed for amplifying a large region involving 6 exons in LSAMP gene. Glioblastoma samples were successfully amplified (Fig.10). Meningioma, oligodendroglioma, astrocytoma, ependymoma and pilocytic astrocytoma samples were further analyzed in nested PCR reactions by using primer pairs designed for amplifying a smaller region inside the first amplification (Fig .11).
38
Figure 9: LSAMP and GAPDH expression levels of the same glioblastoma samples.
LSAMP
39
Figure 10: LSAMP expression in brain tumors; M series: Meningioma, O series: Oligodendroglioma, N series: Normal brain, P 12: Pilocytic Astrocytoma A series: Astrocytoma Grade 4, E9: Ependymoma.
Results showed us in some tumors although GAPDH is well expressed, LSAMP expression was lower compared to normal brain samples. A table summarizing these results showed us there is particularly a difference of expression in astrocytoma grade 4, meningioma and glioblastomas (Table 12). In this table, weak intensity bands are represented by “+”, medium intensity by “++” and high intensity by “+++” signs. Although, semi quantitatively we observe the decrease in LSAMP expression, a more precise method Q-RT-PCR was performed in next step for detecting actual expression levels.
4.3.2
Q-RT-PCR Detection of LSAMP Expression in Brain Tumors:
We performed Q-RT-PCR experiments by using commercially obtained LSAMP primers amplifying a small region between 100-140bp and Βeta-actin primers to use Beta-actin expression as control. BioRad SyBr Green Kit was used to prepare master
LSAMP
40
mix. The results were analyzed by using delta - delta Ct method and indicate a clear decrease in LSAMP expression in majority of meningiomas, astrocytoma grade 4 and glioblastoma tumors compared to normal brain tissue (Table. 13, Fig.11).
The calculated fold changes suggesting LSAMP has generally lower values for tumors compared to normal seem statistically significant at 95% confidence interval (p-value=0.002).
41
Type and Grade Brain Tumor LSAMP GAPDH Type and Grade Brain Tumor LSAMP GAPDH
Oligodendroglioma O1 No +‡ Glioblastoma G4 No +
Oligodendroglioma O4 +++ +++ Glioblastoma G6 + +++
Oligodendroglioma O5 +++ ++ Glioblastoma G12 +‡ +++
Ependymoma E9 ++ ++‡ Glioblastoma G13 +++ +++
Pilocytic Astrocytoma P12 No +‡ Glioblastoma G14 + ++
Astrocytoma3 A3/22 No + Glioblastoma G16 +++ +++
Astrocytoma4 A4/41 ++ +++ Glioblastoma G17 No +
Astrocytoma4 A4/43 ++ +++ Glioblastoma G18 + +
Astrocytoma4 A4/49 + +++ Glioblastoma G19 +++ +++
Astrocytoma4 A4/55 +++ +++ Glioblastoma G20 No ‡
Astrocytoma4 A4/56 +++ +++ Glioblastoma G21 +++ +++
Astrocytoma4 A4/59 + +++ Glioblastoma G31 No +++
Normal Brain NR/61 ++ +++ Glioblastoma G32 +++ +++
Normal Brain NR/63 + +++ Glioblastoma G33 +++ +++
Normal Brain NG3 +++ +++ Glioblastoma G34 + +++
Meningioma M1 No +++ Glioblastoma G36 +++ +++ Meningioma M5 No ++‡ Glioblastoma G37 +++ +++ Meningioma M8 ++ +++ Glioblastoma G40 No + Meningioma M9 No ++‡ Glioblastoma G42 No ++ Meningioma M23 No ++ Glioblastoma G42 No ++ Glioblastoma G2 ++ ++ Glioblastoma G42 No ++
42
TumorSamples Ct LSAMP* CtACTB** Fold Change LOG2
A322 30.62 30.2 0.737774 -0.43875 A441 23.735 16.9925 0.009219 -6.76125 A443 22.395 14.9 0.005472 -7.51375 A449 24.555 19.935 0.040142 -4.63875 A455 20.39 14.905 0.02204 -5.50375 A456 19.025 15.19 0.069168 -3.85375 A459 23.125 24.74 3.023564 1.59625 E9 22.515 24.085 2.93071 1.55125 G12 27.13 17.83 0.001566 -9.31875 G13 23.365 17.035 0.01227 -6.34875 G14 26.23 22.625 0.081123 -3.62375 G16 24.16 18.54 0.020071 -5.63875 G17 27.075 29.395 4.928846 2.30125 G18 27.165 27.25 1.046992 0.06625 G19 23.595 18.335 0.02576 -5.27875 G2 25.01 19.275 0.018533 -5.75375 G20 30.025 31.59 2.92057 1.54625 G21 22.48 17.34 0.027994 -5.15875 G31 24.695 24.725 1.007828 0.01125 G32 24.53 18.57 0.015857 -5.97875 G33 23.405 17.47 0.016134 -5.95375 G34 25.345 20.22 0.028286 -5.14375 G36 22.94 17.24 0.018988 -5.71875 G37 24.525 17.58 0.008011 -6.96375 G4 29.09 30.38 2.413706 1.27125 G40 27.83 24.09 0.073876 -3.75875 G42 26.265 23.435 0.138816 -2.84875 G6 28.36 20.04 0.003089 -8.33875 M1 26.77 24.955 0.280534 -1.83375 M23 30.73 21.495 0.001638 -9.25375 M5 23.71 19.595 0.056966 -4.13375 M8 26.485 17.455 0.001888 -9.04875 M9 27.205 21.38 0.017412 -5.84375 O1 28.415 25.325 0.115924 -3.10875 O4 21.735 19.965 0.289423 -1.78875 O5 23.695 24.0875 1.295716 0.37375 P12 26.895 28.735 3.533873 1.82125
Table 13: Quantitative RT-PCR results of LSAMP in brain tumors (*Ct normal brain LSAMP: 23.0363, ** Ct normal brain ACTB: 23.055)
43
Figure 11: Expression differences in brain tumors relative to normal brain tissue.