CONFIDENCE-ENHANCED PERFORMANCE: DOES IT EXIST AND IF SO HOW DOES IT WORK?
A Master’s Thesis by ZAHRA MURAD Department of Economics Bilkent University Ankara September 2010
CONFIDENCE ENHANCED PERFORMANCE:
DOES IT EXIST AND IF SO HOW DOES IT WORK?
The Institute of Economics and Social Sciences of
Bilkent University
by
ZAHRA MURAD
In Partial Fulfillment of the Requirements for the Degree of MASTER OF ARTS in THE DEPARTMENT OF ECONOMICS BİLKENT UNIVERSITY ANKARA September 2010
I certify that I have read this thesis and have found that it is fully adequate, in scope and in quality, as a thesis for the degree of Master of Arts in Economics.
--- Assist. Prof. Dr. Kevin Hasker Supervisor
I certify that I have read this thesis and have found that it is fully adequate, in scope and in quality, as a thesis for the degree of Master of Arts in Economics.
---
Assist. Prof. Dr. Esra Durceylan Kaygusuz Examining Committee Member
I certify that I have read this thesis and have found that it is fully adequate, in scope and in quality, as a thesis for the degree of Master of Arts in Economics.
--- Assist. Prof. Dr. Celile Itır Göğüş Examining Committee Member
Approval of the Institute of Economics and Social Sciences
--- Prof. Dr. Erdal Erel
iii ABSTRACT
CONFIDENCE ENHANCED PERFORMANCE: DOES IT EXIST AND IF SO HOW DOES IT WORK?
MURAD Zahra
M.A. Department of Economics Supervisor: Assist. Prof. Kevin Hasker
September 2010
We empirically test and investigate the psychological mechanism behind the theory of Confidence Enhanced Performance (Compte and Postlewaite, 2004). This theory suggests that if confidence enhances performance, then people will benefit from having the commonly observed tendency to discount past failures and be overconfident. We test this hypothesis using three tasks which require different cognitive abilities. Our findings are partially supportive of the theory. However, we cannot conclude that any of our confidence variables significantly and positively affect performance. Only in one task (the Picture Recall task) we find that enhanced mood level positively affects performance. The view that people are generally overconfident when performing tasks with imperfect feedback is not upheld. Furthermore, there seem to be strong task differences in both levels of confidence and the effects of psychological variables on performance.
Keywords: Economic Experiments, Overconfidence, Cognitive Performance, Choice under Risk
iv ÖZET
ÖZGÜVENĠN GELĠġTĠRDĠĞĠ PERFORMANS:
VAR MIDIR VE VARSA HANGI DURUMLARDA GEÇERLĠDĠR?
MURAD Zahra
Yüksek Lisans, Ekonomi Bölümü Tez Yöneticisi: Assist. Prof. Kevin Hasker
Eylül 2010
ÇalıĢmamızda Özgüvenin GeliĢtirdiği Performans modelinin (Compte ve Postlewaite, 2004) altındakı psikolojik mekanizmayı bulmak için deneysel olarak test ve analiz ediyoruz. Bu model özgüvenin performansı iyileĢtirdiğini varsayarak insanların geçmiĢ baĢarısızlıklarını görmezden gelip aĢırı özgüvenin refahlarının artıĢına neden olacağını ileri sürmektedir. Bu hipotezi farklı biliĢsel beceriler talep eden üç farklı görev kullanıp deneysel olarak test ediyoruz. Bulgularımız insanların gelecek performansları hakkında aĢırı iyimser olduklarını doğrulamasına rağmen, geçmiĢteki performansları hakkında yeterince net olduklarını da öne sürmektedir. Deneylerimiz sonucunda sadece bir görevde özgüvenin ve moral seviyesinin (film klipleri yolu ile) performansı geliĢtirdiğini buluyoruz.
v
ACKNOWLEDGEMENTS
I would like to express my deepest gratitude to Assist. Prof. Kevin Hasker for his invaluable guidance, exceptional supervision and support throughout all stages off my study from the days of my undergraduate studies until now. It was a great
experience for me to study under his supervision.
I am also indebted to Assoc. Prof. Fergus Bolger, who is also going to be the coauthor of the paper based on this thesis, for his guidance and time spared throughout all stages of my study.
I am also thankful to Assist. Prof. Esra Durceylan Kaygusuz for her interest and worthy guidance throughout all steps of my thesis.
Also many thanks to Assist. Prof. Celile Itır Göğüş for her interest in my subject and agreeing to be a third committee member in my thesis defense presentation.
I would like to thank all teaching assistants in Bilkent University, Department of Economics for their sincere friendship that made my studies entertaining and fun.
I owe special thanks to my family for their unconditional love and unlimited patience from the very beginning and for always being there to support me.
vi TABLE OF CONTENTS ABSTRACT ... iii ÖZET ... iv ACKNOWLEDGMENTS ... v TABLE OF CONTENTS ... vi CHAPTER I: INTRODUCTION ... 1
CHAPTER II: LITERATURE REVIEW ... 7
CHAPTER III: EXPERIMENTAL DESIGN …… ... 12
CHAPTER IV: RESULT ………... 17
3.1 Subjects’ Background ………... 17
3.2 Does Confidence Enhance Performance? ... 18
3.3 Are People Overconfident? ... 23
3.4 Where Does Confidence Come from? …...………...……. 28
3.5 Effects of Movies ………... 36 CHAPTER V: CONCLUSION ... 39 SELECT BIBLIOGRAPHY ... 44 APPENDICES A. INSTRUCTIONS ………... 46 B. SAMPLE QUESTIONS ………... 51
1
CHAPTER 1
INTRODUCTION
Experimental analysis is now an established field in economics; indeed in 2002 Vernon L. Smith and Daniel Kahneman won the Nobel Prize for their contributions in this field. One underlying conclusion of this field is that we cannot simply ignore the psychological process that is behind decision-making. Daniel Kahneman was honored for blending psychology and economics. We contribute to this tradition with our research. Specifically, we empirically test and investigate the psychological mechanism behind the theory of Confidence Enhanced Performance (Compte & Postlewaite, 2004). This theory suggests that if confidence enhances performance then people will benefit from having the - commonly observed - tendency to discount past failures and be overconfident. There are several other recent papers theoretically analyzing overconfidence, which show that when individuals are overoptimistic, this overoptimism (eg. of managers about the projects overtaken) can be beneficial to agents and increase their welfare (Van den Steen, 2004; Gervais et al., 2007).
The term “confidence” is widely used and has several everyday and more technical meanings. In the psychology of decision making, confidence has tended to
2
be treated as a kind of subjective probability judgment of something happening or being the case, such as it raining tomorrow or one’s answer to a question being right – a number of similar judgments of this sort can be compared against the objective probabilities measured as relative frequencies of rainy days or correctly answered questions, in order to determine the “realism” of judges’ confidence (see e.g.,
Lichtenstein et al., 1982). Although this definition of confidence is clear and easy to work with experimentally we feel that it is lacking in certain characteristics that are relevant to understanding how confidence might enhance performance, most
particularly, the emotional dimension of confidence most clearly seen in the popular notion of “feeling (self) confident”. Accordingly we wish to propose that
confidence has at least two facets or measures: an affective one (i.e. related either to specific emotion or general mood) and a cognitive one (i.e. related to one’s beliefs about the likelihood of events or states of the world). More generally, we wish to suggest that confidence is a kind of attitude. Attitudes are evaluations of objects that then guide behavior towards those objects – specifically one’s tendency to approach or avoid them. Confidence is likewise an evaluation of an object (an event or state) that will influence one’s tendency to approach or avoid that object. So, for example, I might say that I am “confident” that I can beat Peter at tennis but not at chess, thus I positively evaluate my prospects of playing Peter at tennis but not those of playing him at chess. As a consequence I am more likely to challenge Peter to a game of tennis than one of chess.
A common characterization of attitudes maintains that they have three measures: cognitive, affective and behavioral. We therefore should add a behavioral measure to our definition of confidence – this would be the tendency to approach or
3
avoid objects. One important manifestation of the behavioral measure of confidence would be risk taking so, for instance, one might be more prepared to wager money on beating Peter at tennis than on beating him at chess. In our experiment we will deal with all three of these measures.
While Compte and Postlewaite (2004) make a valuable theoretic contribution they do not answer the question of whether Confidence Enhanced Performance (CEP hereafter) does have an impact in practice, and what is the psychological mechanism by which confidence enhances performance. We have identified three mechanisms of affective measure of confidence when being successful in the past could have impact future performance. First it could increase confidence itself, defined as a feeling of competence or power, this may lead to better performance by increased motivation and effort, second it could make someone be happy or in a good mood and this might release resources from mood repair. And third, it could make someone excited or aroused, thus, according to the Yerkes-Dodson Law (Yerkes & Dodson, 1908) easy tasks might be best performed at high levels of arousal and hard tasks at low levels of arousal. We also measure confidence in our experiment by its cognitive (the perception of success rate probabilistically) and behavioral (selecting risky vs. safe option) measures. Hence, our experiment is designed to first find out when, and if, CEP is effective and second to determine which measures of confidence cause the improvement.
It should be clear that CEP does not occur in every environment. Indeed Camerer and Lovallo (1999) find that in a market entry game overconfidence leads to excessive entry and decreased net profit. Bolger et al. (2008) further find that it is absolute overconfidence that causes excessive entry (i.e. not comparison of abilities
4
with competitors). Nowell and Alston (2007) and Kruger and Dunning (1999) show that bad students seem to be unaware of their low skill level resulting in them being overconfident, leading to less effort for the course work. Compte and Postlewaite (2004) discuss essentially decision theoretic environments, thus we will look at several different decision theory tasks to see if CEP occurs. Namely, we have three different tasks which require three different cognitive abilities: short term memory, long term memory and logical reasoning. We will have subjects take breaks during the experiment to view film clips that will impact either their mood or arousal level thereby identifying the affective measure behind CEP. Before seeing the question, we will allow subjects to choose either high risk or low risk payoff options, thus being able to estimate their confidence based on how high an expected gain it takes them to choose the high risk payoffs – a behavioral measure of confidence. Compte and Postlewaite (2004) also imply that CEP will only occur when feedback is imperfect. We therefore only provide feedback probabilistically at 50% of trials. Since papers like Camerer and Lovallo (1999), Bolger et al. (2008), Nowell and Alston (2007) and Kruger and Dunning (1999) present evidence that
overconfidence causes bad outcomes, it seems to be counterintuitive to suggest that overconfidence will enhance performance, thus welfare. However, if increased beliefs about your ability also positively influence the confidence power, then these beliefs could potentially enhance performance in any domain in one of three ways. First, increased affective confidence, manifested as feeling of competence or power may lead to better performance by means of increased motivation and effort. Second, increased affective confidence, manifested as a good mood, might release resources from mood repair and/or pessimistic rumination (Ellis & Ashbrook, 1988).
5
In the psychology literature, there is evidence that general mood influences
confidence such that better moods tend to lead to greater confidence in being correct and in good things happening (Johnson & Tversky, 1983; Macleod & Campbell, 1992; Nygren et al., 1996; Wright & Bower, 1992). There also have been a significant number of studies that analyze the effect of positive mood on performance (Brand et al., 1997; Isen, 2001; Isen & Erez, 2002). Those articles conclude that positive feelings foster clear-headed, well-organized, open-minded, flexible problem solving and thinking. From the foregoing discussion we expect that the affective measure of confidence will be the main route, if any, whereby CEP is realized although we have no prior expectations as to whether any effects will occur through changes in motivation, mood or arousal. Therefore, we have separate measures of each of these different aspects of the affective measure.
The first goal of this study is to determine if performance or behavior is significantly affected by confidence level and if so, how confidence affects
performance. It will be the first study to directly test CEP (Compte & Postlewaite, 2004) and the only study to analyze which mechanism causes CEP. The second goal of this study is to determine in what kind of environments CEP occurs manifested as three different tasks requiring three different cognitive abilities. This thesis will work in an environment where there is a clear "optimal" learning model, and will investigate whether the difference between the optimal model and the actual model may actually be beneficial to the subjects. It will also be one of the first works to manipulate the confidence, mood, and arousal of our subjects, thereby providing a holistic understanding of how confidence may affect future performance.
6
We have conducted experiments consisting of five sessions in total and we have collected data from 128 subjects. This number of subjects is higher than generally accepted data pool in experimental economics literature; hence our results will be highly inferential. The point of interest to us in our analysis will be the success, risk and feedback variables in each period, movies viewed between blocks, five answers to survey questions, difficulty level of each question and task variables. All of our other variables and results are derived from these variables.
The remainder of the thesis is organized as follows. Chapter 2 reviews related literature. In Chapter 3, we outline the experimental design and procedures used. In Chapter 4, we analyze the main results obtained and Chapter 5 concludes. Two appendixes contain instructions presented during our experiments and sample questions for each task.
7
CHAPTER 2
LITERATURE REVIEW
The main paper that we base our study on is by Compte and Postlewaite (2004) which shows that people's biased perceptions about their future success rates leads to better performances thus higher payoffs as a result. They state that their study's aim is to depart from neoclassical economic theory which asserts that individuals choose an activity depending on expected utility of doing so, where it is assumed that probability distribution over outcomes is exogenously given. Compte and Postlewaite (2004) incorporated a performance technology into their analysis - a person's history of successes and failures affecting the probability of success in future attempts. The bias of underrating number of past failures and thus forming false expectations about the future success rate is seen as an anomaly by economists, however, CEP model demonstrates that these biases are a part of rational
individual's information processing which leads to increased welfare of them. There are also other recent papers theoretically analyzing overconfidence, which prove that individuals tend to be overoptimistic (Van den Steen, 2004) and that overoptimism (or sometimes defined as overconfidence) of managers about the projects overtaken
8
is beneficial to firms and sometimes managers themselves (Gervais et al., 2007; Gervais & Goldstein, 2007).
There are many articles claiming that overconfidence result in bad outcomes. Roll (1986), amongst others, suggested that the large number of business failures might be due to overconfidence on the part of entrepreneurs. One of the first
experiments to test this hypothesis used a modified Market Entry Game (Camerer & Lovallo, 1999), whereby half of entrants' payoffs depended on their skill (and half on chance) – participants' entered the market too much when the payoffs were based on skill and made negative returns on average, compared to when payoffs were based on chance. The authors proposed that this finding was due to overconfidence by entrants in their skill level. However, Camerer and Lovallo neither manipulated nor measured confidence directly. In contrast, Bolger et al. (2008) concentrated on overconfidence as an independent variable, and by manipulations of confidence level measured decisions as a dependent variable. Their results supported Camerer and Lovallo's interpretation: increased confidence was associated with excess entry. This type of manipulation could also be used in our research; however, we came up with a simpler way which would determine confidence level of subjects through the experiment as an endogenous variable (risk level choices at each period).
Similarly, Kruger and Dunning (1999) argue that people hold overly favorable views about themselves in many circumstances. They experimentally showed that those people are unskilled in those domains where they are overly optimistic and suffer a dual burden: they reach erroneous conclusions and make wrong choices and their incompetence does not allow them to realize it. Nowell and Alston (2007) report the finding of a survey of student enrolled in economics and
9
quantitative courses at a large public university. They show that students often exhibit overconfident grade expectations and tend to overestimate the actual course grade at the completion of a course. They explain this finding by the theories of student motivation suggesting such overconfidence may lead students to study less than if they had accurate grade perceptions.
Since above mentioned papers present evidence that overconfidence causes bad outcomes, it seems to be counterintuitive to suggest that overconfidence will enhance performance. However, in the psychology literature, there is sufficient evidence that general mood influences confidence such that better moods tend to lead to greater confidence in being correct and in good things happening (Johnson & Tversky, 1983; Macleaod & Campbell, 1992, Nygren et al., 1996; Wright & Bower, 1992). A possible mechanism leading to these effects is mood-congruent encoding and/or activation such that positive memories (e.g. of being right, good things happening) become more available when in a good mood than bad memories and vice versa for bad moods.
In psychological literature there have been a significant number of studies that analyze the effect of positive mood on performance. Brand et al. (1997) revealed that physical reaction time is influenced by induced mood: subjects with positive induced mood showed faster response times than did subjects with negative induced mood. Isen (2001) and Isen (2002) present a good review of articles
analyzing effect of positive affect on cognitive thinking. The articles conclude that positive affect – beyond its important effects on memory for, and attitudes toward, ads and brands – fosters clear-headed, well-organized, open-minded, flexible problem solving and thinking.
10
The Resource Allocation Model (RAM) proposed by Ellis and Ashbrook (1988) can explain the consistent finding that depressed mood has a negative effect on memory. RAM suggests that depressed individuals are expected to be so
absorbed in thinking about depressing things, that the cognitive resources necessary for successful memory performance are limited further; cognitive resources may be diverted to mood repair. This theory is partially tested by Ellis et al. (1997), who show that mood affects subjects' ability to detect contradictory statements in written passages: subjects in better mood can distinguish the contradictions more easily than the ones in depressed mood.
In our research we are considering confidence to be a feeling of power or competence - this seems most accurately to capture Compte and Postlewaite's meaning of overconfidence (although they are not very clear on this point). In our experiment, we directly ask for assessments of confidence defined in this way. In contrast, decision-making researchers have generally measured confidence by asking for statements of belief about subjective-probability. For example, how sure are you that you answered the question correctly? How many questions do you think you got right? How many do you think that you will answer correctly in future? To be consistent with this work we also measure confidence in this way. The vast majority of psychological research on confidence has been concerned with its calibration (i.e. the degree to which subjective-probabilities correspond to objective probabilities defined as relative frequencies). Although the subject of some controversy, the finding of people most commonly being overconfident (subjective probabilities > objective probabilities) still has currency (see e.g. Lichtenstein et al, 1982; Tsai et al, 2008). With regard to the relationship between confidence and performance the
11
focus of studies has consequently been on the effects of performance on confidence (i.e. the existence and formation of (biased) beliefs about one's performance) rather than on the effects of confidence on performance, the case that we are chiefly interested in.
It is also notable that in all of the studies described above mood, confidence, and emotions were imposed exogenously. In our study, we make subjects sort themselves into high or low confidence groups by selecting risk - differing payoff levels in each period. Our expectation is that this natural manipulation of confidence will give more precise results for our hypothesis. The mood manipulation that we will be using will be based on short video clips. The effect of film clips on mood was tested by Hewig et al. (2005). The advantage of movie clips over other mood manipulation methods in a laboratory (e.g. hypnosis, feedback, social interactions, music, text, slides) is that clips have rather high ecological validity, as individuals in western societies often use dynamic visual stimuli in order to experience emotions. Meta - analyses on emotion induction show that film clips seem to be one of the most effective ways to elicit emotions (Gerrards-Hesse et al., 1994). 20 movie clips were analyzed divided into groups of three to four which targeted specific emotions and the result suggested that the selective induction of anger, fear, disgust, sadness, and amusement was successful for at least two clips of each target emotion.
12
CHAPTER 3
EXPERIMENTAL DESIGN
The experiment was conducted using the software package written for economic experiments – Ztree (Fischbacher, 2007). Subjects were selected from students of Bilkent University who were at least 18 years old and possessed fluent Turkish. Each subject had to complete two of the three tasks, either 44 or 60 periods
depending on the tasks. The order of questions and task were randomly selected by the program increasing the variation in our data set. In the Picture Recall (PR) task, subjects saw a picture for 5 seconds and then the question was asked regarding the picture they had seen. This task measured short term memory ability. The General Knowledge (GK) task asked subjects to answer general knowledge questions and was aimed at measuring long term memory. Both of these tasks consisted of 30 questions. The third task was the Syllogism (SG) task, which measured logical reasoning ability of subjects and was considered to be harder and more time consuming than the other two tasks, thus consisting of only 14 questions. These tasks represent a good range of decision environments in which confidence could affect performance. In order to simplify the analysis, subjects had to choose the correct answer from the two options provided.
13
Before seeing each question, subjects were asked to choose between two payoff levels with varying risk levels. When they chose option A, they earned X TL (Turkish Lira) if the answer was wrong and 2*X TL if the answer was correct. This represented the safe payoff level. On the other hand, if they chose option B, they got 0 TL if the answer was wrong and Y TL if the answer was correct. This in turn represented the risky payoff level. The payoffs were designed such that Y > 2*X > X > 0. X was equal to 0.10 TL for the Picture Recall and the General Knowledge questions and because of the difficulty level of the Syllogism task we set X to be 0.31 TL. To get more variation in our data, we ranged Y into four different values {0.22; 0.23; 0.24; 0.27 TL} for PR and GK task and {0.46; 0.49; 0.52; 0.57 TL} for SG task. The selected payoff level endogenizes confidence feeling of our subjects and represents the behavioral measure of confidence. We also randomize feedback rule: with 50% probability subjects received true feedback after they answered the question.
Figure 1 summarizes above described process: after stage 3, subjects move on to stage 1.
14
Every 15 (7 for SG task) periods subjects were asked to complete a short survey which consisted of the following questions:
1) Out of 15 (7) questions answered how many do you think you got right? (PastSuc)
2) How many do you think you will get right from the next 15 (7) questions? (FutSuc)
3) What is your current mood level on a ten-unit scale? (Mood) 4) What is your current arousal level on a ten-unit scale? (Arousal)
5) What is your current feeling of confidence on a ten-unit scale? (CPower)
Figure 1: Stages of each period for a given task Stage 1: Choose one of the following options:
Option A: You will earn 2*X if you are correct, X if you are wrong Option B: You will earn Y if you are correct, 0 if you are wrong
Stage 2: See a question and choose the answer from the same screen
or
See a picture for 5 seconds and then answer the question about the picture
Stage 3: Receive a feedback
Your answer was correct or
Your answer was wrong
Stage 3: See a screen saying
“You receive no feedback”
15
The answers to these questions were not subject to any payoffs and we intended them not to be. Since we want to measure the bias of overconfidence, making these questions payoff relevant would annul our purpose.
During the experimental session, subjects viewed two short movie clips which lasted around three and a half minutes. We had a total of four movie clips - two funny and two exciting - and subjects viewed two of those clips randomly selected. We used these movie clips to manipulate subjects’ emotional state levels and thus, understand the mechanism under the possible effect of emotional state on performance in different tasks. Movie clip 1 was one of the comic movie clips by Mr. Bean. Movie clip 2 was a collection of scenes showing funny babies, animals and accidents. Movie clip 3 and 4 was the opening scene of the movie Raiders of the Lost Ark and one of the last scenes of Back to the Future 1 and were supposed to increase the arousal (excitement) level of subjects. The survey questions were asked just before and after the movie was viewed, hence we were able to directly observe the effect of movies on emotional state levels. At the end of the experimental
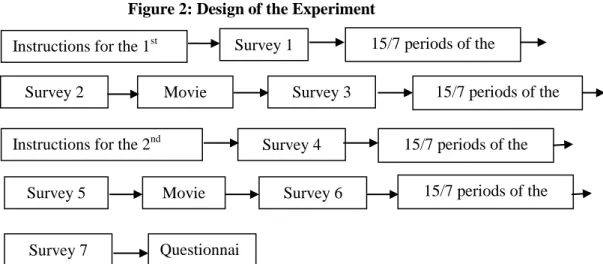
sessions, subjects were asked to fill in a questionnaire about background information such as their major, year of study and their monthly family income. You can see the detailed visual design of our experiment on Figure 2.
Finally, subjects were privately paid their total earnings which consisted of performance - related payoffs and show-up fee of 2 TL. The duration of the experiment varied between twenty and forty minutes. For a more detailed explanation of the experiment please see Appendix A which includes the instructions used in the experiment and Appendix B which contains sample questions for each task.
16
Figure 2: Design of the Experiment
15/7 periods of the task Survey 4
Instructions for the 2nd task
15/7 periods of the task
Survey 5 Movie Survey 6 15/7 periods of the task Survey 7 Questionnai
re Instructions for the 1st task
Survey 1 15/7 periods of the task Movie
17
CHAPTER 4
RESULTS
In this chapter, first we will look at the background information of 128 participants, such as their major, average monthly family income and the academic year they attend. Next, we will examine whether there is any evidence that confidence
enhances performance. Then we will look to see whether people form overestimated expectations about their past and future success rates. We will also look how beliefs were formed depending on the uncertain feedback received and other factors. Finally, we will analyze how movies affect mood, arousal and competence power and also the effect of movies on performance by looking at the difference in the success rates of subject before and after the movie clip was viewed.
3.1. Subjects’ Background
We should note that there is little variability in performances of our subject pool, which can be seen from the payoffs subjects earned. The maximum performance based payoff possible was 15 TL. However, the actual performance based earnings
18
ranged between 9 and 12 TL with average of 10 TL where only two persons earned 12 TL. The average monthly family income of our participants is 2 918 TL with minimum of 500 TL and maximum of 30.000 TL.
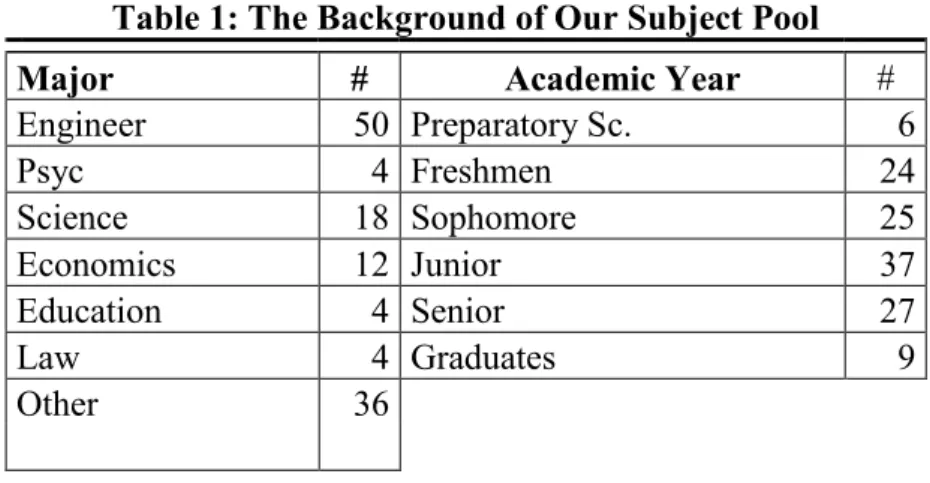
Table 1: The Background of Our Subject Pool
Major # Academic Year #
Engineer 50 Preparatory Sc. 6 Psyc 4 Freshmen 24 Science 18 Sophomore 25 Economics 12 Junior 37 Education 4 Senior 27 Law 4 Graduates 9 Other 36
Table 1 summarizes background profile of our subjects. Most of our subjects, namely 50 of them were engineers, who are expected to have strong technical
abilities. 36 of them selected “other” as their department which included arts
department, other social sciences as international relations, political science etc. We have preparatory school as well as graduate level students which added variability to our subject pool.
3.2 Does Confidence Enhance Performance?
As noted above we have, essentially, four measures of confidence:
- two measures of the cognitive confidence, estimates of past and future success rates (PastSuc and FutSuc respectively)
19
- a measure of the affective confidence, namely feelings of confidence power or competence (CPower)
- a measure of the behavioral confidence manifesting itself in choosing the high risk payoff levels (Risk)
FutSuc and CPower are measured before each block of questions, PastSuc and Cpower (again) after each block, and Risk before each question – the latter is
averaged over each block.
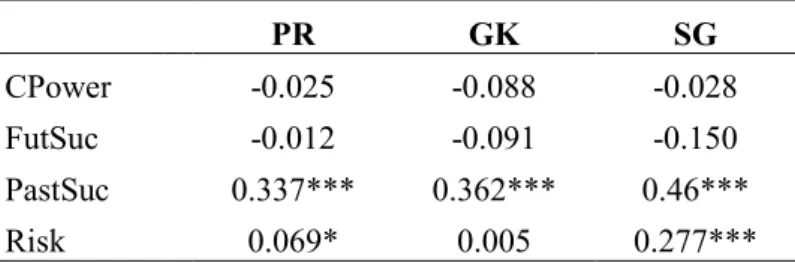
To answer the question of whether confidence enhances performance we examine if any of these measures of confidence predict performance in the block of questions subsequent to when confidence is measured using block by block simple OLS. Table 2 presents the results of this regression. In all of the tasks, we observe a significant positive relation between the stated number of perceived percentage of correct answers (PastSuc) and the true percentage of correct answer in that block. However, this, as we will discuss later, might be the result of subjects’ correct assessment of their past performance levels: we do find a significant over-estimation of past percentage of correct answers in the SG task, thus naturally we observe a greater positive coefficient for the subjects’ belief of percentage of past correct answers in the SG task in comparison to the PR and GK tasks.
Table 2: Confidence Measures' Effect on Performance
PR GK SG CPower -0.025 -0.088 -0.028 FutSuc -0.012 -0.091 -0.150 PastSuc 0.337*** 0.362*** 0.46*** Risk 0.069* 0.005 0.277*** * 10%, ** 5%, *** 1% significance levels
20
The signs of the Risk coefficients are positive for all tasks and significant for the PR and SG tasks, indicating that in these tasks the more people chose high risk payoff levels, the more successful they were. This result does indicate that indeed higher confidence level (in its behavioral measure form) affects performance positively. Furthermore, this result signals that selecting a risky payoff level might affect the efforts spent by subjects: those who chose more risky alternatives did exert more effort, thus they were more successful in their tasks. The fact that we observe the significance only for the PR and SG tasks strengthens this hypothesis: in the GK task, performance level is more related to the background of subjects rather than exerted effort level, whereas in the PR and SG tasks the performance can be enhanced if more attention, effort and concentration are applied to the task. The hypothesis of Compte and Postlewaite (2004) about risky alternatives hereby can be confirmed: the agents who are confident about themselves choose risky alternatives and this choice translates into more effortful task work, thus performance and the welfare of the agents are enhanced. The most robust result is for the SG task; hence if we want to generalize our finding, the further discussion about what factors might affect the choice of risky alternatives in the SG task is presented in the later sections.
This result is one the most important results of this thesis, since it partially confirms the CEP model. Although, FutSuc and CPower variables are not affective on performance levels, we clearly see that the behavioral measure of confidence level - Risk did have a significant positive effect on performance in two of our tasks. Of course, it can be argued which of the measures of confidence is the most
trustable. However, we believe that since the choice of payoff level is endogenous to the environment of the experiment and does not require subjects to answer explicit
21
questions about their beliefs and feelings, this measure of confidence is the most natural one extracted from the decisions and choices of the subjects.
In addition to OLS block by block regression, which is somewhat limited to fixed effect panel data, we use a different technique - logit panel regression – and find that some other variables are related to performance in all tasks. Logit
regression method is used for prediction of the probability of occurrence of an event by fitting data to a logit function logistic curve. It is a generalized linear model used for binomial regression.
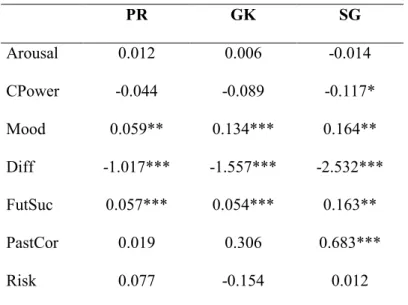
We estimate the following equation for each of the three tasks (Table 3): Pr(Suc) = f (Mood, Arousal, Cpower, Diff, FutSuc, PastSuc, Risk),
where Pr(Suc) is the probability of succeeding at correctly answering a question as a function of mood and arousal measured beforehand and confidence variables measured before, after or during the session. The Diff variable is a control variable that measures the difficulty level of each question determined after the experiment: it takes value 1 if the number of people answering that question was higher than 70% and value 0 otherwise. The variable Risk is also a binary variable, representing the behavioral measure of confidence and takes value 1 if the risky payoff level was selected and value 0 otherwise.
Table 3 summarizes the results of the logit regression. The coefficient of the mood variable is positive and significant with 3% significance level for all of the tasks. Generally, it seems that mood level has a positive impact on probability of successfully answering questions in all of the tasks; however, the coefficient of arousal variable is not significant in any of the tasks. Confidence power variable has
22
a negative coefficient for each task which suggests that the higher confidence power feeling is, the lower probability of success at that period becomes.
As a control variable, Diff has a negative coefficient and is highly significant in all of the tasks. Of more interest, the expected success rate (FutSuc) variable has a significant positive effect on probability of success at a 5% level in all of the three tasks. The variable denoted as PastCor – is the past percentage of correct answers until that period. This variable tells us about the skill level of our subjects. Only in the SG task we observe a significant predictive power of the PastCor variable on the probability of success. This could be expected since the Syllogism task was the one which required a specific skill level of logical reasoning thus subjects getting experienced and skill in this task could have performed better in subsequent rounds. In the other tasks, although the coefficients are positive, they are not significant.
Table 3: Logit Regression
Dependent Variable - Probability of Success
PR GK SG Arousal 0.012 0.006 -0.014 CPower -0.044 -0.089 -0.117* Mood 0.059** 0.134*** 0.164** Diff -1.017*** -1.557*** -2.532*** FutSuc 0.057*** 0.054*** 0.163** PastCor 0.019 0.306 0.683*** Risk 0.077 -0.154 0.012 * 10%, ** 5%, *** 1% significance levels
23
While the logit results for CPower are largely in agreement with the OLS block-by-block analysis reported above we find a difference for FutSuc and Risk variables in that they have different significances levels in the logit analysis and in some cases different signs. Whereas in the PR and SG tasks OLS regression suggests that the number of selected high risk payoff levels positively and significantly affects the number of successes at that period, we do not observe any significant results for Risk in logit regression (the signs are in agreement). In the logit regression we observe that FutSuc variable is highly significant and has positive coefficient in all of the tasks, however, OLS block-by-block regression does not confirm this result. This is largely due to the fact that in the OLS regression we do count for individual effects, whereas the logit regression is with a pooled data. Both regressions carry important implication for our analysis: OLS suggests that Risk is effective on performance, where as logit shows us that higher FutSuc increases the probability of answering the question correctly. In section 3.4 we will see that both of these measures of confidence are closely related to each other, thus giving us these results.
3.3 Are People Overconfident?
The analyses reported in the previous section are mostly correlational. Hence, it is quite possible that participants who reported higher past levels of success and/or greater expectations of success in the future are those who are actually more skilled and hence subsequently get more questions right; the significant positive relationships observed may therefore simply reflect accurate perceptions of skill-levels. But Compte & Postlewaite (2004), and several other authors, suggest that people are generally biased towards overconfidence, so is it
24
true that in this study people make over assessments of their past and future performance?
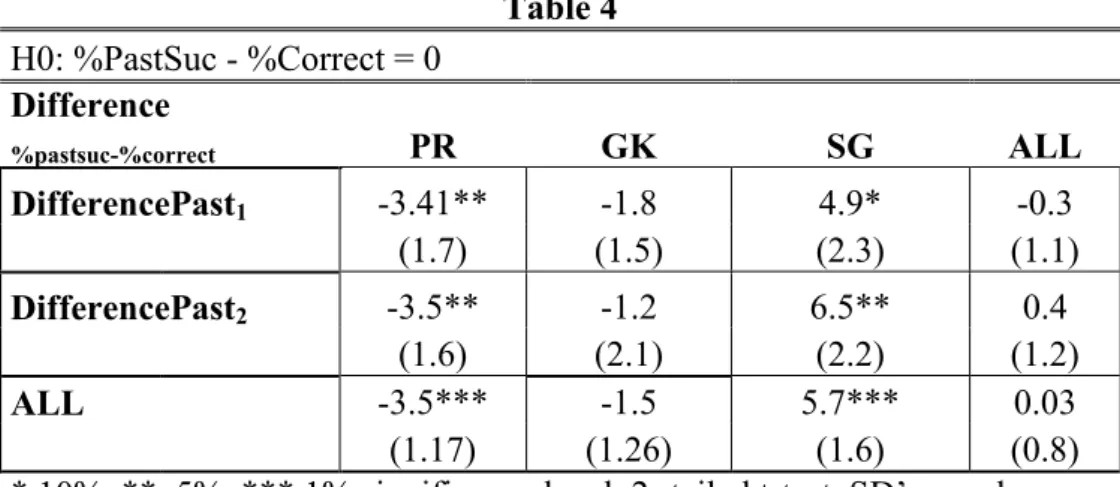
Our PastSuc variable is the answer to the question “How many of the previous 15 (or 7) questions do you think you got right?” divided by the number of questions in that block. We calculate the under and overconfidence scores shown in Table 4 by task and block by subtracting the appropriate actual percent correct attained by each participant from his or her PastSuc estimate. The resulting scores show overconfidence when they are positive and underconfidence when they are negative.
For the Picture Recall Task, we observe that in both of the blocks participants significantly underestimated their percentage of correct answers by around 3.5% points. However, in the General Knowledge task although we observe a similar tendency towards underconfidence, this bias was not statistically
significant, so we conclude that the participants were accurate enough in estimating their success rate in previous periods. In the Syllogism task we observe a different pattern in belief formation: here the participants overestimated their rate of success in previous periods by around 5.7% points.
Table 4 H0: %PastSuc - %Correct = 0 Difference %pastsuc-%correct PR GK SG ALL DifferencePast1 -3.41** -1.8 4.9* -0.3 (1.7) (1.5) (2.3) (1.1) DifferencePast2 -3.5** -1.2 6.5** 0.4 (1.6) (2.1) (2.2) (1.2) ALL -3.5*** -1.5 5.7*** 0.03 (1.17) (1.26) (1.6) (0.8)
* 10%, ** 5%, *** 1% significance level, 2- tailed t-test, SD’s are shown in parenthesis
25
These results are not particularly supportive of CEP. First, in CEP people supposedly discount past failures relative to successes and this should result in a general overconfidence bias. It can be clearly seen in Table 4 that there can be significant negative, positive or no bias depending on the task. Second, there is no bias for general-knowledge questions – this implies that the explanation for the positive correlations between confidence and performance that we found for this task in Section 3.2 are due to accurate perceptions of skill rather than CEP.
However, in the other tasks we cannot say that people perceived the true percentage of correct answers correctly. Thus, positive relationship found in Section 3.2
between PastSuc and percentage of correct answers might be due to some other factors. Overall, across tasks we do not observe that people have biased perceptions about their past performance: according to Table 4, there is no evidence that people discount past failures with a lower rate than successes as Compte & Postlewaite (2004) and other authors suggest.
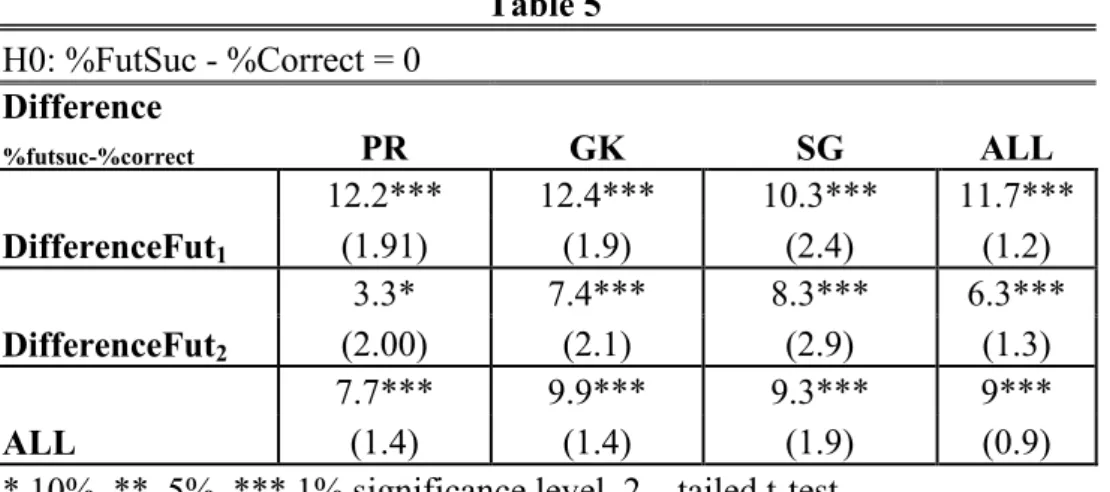
Next, we analyze how participants’ expectations about their future success differed from their actual success rates. FutSuc is the answer of participants to the question “How many of the next 15 (or 7) questions do you think you will get right?” divided by the number of questions in that block. By subtracting the actual percentage correct obtained we produce under/overconfidence scores as above and these are shown in Table 5.
26
By looking at Table 5, we can see that in all of the blocks there was a significant overestimation of percentage of correct answers. The greatest difference between expected and realized percentage of correct answers is for the General Knowledge and Syllogism tasks which is around 9.5% difference. In the Picture Recall task there was also a significant overestimation of future percentage of correct answers with the average of 7.7%.
One of the interesting findings that Table 5 presents to us is that in the first block when participants were still unfamiliar with the task, the difference between expected and realized performance is greater than in the second block. Formal statistical tests confirms this result with 1% significance level (Wilcoxon rank-sum and t-test). We can infer from this observation that as the participants became
acquainted with the task and received some feedback about their performance in that task, the overconfidence about future performance level started to decrease but did not disappear entirely. Note that the example questions given at the start of the experiment were very easy thereby raising initial expectations of success to
Table 5 H0: %FutSuc - %Correct = 0 Difference %futsuc-%correct PR GK SG ALL DifferenceFut1 12.2*** 12.4*** 10.3*** 11.7*** (1.91) (1.9) (2.4) (1.2) DifferenceFut2 3.3* 7.4*** 8.3*** 6.3*** (2.00) (2.1) (2.9) (1.3) ALL 7.7*** 9.9*** 9.3*** 9*** (1.4) (1.4) (1.9) (0.9)
27
unrealistically high levels – possibly since feedback was only partial it was insufficient to fully dampen these high expectations.
One of the assumptions that Compte & Postlewaite (2004) base their model on is that people perceive their past performances incorrectly and are overconfident:
There is also ample evidence that individuals have distorted recollection of past events and distorted attributions of the causes of success or failure. Recollection of good events or successes is typically easier than recollection of bad ones or failures.
Successes tend to be attributed to intrinsic aptitudes or effort, while failures are attributed to bad luck.
In our data, we find out that the perception of the past performance is dependent on the environment: whereas in the logical reasoning task we did observe significant overconfidence, the underconfidence and accurate perception of true percentage of correct answers were evident in the short and long term memory tasks respectively. Hence, we disagree with the idea that “recollection of … successes is typically easier than recollection of … failures” in most situations, and claim that this
phenomenon is dependent on the setting. On the other hand, we empirically confirm the later part of Compte and Postlewaite’s assumption that people tend to think of successes as a product of their effort and skill, whereas failures are attributed mainly to some external factors as bad luck. This hypothesis can be verified when we compare and contrast Table 4 and Table 5: even when people are accurate or
underconfident in their beliefs about past, they do believe that in the future they will be more successful. Although in both PR and GK tasks the belief about the
performance in the first block is not over-rated, subjects do report very high rates of expected success for the second block of questions. This is a direct indication that
28
with uncertain feedback people are able to assess their past performance truthfully (or underrate their actual performance) in some settings attributing negative
feedbacks to some external factors and be overoptimistic about their future success rates not taking into account that past performance might be a good indication of their skill level. In the subsequent section, we discuss the implications of having over-rated expected success rate showing that in two of our three tasks this does influence the resulting risk taking behavior.
3.4 Where Does Confidence Come from?
In this section we will look what might affect the confidence levels of our subjects for each separate measure of confidence, namely FutSuc, PastSuc, Risk and CPower. Thus, we will determine the factors affecting confidence and specifically the
differences between the determinants for each separate confidence measure. We will do block-by-block analysis, taking into account emotional state levels that were stated before the block has started and the other variables as feedback, number of success and average difficulty level encountered in that block.
First we look at the most interesting confidence measure - the risk level selected at each period and see how confidence power feeling, mood, arousal levels, expected future and assessed past success rates, received positive or negative
feedback, the number of correct answers as an indication of skill level and the average past difficulty levels affect the number of risky payoff levels chosen in that block.
29
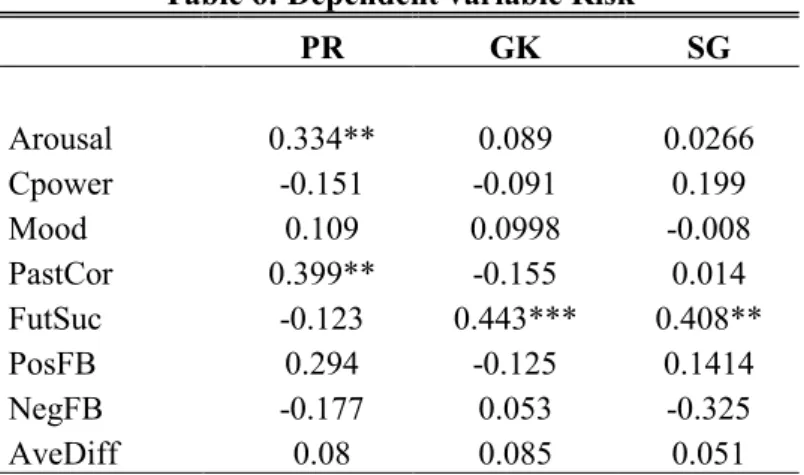
As we can see from Table 6, in two of the three tasks, FutSuc variable seems to be positively related with the choice of risky alternative indicating that in the cases when people who estimated their future success rate highly before a block has started chose risky payoff level more frequently than the ones which were not confident about their future performances.
Table 6: Dependent variable Risk
PR GK SG Arousal 0.334** 0.089 0.0266 Cpower -0.151 -0.091 0.199 Mood 0.109 0.0998 -0.008 PastCor 0.399** -0.155 0.014 FutSuc -0.123 0.443*** 0.408** PosFB 0.294 -0.125 0.1414 NegFB -0.177 0.053 -0.325 AveDiff 0.08 0.085 0.051 * 10%, ** 5%, *** 1% significance levels
This is an important result that confirms that in two of our three tasks two measures of confidence, namely cognitive and behavioral confidence, are aligned with each other. As it was discussed in the previous section, people do have over-rated assessment about future success rates that does not dampen with experience and feedback. Hence, we can now conclude that this bias translates into more risk-taking behavior in the GK and SG tasks. For the PR task, only the Arousal and
PastCor variables have significant and positive signs and the other variables mainly
have expected signs such as NegFB, PosFB, Mood although not significant
coefficients. Negative feedback received in the past affects the risk taking behavior negatively (decreases behavioral measure of confidence) and positive feedback received fosters risk taking behavior.
30
Whereas higher confidence about future success rate does predict the behavioral measure of confidence (risk taking behavior), we do not see any significant effect of confidence power feeling before the block has started on the number of risky alternatives chosen. One explanation that we can suggest is that the answer to the question “How confident do you feel right now?” was interpreted differently by the subjects: they might infer their confidence feeling from outside factors that happened before they came to the experiment or a general level of confidence that they usually felt. The further analysis will show us whether
confidence power and other measures of confidence such as FutSuc and PastSuc are positively correlated with each other.
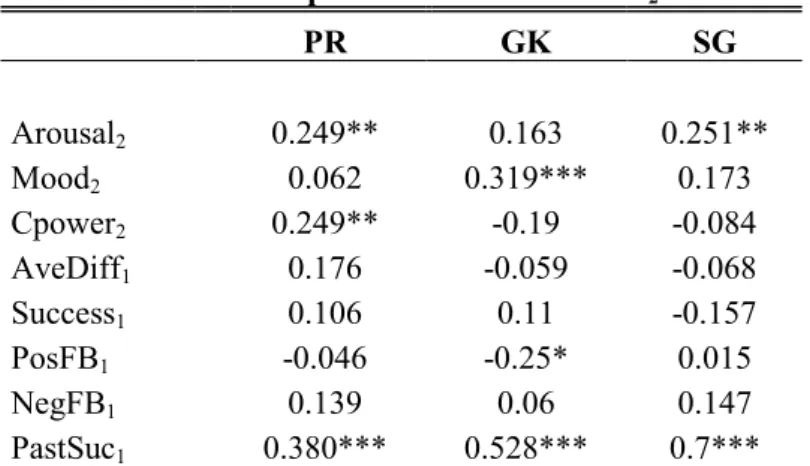
Next, we discuss how the expectations about the future success rates are formed. With this purpose we look how the FutSuc variable at the second block is affected by emotional state levels at that block (Mood, Arousal, Cpower) and average difficulty level (AveDiff), percentage of successes, number of positive (PosFB) & negative feedbacks (NegFB) and the stated percentage of past success rate (PastSuc) of the previous block. The reason for this kind of selection of
variables is because we believe that before actually seeing the questions, subjects did not know what they will encounter, thus their expectations about the future might not be realistic. Hence, we choose our dependent variable FutSuc only from the second block observations. We can speculate that the expectations about the performance in the second block could be significantly affected by the feedbacks and difficulty level they encounter in the first bock.
According to Table 7, most of the coefficients of our potential predictors are not significant and have different signs. The consistent coefficients are of Arousal
31
(all positive and two of them significant), Mood (all positive and one is significant) and PastSuc variable (all positive and significant with 1% level). In the Picture Recall task we also see a significant relationship between confidence power feelings and expected future success rate. One of the notable observations here is that arousal and mood levels are good predictors of one of the cognitive measures of confidence – the expected future success rate. This observation tells us that the more people are aroused and in a higher mood state, they will assess their future performance more optimistically. This finding is consistent with the findings of Johnson & Tversky (1983) and Wright & Bower (1992) stating that induced happy mood increases the stated probability of good things happening and decreases the adversity against risk.
Table 7: Dependent variable Futsuc2
PR GK SG Arousal2 0.249** 0.163 0.251** Mood2 0.062 0.319*** 0.173 Cpower2 0.249** -0.19 -0.084 AveDiff1 0.176 -0.059 -0.068 Success1 0.106 0.11 -0.157 PosFB1 -0.046 -0.25* 0.015 NegFB1 0.139 0.06 0.147 PastSuc1 0.380*** 0.528*** 0.7*** * 10%, ** 5%, *** 1% significance levels
The other interesting point in our results is that expected future success rate variable is positively and significantly correlated with the last stated past success rate variable. People being confident about their past success rates, which we saw that was accurate enough for the General Knowledge task, were also confident about their future performances. In the Syllogism task, we can infer that people
32
overestimating their past performance levels tended to state higher expected probabilities of future success rate. For the other tasks there is no clear explanation of why people who were accurate about (or underestimating) their performances would state higher expectations about future performance. One justification of the consistent positive relationship between PastSuc and FutSuc would be the individual effects.
Next we discuss how the subjective estimate of past success rate is affected by other factors such as emotional state levels, average difficulty encountered,
percentage of correct answers, positive and negative feedback received in that block. This analysis will help us to identify the mechanisms under which the beliefs about person’s own performance are formed.
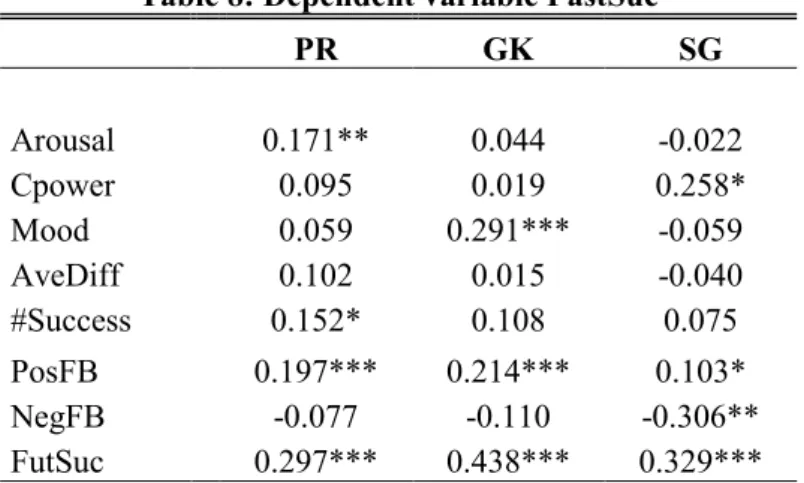
From Table 8, we see the changing effects of emotional state levels on
beliefs about past success rate: in the PR task arousal, in the GK task mood level and in the SG task confidence power feelings seem to positively affect beliefs about past success rates. This positive relationship between emotional state levels and PastSuc are confirmatory of the studies conducted before: we already know that in most cases, increased emotional valence increases the optimism of subjects about future and past uncertain events.
33
Table 8: Dependent variable PastSuc
PR GK SG Arousal 0.171** 0.044 -0.022 Cpower 0.095 0.019 0.258* Mood 0.059 0.291*** -0.059 AveDiff 0.102 0.015 -0.040 #Success 0.152* 0.108 0.075 PosFB 0.197*** 0.214*** 0.103* NegFB -0.077 -0.110 -0.306** FutSuc 0.297*** 0.438*** 0.329*** * 10%, ** 5%, *** 1% significance levels
Another interesting and expected result of this analysis is that the number of positive feedbacks received always positively affects the beliefs about the past success rate. At the same time as expected, the coefficients of negative feedbacks have the negative sign in all tasks and it is significant with p-value less that 5% in the SG task. As a result we can firmly accept that uncertain feedback about person’s performance plays a crucial role in formation of beliefs about one’s own past
success rate.
The other significant variable that has a positive relationship with the belief about past success rates is the expectations about the future performance. The last two tables indicate that FutSuc and PastSuc variables are highly correlated and both of these cognitive measures of confidence are dependent on individual effects: people who perceive probabilities differently tend to state their estimates about success rates accordingly. People who are confident about their number of successes at the beginning of the block tend to state higher percentage of successes at the end of the block.
34
Interestingly enough we do not observe a significant effect of average difficulty level of a block on the beliefs about past performance. Subjects did not base their beliefs on the nature of the questions encountered or the number of correct answers they have given (their implicit skill level). Instead they took into
consideration the uncertain feedbacks received when they formed beliefs about past performance. In most of the cases, both of the cognitive measures of confidence were correlated with emotional state variables, which confirm the previous findings that increased emotional state levels (in terms of intensity and valence) affect the way people perceive probabilities about future and past events.
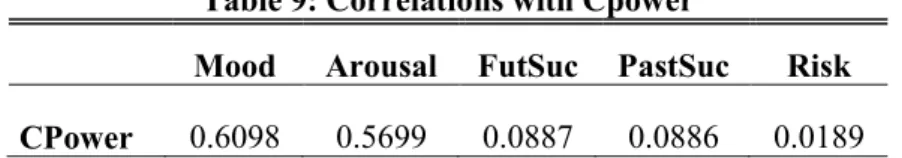
Lastly, we look how confidence/competence power feeling of our subjects is related to the other emotional state and confidence variables. Table 9 shows the Pearson product moment correlation coefficients between confidence power feeling and the other variables. The high correlations are observed between emotional state variables: confidence power is predictive by mood and arousal levels by 61% and 57% points respectively. On the other hand, we do not see any high correlation coefficients between the other confidence measures. The answers to the questions “How many of the next 15 (or 7) questions you think you will get right?” and “How confident do you feel on the ten-point scale?” asked in the same questionnaire were not highly predictive of each other. The same observation is true about the
relationship between PastSuc and CPower variables. On average only 9% variation in confidence power variable can be explained by the cognitive measures of
35
We also measure how the number of risky payoff levels chosen in the block is related to the confidence power feeling reported at the beginning of the block. Again, there is not much correlation between these variables: feeling confident about one’s self did not increase the probability of choosing the risky payoff level
in that block.
This correlational analysis demonstrates that confidence power variable is indeed an affective state variable rather than behavioral (approach) or cognitive (probabilistic) measure of confidence. One of the arguments of Compte and Postlewaite (2004) is that the welfare of agents who feel confident will increase (assuming that the welfare is directly linked to the payoff received), since confident agents will choose high risk payoffs more often, thus earning more at the end in average. In our experiment, the confidence power feeling of one’s self does not increase the probability of choosing high risk payoff levels or change the perception of subjects about future or past success rates as Compte and Postlewaite (2004) predicted. This is an important result telling us that risk taking behavior is only affected by the people’s perceptions about probabilities of success in the future, rather than just their feelings of confidence about themselves or the tasks they are overtaking.
Table 9: Correlations with Cpower
Mood Arousal FutSuc PastSuc Risk
36
3.5 Effects of Movies
Table 10 summarizes the effect of each movie clip on mood, arousal and confidence power variables. Since we have asked survey questions just before and after the movie clip was viewed we expect that the changes in reported emotional state variables could only be caused by movies viewed. Table 10 tells us that in general, Movie 2 (the collection of funny scenes) and Movie 4 (the final scene from Back to the Future 1) have a significant positive influence on all of three variables. Movie 3 is unsuccessful in affecting any of the emotional state variables. Whereas Movie 1 (Mr. Bean) does not have any significant result in either changing mood or arousal level but does have a marginally significant effect on CPower. Since Movie 2 was specifically aimed to increase the mood level of participants, it is natural that the increase in mood variable would be largest for Movie 2 (or Movie 1). However, Movie 2 also significantly influenced arousal and confidence power levels.
Similarly, Movie 4 also was effective in increasing Mood and CPower despite being principally designed to increase arousal levels. It therefore seems that these three variables are closely related, which was verified in the previous section with high correlations among emotional state variables.
37
Table 10: Effect of Movies on Emotional State Variables
H0: Difference in Emotional States before and after Movie = 0 (each variable measured on a 10-point scale)
Mood Arousal CPower
Movie 1 0 0.044 0.250* (1.4) (1.03) (1.04) Movie 2 0.950*** 0.683*** 0.767*** (1.66) (1.52) (1.23) Movie 3 0.222 0.093 0.278 (1.09) (1.25) (1.24) Movie 4 0.378*** 0.378*** 0.284** (1.06) (1.22) (1.1)
* 10%, ** 5%, *** 1% significance level, 2-tailed t-test
In order to understand the possible effects of movies on performance we also analyze whether the percentages of correct answers in a block before and after the movie clip was viewed was different from each other. Table 11 summarizes these results. We see a significant improvement in performance for the Picture Recall task after viewing Movie clips 2 and 4. Note that, both of these movie clips were
affective in enhancing emotional state levels of our subjects. On the other hand, Movie clip 1, which did not influence neither of Mood, CPower or Arousal, seems to have some negative effect on performance but significant only in the case of the Picture Recall task. Interestingly, we do not see any significant results for the General Knowledge and Syllogism tasks. Only the performance of participants engaged in Picture Recall task seems to have been significantly affected by movies.
38
Table 11: Effect of Movies on Performance H0: %Correctaftermovie - %Correctbeforemovie = 0
PR GK SG
Movie 1 -9%** -0.50% -10.30%
Movie 2 7%* 0% 8.90%
Movie 3 0% 5.90% 5%
Movie 4 5%* -2.90% 1%
* 10%, ** 5%, *** 1% significance level, 2-tailed t-test
The last two tables tell us the following: in the Picture Recall task the movies that were engaging for the subjects were also effective in improving the performance. Hence, there is evidence that improved emotional state level via movie clips also enhances performance in the PR task. The nature of the PR task required high level of concentration and short term memory ability. The engaging movie clips that were viewed in the middle of this task seem to have an effect of “mind clearing” which in turn improved the task-required aptitudes. This result combined with Table 2 results, indicate that the performance in the PR task is significantly improved with enhanced emotional state levels and the number of risky choices selected. Both of these predictors might possibly affect the effort level and/or motivation of our subjects influencing the resulting performance. Although, the performance in the SG task is not affected by emotional state variables, it is affected by risk taking behavior of our subjects: again meaning that as subjects chose more risky payoff levels, they exerted more effort into the task. Because of the nature of the task, the GK task was not much affected either by the movies (translated into emotional state levels) or risk-taking behavior since as mentioned before in this task the amount of exerted effort would not change performance much.
39
CHAPTER 5
CONCLUSION
Our evidence partially support CEP: in two of our tasks, people who choose more risky options (behaviorally confident people) and those who think that they will get more questions right in the next block are more likely to end up with better
performances. Furthermore, the enhanced emotional state level (via movie clips) translates into better performance across blocks in our PR task. This results is also supportive of previous findings by Isen (2001) and Isen & Erev (2002), suggesting that better moods improve recall ability.
In the examples that Compte and Postlewaite (2004) presented in their paper, they argue that:
Whether it's a lawyer presenting a case to the Supreme Court, a professional golfer approaching a game winning putt or an academic giving a job market seminar, the probability of success diminishes if legs are trembling, hands are shaking, or breathing is difficult.
This is definitely not the case for our cognitive tasks: in neither of short term, long term memory or logical reasoning tasks we observe that feeling of confidence
40
taking behavior, nor with the expected future success rate. It is an emotional state variable closely related to the other two emotional state variables, which only seem to enhance performance when mood enhancing movie clip was viewed in the middle of the PR task together with other emotional state variables. However, we should note here that the examples given by Compte and Postlewaite are drastically different from our tasks. Hence, it would be expected that the predictions made by them would not be evident in our data.
The other prediction by Compte and Postlewaite (2004) that overconfident people will choose higher risky options is verified in our analysis. The people with higher expectations about future success tend to choose risky options with higher frequency. This might in turn translate into greater number of successes in the PR and SG tasks as our OLS regression suggests as well as confidence might manifest both as more effort (and possibly success) and as more risky choice. The nature of these two tasks requires more motivation and concentration. The careful analysis of all of the results suggest that people feeling confident about their future success rates are likely to choose higher number of risky options, which in turn increases their motivation/effort levels resulting in a better performance in two of our three tasks where effort levels are important. The findings by Nowell and Alston (2007) about overconfident students spending less effort on their courses and performing poorly is not supported in our data. The reason for this is because Nowell and Alston’s
research did not incorporate the effect of overconfidence on choice of risk levels, which in turn might affect effort/motivation resulting in better performance (the students who by failing the course are under more risk than the others could be better motivated to spend more effort on their course works). The further research
41
can concentrate on the seconds spent contemplating each question and analyze whether higher confidence about future and more risk taking increases the time spent on each question. For now, we can only speculate that this is the case.
Another interesting result that we obtained from our data is subjects’
contradictory assessment of past performance across tasks: in the Picture Recall task significant under-rating, in the General Knowledge task accurate assessment and in the Syllogism task over-rating of past success rates are evident. This contradicts the findings of vast literature about the phenomenon of discounting past failures
explained by availability heuristics – the ability to access good memories better than the bad ones (Tversky & Kahneman, 1973; Ross & Sicoly, 1979). The one reason for this result might be the probabilistic feedback that we have given our subject, although this does not account for why in different tasks we observe different type of belief formation. Most likely the differences were due to the nature of the tasks in terms of difficulty level and cognitive abilities they required.
Although the bias of discounting past failures did not occur in all of our tasks, the bias in forming expectations about future success rates is evident without exception in all three of our tasks and blocks. The magnitude of this bias is greater in the first block than in the second one indicating that as people get acquainted with the task, the difference between the expectations about future success rate and actual percentage of correct answers decreases but does not disappear entirely. It is an interesting observation that although in two of our tasks subjects do not overestimate their past success rates, they do believe that they will do better in the future: this is might be an example of a general accepted phenomenon that bad events are
42
attributed to bad luck, whereas good events are thought to be a product of effort and skill level.
The other interesting observation that we come across in our data is that in the state of higher mood, arousal and confidence power, subjects tend to report higher probabilities of success for future and past performance. This is supportive of the findings by MacLeod & Campbell (1992) and Wright & Bower (1992)
suggesting that probabilities are viewed differently in different emotional states, which also affects risk taking behavior. In our tasks, emotional state level variables had a positive predictive effect on FutSuc variable, which in turn fostered more risk taking behavior.
One of the determinants of the performance of subjects in the Picture Recall task was enhanced emotional state level. We could identify that by looking at the effect of our movie clips on emotions and comparing the percentage of correct answers in the block before and after the movie clip was viewed. We discovered that Movie clips 2 and 4 (emotionally the most engaging ones) did act as “mind clearing” factor and improved the performance in the second block. Thus, we may conclude that in the decision theoretic environments that require short term memory ability, the task is best performed mixed with engaging activities.
A further improvement to the design could include an exogenous
manipulation of confidence via item difficulty. The difficulty levels obtained from pilot sessions could be the control variables such that people facing first easy (hard) questions would be overconfident (underconfident) and thus when facing the same questions in the next round, we could test if subjects who were more confident would score more than those less confident. One other limitation of our design might
43
be due to the closeness of payoffs for risky and safe options in the PR and GK tasks: 0.20 TL versus 0.22, 0.23 and 0.24 TL. With higher amounts and more distant payoff levels (as in the SG task) it is possible that we can get more robust results in terms of risk taking decisions and effort/motivation employed.