DETERMINANTS OF HEALTH EXPENDITURE IN OECD COUNTRIES AND THE INCOME ELASTICITY
A Master’s Thesis by GÜLTEN ŞANLIALP Department of Economics Bilkent University Ankara September 2008
DETERMINANTS OF HEALTH EXPENDITURE IN OECD COUNTRIES AND THE INCOME ELASTICITY
The Institute of Economics and Social Sciences of
Bilkent University
by
GÜLTEN ŞANLIALP
In Partial Fulfillment of the Requirements for the Degree of MASTER OF ARTS in THE DEPARTMENT OF ECONOMICS BILKENT UNIVERSITY ANKARA September 2008
I certify that I have read this thesis and have found that it is fully adequate, in scope and in quality, as a thesis for the degree of Master of Arts in Economics
--- Asst. Prof. Ümit Özlale Supervisor
I certify that I have read this thesis and have found that it is fully adequate, in scope and in quality, as a thesis for the degree of Master of Arts in Economics
--- Prof. Hakan Berument
Examining Committee Member
I certify that I have read this thesis and have found that it is fully adequate, in scope and in quality, as a thesis for the degree of Master of Arts in Economics
---
Asst. Prof. Levent Özbek (Ankara University, Department of Statistics) Examining Committee Member
Approval of the Institute of Economics and Social Sciences
--- Prof. Erdal Erel
iii
ABSTRACT
DETERMINANTS OF HEALTH EXPENDITURE IN OECD COUNTRIES AND THE INCOME ELASTICITY
Şanlıalp, Gülten Master of Economics Supervisor: Asst. Prof Ümit Özlale
September, 2008
After Newhouse's seminal paper published in 1977 the determinants of health expenditure has been studied both by academia and policymakers. The main result of these studies is that income is the most important factor explaining the health expenditure. This thesis aims to reveal the non-income determinants of health expenditure, the magnitude of the income elasticity of health expenditure in OECD countries and to explore whether health expenditure is more elastic in high income countries. Health can be seen as a necessity if the income elasticity is below unity and as a luxury good if the income elasticity is above unity. An interpretation of health being a luxury good is that health expenditure would increase at a higher rate than GDP and the public health sector have high priority among the goals of economic and social development. Panel data on GDP per capita, dependency rate and the public share in health expenditure have been used to investigate the
iv
determinants of total health expenditure per capita of OECD countries for the period 1975-2006. For a richer analysis linear and log-linear functional forms are employed. Linear functional form reveals that 100 US$ increase in GDP per capita raises health expenditure per capita by 10.99 US$. Log-linear functional form yields income elasticity much higher than unity. After sorting out the OECD countries as high-income and low-high-income, it is found that health is more elastic in high-high-income countries.
v
ÖZET
OECD ÜLKELERİNDE SAĞLIK HARCAMASI BELİRLEYİCİLERİ VE SAĞLIĞIN GELİR ESNEKLİĞİ
Şanlıalp, Gülten
Yüksek Lisans, İktisat Bölümü Tez Danışmanı: Yrd. Doç. Dr. Ümit Özlale
Eylül, 2008
Newhouse’un 1977’de yayınlanan ve literatürde yeni ufuk açan makalesinden sonra sağlık harcamalarının belirleyicileri hem akademisyenler hem de politika belirleyenler tarafından araştırılmıştır. Bu çalışmaların temel sonucu, sağlık harcamalarını açıklayan en önemli faktörün gelir olduğudur. Bu tez, OECD ülkelerindeki sağlık harcamasının gelir dışındaki belirleyicilerini, sağlık harcamasının gelir esnekliğini tahmin etmeyi ve yüksek gelirli ülkelerde sağlık harcamasının daha esnek olup olmadığını belirlemeyi amaçlamaktadır. Sağlık, sağlık harcamasının gelir esnekliği birin altındaysa gereksinim, üzerindeyse lüks mal olarak değerlendirilebilir. Sağlığın lüks mal olması, sağlık harcamasının GSYİH’den daha büyük bir oranla artacağı anlamına gelir ve bu da demektir ki kamu sağlık sektörü ekonomik ve sosyal gelişim hedeflerinin içinde yüksek öneme sahiptir. 1975-2006 yılları arasında OECD ülkelerinin sağlık harcamalarının belirleyicilerini bulmak için
vi
kişi başına GSYİH, nüfusun bağımlılık oranı ve sağlık harcamalarında kamu payı verileri kullanılmıştır. Daha zengin bir analiz için linear ve log-linear modeller tahmin edilmiştir. Linear modelin sonuçlarına göre, kişi başına GSYİH’de 100 US$ artış kişi başına sağlık harcamasını 10.99 US$ artıracaktır. Log-linear modelin sonuçlarına göre sağlık harcamasının gelir esnekliği birden büyüktür. OECD ülkeleri, kişi başına gelirleri kıyaslanarak düşük ve yüksek gelirli ülkeler olarak sıralandığında sağlık harcamasının yüksek gelirli ülkelerde daha esnek olduğu bulunmuştur.
vi
ACKNOWLEDGEMENTS
I would like to thank to Prof. Ümit Özlale for his supervision through my study, helpful comments and time he devoted for shaping this thesis.
I owe special thanks to my family for encouraging me to start, motivating me to continue and enforcing me to finish my graduate study.
I would like to thank to all of my friends who motivated and supported me through my graduate study and devoted their time to help me.
vi
TABLE OF CONTENTS
ABSTRACT ... iii
ÖZET ... v
ACKNOWLEDGEMENTS ... vii
TABLE OF CONTENTS ... viii
LIST OF TABLES ... ix
CHAPTER 1: INTRODUCTION ... 1
CHAPTER 2: LITERATURE REVIEW ... 8
CHAPTER 3: DATA AND ECONOMETRIC METHODOLOGY ... 26
3.1. Hausman Test: ... 27
3.2. Regression Outputs: ... 28
CHAPTER 4: CONCLUSION ... 32
BIBLIOGRAPHY ... 34
APPENDIX 1: STUDIES ESTIMATING INCOME ELASTICITY ... 37
APPENDIX 2: STUDIES INCLUDING PUBLIC SHARE ... 38
ix
LIST OF TABLES
Table 1. HE per capita and GDP per capita in OECD countries in 2005 ... 4 Table 2. Fixed Effect Model Estimation Results “Dependent Variable is HE” ... 29 Table 3. Fixed Effect Model Estimation Results “Dependent Variable is ln(HE)” ... 29 Table 4- Fixed Effect Model Estimation Results For Low Income Countries ... 30 Table 5- Fixed Effect Model Estimation Results For High Income Countries ... 31
1
CHAPTER 1
INTRODUCTION
There has been a dense literature that has sought to determine the main factors explaining the increase in health expenditure in the recent decades. Early studies used cross-sectional regressions (Newhouse, 1977; Parkin et al, 1987.; Gerdtham et al., 1992) while more recent ones utilized panel data models (Gerdtham, 1992; Hitiris and Posnett, 1992; Hansen and King, 1996; Blomqvist and Carter, 1997; Gerdtham et al. 1998; Roberts, 2000; Bac and Le Pen, 2002). Although the original empirical model by Newhouse has been improved, the main result that emerges from these studies is largely unaffected: aggregate income appears to be the most important factor explaining health care expenditure. However, such studies do not reach a consensus about the income elasticity of health expenditure. While some studies have found the elasticity coefficient to be greater than one, others have reported inelastic estimates.
Most of the studies on the determinants of health care expenditure rely on international comparisons based on OECD data. First group of studies (cross-sectional) explores the relationship between health care expenditure and per capita
2
income, conditional on some country-specific control variables, such as dependency rate, urbanization, extent of public sector provision, number of practicing physicians and so on. The main results of these studies are the following: aggregate income is the most important component of health care expenditure; the inclusion of control variables does not affect the explanatory power of GDP and the value of income elasticities. Second group of studies exploit the panel structure of the OECD data. These studies test the presence of country specific and time specific effects, using a relationship similar to that used in cross-sectional studies. The main results of this stream of research are the following: aggregate income is the most important component of health care expenditure; the inclusion of country-specific control variables does not affect the explanatory power of GDP and the value of income elasticity; there exists either a country-specific or time specific effect in both random and fixed effects model specification.
Most of the OECD countries have experienced a substantial increase in the proportion of GDP that they allocate to health spending. For the period 1975 to 2006, the ratio of average total health expenditure to average GDP of 18 OECD countries rose to 9,52 from 6,69. The most recent health data of OECD countries is available for the year 2006. In 2006, average health spending per capita in OECD countries is 2.824 US$, where Turkey has the lowest health spending per capita with 591 US$ and the United States has the highest health spending per capita with 6.714 US$. When we look at the public share in total health expenditure, US and Mexico have a share below 50% and the remaining OECD countries have above 50% i.e. the main source of health funding in all OECD countries except the United States and Mexico is public sector.
3
Graph 1. Health expenditure per capita, public and private, OECD countries, 2006
0 1.000 2.000 3.000 4.000 5.000 6.000 7.000 8.000 U S N o r w a y S w it z e r la n d L u x C a n a d a A u st r ia B e lg iu m F r a n c e N L G e r m a n y D e n m a r k Ic e la n d S w e d e n Ir e la n d A u st r a li a O E C D U K F in la n d It a ly G r e e c e J a p a n S p a in N e w Z . P o r tu g a l H u n g a r y C z e c h R e p . K o r e a S lo v a k R e p . P o la n d M e x ic o T u r k e y USD PPP Public Private
Source: OECD Health Data 2008, June 2008.1
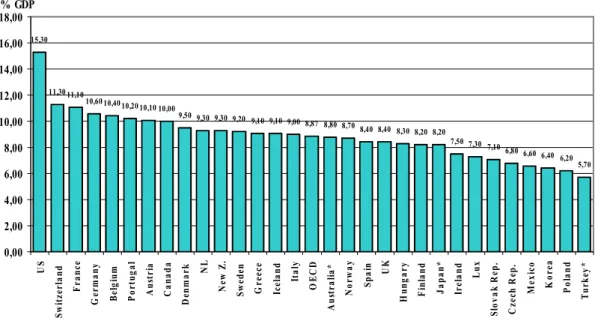
The average health spending in 2006 accounted 8.9% across OECD countries. The country that spends the most on the health as a share of its economy is the United States, which allocated 15,3% of its GDP to health in 2006. Switzerland follows with a share of 11.3%, France with a share of 11,1% and Germany with a share of 10,6%. Total health spending accounted for 5.7% of GDP in Turkey in 2005 which is the lowest value among OECD countries.
1
Data are expressed in US dollars adjusted for purchasing power parities (PPPs), which provide a means of comparing spending between countries on a common base.
4
Graph 2. Health expenditure as a share of GDP, OECD countries, 2006
15,30 11,30 11,10 10,60 10,40 10,20 10,10 10,00 9,50 9,30 9,30 9,20 9,10 9,10 9,00 8,87 8,80 8,70 8,40 8,40 8,30 8,20 8,20 7,50 7,30 7,10 6,80 6,60 6,40 6,20 5,70 0,00 2,00 4,00 6,00 8,00 10,00 12,00 14,00 16,00 18,00 U S S w it z e r la n d F r a n c e G e r m a n y B e lg iu m P o r tu g a l A u st r ia C a n a d a D en m a r k NL N e w Z . S w e d e n G r e e c e Ic e la n d It a ly O E C D A u st r a li a * N o r w a y S p a in UK H u n g a r y F in la n d J a p a n * Ir e la n d L u x S lo v a k R e p . C z e ch R ep . M e x ic o K o r e a P o la n d T u rk ey * % GDP
Source: OECD Health Data 2008, June 2008.2
Health spending tends to rise with income; in general, OECD countries with higher GDP per capita tend to spend more on health. As showed in Table 1, Turkey has the lowest GDP per capita among OECD countries, and it is not surprising that Turkey has the lowest health spending per capita among OECD countries.
Table 1. HE per capita and GDP per capita in OECD countries in 2005
Lux. Norway US Ireland Iceland Switz. Canada NL Austria Australia
HE per capita 4153 4328 6347 3126 3373 4069 3460 3192 3507 2999
GDP per capita 69984 47620 41674 38061 35736 35500 35065 34724 34104 33950
Denmark Sweden Belgium UK Finland Germany Japan France Italy Spain
HE per capita 3169 3012 3421 2580 2523 3251 2474 3306 2496 2260
GDP per capita 33543 32770 32077 31580 30502 30495 30310 29784 27853 27720
Greece New Z. Korea Czech Portugal Hungary Slovak Poland Mexico Turkey
HE per capita 2283 2223 1276 1447 2029 1440 1130 843 724 591
GDP per capita 25472 24916 21342 20280 19982 17004 15880 13572 11298 10370
Source: OECD Health Data 2008, June 2008.
2
* indicates that the percentages for 2006 are not available and instead data of year 2005 are used.
5
This thesis analyzes the determinants of health expenditure, the magnitude of income elasticity of health expenditure in OECD countries. The motivation behind the analysis of the determinants of health spending is to identify forces that drive the persistent increase in health expenditure. The motivation behind the analysis of income elasticity is that the magnitude of income elasticity tells us whether health is a luxury or a necessity. Health can be seen as a luxury good if the responsiveness is sensitive to income changes i.e. the income elasticity exceeds unity and as a necessity good if the responsiveness is insensitive to income changes i.e. the income elasticity is below unity. Another interpretation can be found in Kyriopoulos and Soulitotis (2002): “If the income elasticity of health expenditure is less than one, then the public health sector does not have a high priority among the goals for social and economic development.” If in fact the income elasticity of health expenditure is greater than one, then health expenditure would increase at a higher rate than GDP and the public health sector have high priority among the goals of economic and social development.
To address the issues of determinants of health expenditure and income elasticity, this thesis focuses on the demand side of health care. For a richer analysis, we applied two functional forms: linear functional form to see the magnitude of income effect on health expenditure and log-linear functional form to see the magnitude of income elasticity of health expenditure. The variables considered on the determinants of the health expenditure are the GDP per capita, dependency rate and the public share in health expenditure. The reason for including GDP per capita is that it is commonly included as a variable in empirical studies of the factors responsible for the rise in health expenditure. The reason for including the variable dependency rate is that consumption of health care is not evenly distributed across
6
the various stages of life; young children and seniors make more intensive use of it. Denton and Spencer (1975) show that compared with health expenditure for someone 40 years of age, those for someone 60 years of age are almost twice as high, and those for someone 70 years of age are almost three times as high. Likewise, Pollock (2000) shows that the ageing of the population will contribute to a rise in health expenditure. The results of most empirical studies using international data show a positive coefficient for this variable (Hitiris and Ponett, 1992; Hitiris, 1997; Casasnovas and Saez,1999; Hitiris, 1999; Atella and Marini, 2006), however some studies show a non-significant coefficient (Gerdtham, 1992; Blomqvist and Carter, 1997; Roberts, 1998; Ariste and Carr, 2001). The reason for including the variable public share in health expenditure is that political process and the way in which health care is financed may have important implications for the amount of health expenditure. There exists some disagreement whether the extent of public finance will increase or decrease the level of health expenditure. Leu (1986) contends public finance will raise the level of spending so long as the user price to the consumer falls (but fees to providers do not) and providers have an incentive to respond to the increase in demand by increasing quantity supplied. He provides empirical evidence suggesting that "the more governments are involved in providing or financing medical care in decentralized health care systems, the higher are health expenditures" (Leu, 1986). Earlier studies by Buchanan (1965) and Bird (1970) also suggest that the degree of public finance in health care expenditures may serve as a restraint on such expenditures.
This thesis contributes to the literature in following points: health care is still a luxury in OECD countries, increase in public share increases health expenditure
7
and lastly health expenditure is more elastic in high-income countries i.e. the income elasticity of health expenditure for high-income countries is significantly higher than the income elasticity of health expenditure for low-income countries.
The rest of the paper is organized as follows. In Chapter 2, we present the literature survey and in Chapter 3, we present the data and the methodology we employed. Lastly, in Chapter 4 we present our conclusions.
8
CHAPTER 2
LITERATURE REVIEW
After Newhouse (1977)'s seminal paper, the determinants of health expenditure has been studied both by academia and policymakers. Bivariate regression model by Newhouse (1977) has been followed by several studies that employ multivariate regressions. A general characteristic of these studies is the importance of national income in explaining health expenditure along with a selection of non-income variables. Some of these non-income variables are the relative price of health care (ratio of medical CPI to GDP price index), the proportion of the population over the age of 65, urbanization rate, the publicly funded proportion of health expenditure and supply side variables such as number of hospital beds per capita, number of practicing physicians per capita and number of nurses per capita. In this section, studies which aim to find out the determinants of health expenditure, criticize the methods used and investigate whether there exist cointegration between variables will be summarized.
Newhouse (1977) asks the question “what determines the quantity of resources a country devotes to medical care?”. In order to answer this question
9
Newhouse uses regression of per capita medical-care expenditure upon per capita GDP with a sample of 13 developed countries. As Greece has a markedly lower per capita GDP than the rest of the sample he estimates the equation with and without Greece. He comes up with an R2 of 0.92 i.e. 92 percent of the variance in per capita medical expenditure in the countries can be explained by variation in per capita GDP.3 His regression of per capita medical care expenditure on per capita income for 13 United Nations countries yields income elasticity greater than one, suggesting that health is a luxury good.4
Parkin et al. (1987) replicates the regression of total health care expenditure per capita on GDP per capita by using OECD (1985) data. Their results show that the income variable is statistically significant, accounting for 87% of the variance in health expenditures. Their estimated income elasticity is 1.18 when Turkey is excluded and 1.12 when Australia, Iceland, New Zealand, Sweden, Switzerland and Turkey are excluded. They criticize the implications drawn from strong relationship between national health care expenditures and national income. They argue that labeling health care as a luxury good relies upon the application of microeconomic analysis to macroeconomic data, and that is not appropriate. They also argue that international comparisons are based on Purchasing Power Parity rather than exchange rate conversions, underlining the importance of prices as well as quantities in the relationship and leading to the conclusion that the aggregate data show health care to be a necessity rather than a luxury good.5
3 R2
is 0.90 without the Greece observation.
4
Estimated income elasticity at mean per capita GDP (3416 U.S $) is 1.31.
5
Estimated income elasticity is 1.12 when both variables are converted to US $ using exchange rate, and 0.90 when PPP is used for conversion
10
Gbesemete and Gerdtham (1992) use cross-sectional data for 30 African countries to measure the effects of socioeconomic and demographic variables on health expenditure where per capita health expenditure is a function of percentage of births attended by health staff, per capita GNP, percentage of the population under 15 years of age, urbanization rate, crude birth rates and per capita foreign aid.6 The model is estimated by using a multiple regression analysis. They conduct tests for misspecification of the model and against functional misspecifications.7 They estimate three equations which differ from each other in terms of explanatory variables. Per capita GNP, percentage of births and per capita foreign aid are included in all three equations. They include the population under 15 as a percentage of total population only in one equation and they report negative coefficient although they expect a positive correlation. The urban population as a percentage of total population is included in two equations and they report a positive coefficient as expected. The crude birth rate is included in only one equation and the results reveal that it is not significant. The results of their best fitting model show that only per capita GNP, percentage of births and per capita foreign aid are statistically significant and carry a positive sign. The results indicate that 10% increase in per capita GNP increases health care expenditure by about 1%. This positive association between per capita GNP and health care expenditure accords with the results of earlier studies. The only difference when compared to the OECD countries is that the reported income elasticity for health care is 1.5-2.0 whereas the reported income elasticity for the African states is barely 1.07. The coefficient for their proxy variable on health care delivery (the percentage of births attended by health staff) indicates that 10% increase in the percentage of birth attended by health staff increases health
6
Percentage of births attended by health staff is used as an indirect measure of the extent to which health services have reached the people.
11
care expenditure by 0.28%. The coefficient for the last significant variable (per capita foreign aid) indicates that 10% increase in per capita foreign aid increases health care expenditure by 0.18%.
Gerdtham et al. (1992) concern with an empirical investigation of the factors behind the variance in health care expenditure in the OECD countries. They generalize a model where health expenditure is a function of national income, relative price of health care, institutional factors, age structure and urbanization. They use single cross-section of 19 OECD countries in 1987. According to the results, the significant regressors are per capita GDP, urbanization, share of public financing to total expenditure, share of inpatient care expenditure to total expenditure and a dummy variable for countries with fee-for-service as the dominant remuneration in outpatient care. They come up with an income elasticity of 1.33, which is consistent with previous studies. They also find that 10% increase in the share of public health care expenditure will decrease health care expenditure by about 5%. Another interesting finding of the paper is that the dummy variable for fee-for-service has a significant impact on the health care expenditure; the health care expenditure is about 11% higher in countries with fee-for-service as the dominant form of remuneration in outpatient care.
Hitiris and Posnett (1992) analyze the determinants of health expenditure using a pooled sample of cross section and time series observations covering 20 OECD countries for the period 1960-1987; a total of 560 observations. In this study, they examine the following relationships: the relationship between per capita health spending and per capita GDP, the potential influence of non-income variables (the
12
proportion of the population over 65, the public finance share of total health spending, and a set of shift dummies to capture country specific fixed effects) on differences in health spending, and lastly the relationship between crude mortality rates, GDP per capita and per capita spending on health. First equation produces a point estimate of the income elasticity at 1.026 when exchange rate is used for adjustment. Adjustment by GDP PPP leads to a higher elasticity at 1.16, however it reduces the overall explanatory power of the equation. According to the results of second equation, the coefficient of the proportion of population over 65 is significant and has the expected sign, with an elasticity of around 0.55. Also results imply that inclusion of the variable public finance share of total health spending adds nothing to the explanatory power of equation and the variable is not significant. Third equation indicates that mortality rates are positively correlated with GDP per capita and negatively related to per capita health spending. The conclusion of the paper is that the strong positive relationship between per capita health spending and GDP is confirmed by a larger sample. Also the importance of some non-income variables is confirmed, although the direct impact of such factors appears to be small.
Moore et al. (1992) specifies 3 models for cross-country examination of health care spending. Dependent variable in all 3 models is per capita health care expenditure. In the first model independent variable is just per capita gross domestic income. In the second model per capita health expenditure is a function of per capita income and the ratio of public expenditures to total health care expenditures. Third model includes control variables for supply across countries, which are number of hospital beds per capita, number of practicing physicians per capita and the number of nurses per capita. They estimate the models in both linear and double-log
13
functional form with data from 20 OECD countries for the period 1972-1987. They conclude that per capita income is the most important determinant of national health care spending as separate regressions revealed that over 90 percent of variation in national health care expenditures could be explained by per capita income alone. Results regarding the impact of public finance on health care spending are mixed; they can not find any empirical support for the hypothesis that publically financed health care may serve as a restraint on such expenditures. Furthermore they find that the relationship between the share of total health expenditure financed publicly and per capita health expenditure is even weaker when supply side variables are included in the model. According to the results two of the three supply side variables (number of practicing physicians per capita and number of nurses per capita), which serve primarily as control variables to minimize the potential omitted variable bias on the per capita income variable, do not have statistically significant effects on per capita health expenditure. They find that the number of per capita beds has a negative effect on health care spending i.e. the per capita supply of hospital beds tends to reduce health care expenditures. They also calculate income elasticities and they find that health is a necessity in the short-run while a luxury in the long-run; all of the estimated short-run elasticities are significantly less than 1 (around 0.8) whereas all of the long-run elasticities are significantly greater than 1 (around 1.3).
Hitiris (1997) focuses on the aggregate determinants of health expenditure in European Community countries over the period 1960-1991. Through the equation, Hitiris uses per capita GDP, dependency rate (“population aged 0-19 plus 65 and over” as per cent of population aged 20- 64, with), share of public expenditure in total health spending and the rate of inflation as independent variables and per capita
14
health expenditure (both public and private) as dependent variable. They apply two different methods. First method assumes the cross-sectional units (that is the EC member states) independent and considers the disturbance terms cross-sectionally heteroscedastic and time-wise autoregressive. Second method assumes the cross-sectional units interdependent and the disturbance terms correlated and time-wise autoregressive. Both equations show a high goodness-of-fit and, with the exception of the inflation variable in first method which is non-significant, the estimated coefficients are positive and statistically significant. The estimated income elasticity is statistically significant and within the range of 1.0-1.2, confirming the findings of Hitiris and Posnett (1992), the research for the OECD countries.
Hansen and King (1996) use data of 20 OECD countries for the period 1960-1987. In the model, dependent variable is real per capita health care expenditure and the explanatory variables are real per capita GDP, the proportion of the population under the age of 15 and over the age of 65, the proportion health care expenditure that is publicly funded and the relative price of health care expenditure. They employed country-by-country Augmented Dickey Fuller unit root test in order to determine the order of integration of each variable included. According to ADF results, two-thirds of the variables tested are non-stationary in levels and no country possesses a data set that is entirely stationary in levels. As the next step, they employ Engle-Granger cointegration test to determine whether there exists a stationary linear relationship between the non-stationary variables. According to Engle-Granger test results, for 17 of the 20 countries no evidence of cointegration is found and for two of the remaining countries the hypothesis of no cointegration can not be rejected at 5 % level of significance. The principal finding of the study is that the variables in a
15
standard model of aggregate health care expenditure for 20 members of OECD are not collectively stationary in levels, thus one of the key assumptions of OLS is violated. However, this finding does not disprove the importance of income in determining the level of health care expenditure.
Blomqvist and Carter (1997) can be seen as a complementary to the paper Gerdtham et al. (1992). They use panel data for 18 OECD countries for the period 1960-1991 to check whether health is a luxury good. As they use the full OECD time series data set, they omit many of the institutional and demographic variables considered by Gerdtham et al. (1992) and to compensate this drawback they use country-specific dummy variables. Variables they used are total health care expenditure per capita in PPP terms, GDP per capita in PPP terms, the percentage of the population aged 65 years and over, and the implicit price deflator for US GDP (1985=100). Their data set exclude Turkey, Luxembourg, New Zealand and Portugal as their series are shorter than other counties’ data series. They postulate a log-linear relationship between per capita health care spending and real income. First, they apply OLS to annual cross section of the 18 countries at several years as they wonder whether they would find estimates of the income elasticity of demand for health care significantly above one. Their results seem to support the accepted view that the income elasticity of demand for health care is quite a bit larger than one. However they realize that the point estimates of the elasticities and intercepts are larger in later years. Thus, they analyze individual country series. They find out that both real per capita total health expenditure and income are non-stationary and cointegrated for most of the countries. The long-run income elasticity estimated separately for each
16
country turns out to be around or greater than unity for all countries with the exception of Canada, UK and the USA.
Casasnovas and Saez (1998) examine the factors involved in rising health care expenditures by developing a model using data for 110 regions in eight OECD countries in 1997: Australia, Canada, France, Germany, Italy, Spain, Sweden and United Kingdom. They argue that the regional factor should be accounted in international comparisons as health care is a rather local good in most countries. They identify two sources of variation (within countries and between countries) to find out if the relationships between health care spending and the explanatory variables are country-specific. The relationship is assessed by means of a multilevel model. The idea in the study is that the different relationships between health care expenditure and its explanatory variables might be country-specific. In the model apart from autonomous health care expenditure only income elasticity is country specific. The model is specified as a mixed fixed and random coefficients model by allowing the constant and the income parameter to differ randomly across countries where log of per capita health expenditure depends on log of per capita income, share of public health spending and the share of population over the age of 65. They found that increases in the percentages of population over 65 and increases in percentages of public health expenditures raises health care expenditures. They estimate income with very low elasticity and they found that higher (relative) variation in income leads to a higher variation in health care expenditure and, consequently, to a higher estimated income elasticity.
17
Hitiris (1999) aimed to search for the common factors which might explain the persistent rise in health care expenditures in the G7 countries and the cost containment policies. In the model, dependent variable is the total real health expenditure per capita (US $ PPP), and the explanatory variables are per capita real GDP (US $ PPP), the proportion of the population over age 65 and the share of public expenditure on GDP as a proxy for trends in public spending and an indicator of government involvement in the economy. The panel data set consists of 35-year observations covering the period 1960-1994. The estimation yields high goodness of fit (R2=0.839) and the coefficients are statistically significant and have expected signs; all explanatory variables (income, ratio of the population over age 65, the share of public expenditure on GDP) have positive influence on health expenditure. At the point sample means, the income elasticity is 1.07 confirming the dominance of GDP in determination of health spending. The proportion of the population over age 65 has an elasticity of 0.59 which shows that an increase in dependency will raise health expenditure. Government expenditure, with an elasticity of 0.27, has positive relatively small but statistically significant effects on the growth of health expenditure. His findings confirm that income and the share of senior population explain almost 90 percent of the variation in health spending.
Roberts (1999) concentrates on the shortcomings of the analysis of health care expenditure done since Newhouse (1977) and employs techniques to analyze the determinants of health expenditure as a dynamic heterogeneous data field8 . She uses data of 20 OECD countries over the period 1960-1993. She specifies an ADL (autoregressive distributed lag) model with random coefficients to capture the
8
Data field is a panel data set consisting of a relatively small number of cross sections, each with a relatively long time series dimension.
18
heterogeneity across the OECD countries where total health spending is a function of income, proportion of the population over the age of 65, relative price of health care, the proportion of publicly funded health spending and a time trend which captures technological change. She compares mean group, pooled and cross-section estimators. In static mean group and pooled estimation, she finds evidence of significant long-run effects of income, the proportion of publicly funded health spending and the relative price of health care. According to the results, only the long-run income elasticity is significant in the dynamic mean group estimation and the reported long-run income elasticity is above one. She also focuses on sensitivity analysis to check the robustness of the results and the parameter sensitivity to country exclusion.
Okunade and Karakus (2001) uses real per capita GDP and relative price of health care data of 19 OECD countries covering the period 1960-1997 to explain changes in real per capita health expenditures in these countries. In order to investigate stationarity of model variables, they employ Augmented Dickey-Fuller (ADF) and Phillips-Perron country by country unit root tests and Im, Pesaran and Smith (IPS) panel unit root tests. According to the results of ADF and Philips-Perron unit root tests, not all of the OECD countries have the same order of integration across all the variables. According to IPS test results, panel data reject the unit root hypothesis for health care expenditure but not for GDP which implies the correlation between health care expenditure and GDP may be spurious in the classical time series regression. Also they employ Engle-Granger and Johansen cointegration analysis in order to test the presence of long-run relationship. According to the results of Engle-Granger cointegration test, data of four countries (Finland, France,
19
Switzerland and the UK) are significantly cointegrated. Results of the Johansen multivariate cointegration test differ from those of Engle-Granger method; data of Greece, Ireland, and the UK are cointegrated whereas data of other countries seem to lack cointegration. A case study for the UK reveals that health is a luxury good with income elasticity of 1.43 and the responsiveness of the UK health spending to changes in the relative prices is found to be highly elastic.
Bac and Le Pen (2002) focus on estimating a demand function by using panel data for 18 OECD countries for the period 1972-1995 by adopting a cointegration approach where per capita health expenditure depends on per capita GDP and the relative price of health care. To check if there is a unit root for health care expenditure, per capita GDP and the relative price of health care, they apply ADF test and IPS panel data unit root test. According to ADF test results, they can not reject the null hypothesis of unit root for health care expenditure, per capita GDP and relative price of health care series with a few exceptions. According to IPS panel data unit root test results they can not reject the hypothesis for health care expenditure and per capita GDP however they can reject for the relative price of health care series. In order to check stationarity, they apply Hadri panel data stationarity test and according to the results they reject the hypothesis of trend stationarity for health care expenditure, per capita GDP and relative price of health care. The aim of Bac and Le Pen (2002) is to test the hypothesis of cointegration between health care expenditure, per capita GDP and the relative price of health care. They found strong evidence on the cointegration of these variables and compared OLS, fully modified OLS (FMOLS) and dynamic OLS (DOLS) where the latter two estimators account for endogeneity and serial correlation. With the FMOLS, health expenditure has income
20
elasticity smaller than one while greater than one with the DOLS. Furthermore, the effect of the relative price of health is negative and significant with FMOLS but positive and significant with DOLS. So the economic implications of these results are quite divergent.
Clemente et al. (2002) examine the stability of health expenditure models in the OECD countries for the period 1960-1997 by adopting a cointegration approach. They criticize the stability assumption of HE-GDP relationship and argue that there exist structural breaks which lead to a biased and incorrect long-run relationship. They conduct the analysis by disaggregating total expenditure as public and private health expenditure. The results suggest that the inclusion of structural breaks does not invalidate income elasticity of health care spending being greater than one.
Gerdtham and Löthgren (2002) aimed to test for cointegration between health expenditure and GDP using a different strategy as compared to the previous studies. Instead of using single equation models and residual based cointegration tests, they adopt a system strategy and use a multivariate heterogeneous panel vector error correction model to perform a likelihood-based inference for cointegration rank in the health expenditure and GDP system. They perform both country-by-country and panel cointegration tests by means of using a panel of 25 OECD countries for the period 1960-1997. While the unit root tests indicate that both health expenditure and GDP are difference stationary I (1) series, their country-by-country results indicate that health expenditure and GDP are cointegrated for 12 of the countries, and for the remaining 13 countries the selected rank is zero indicating that the variables are not cointegrated.
21
Di Matteo and Di Matteo (1998) focus on the determinants of Canadian provincial government health expenditures within pooled time-series cross-section framework for the period 1965-1991. Real per capita provincial government expenditures on health care are assumed to be a function of real provincial per capita income, the proportion of the provincial population over age 65 and real provincial per capita federal transfer revenues. The model specification is log-log so as to interpret the coefficients as elasticities. According to the regression results 92% of the variation in real per capita provincial government health expenditures is explained by the dependent variables and the results show that real per capita provincial government health expenditures are positively and significantly related to real provincial per capita income, the proportion of the provincial population over age 65 and real provincial per capita federal transfer revenue. They report that the income elasticity of government health care spending is 0.77 and therefore imply that real per capita provincial government health expenditures are a necessity rather than a luxury good.
Di Matteo (2000) focuses on public and private Canadian health expenditures over the period 1975-1996. He examines health expenditure as total and sub-expenditure categories such as hospital, physician and drug spending. In the model estimated through the paper, the ratio of public health expenditure to total health expenditure is a function of real per capita income, the proportion of the population over the age of 65 and real per capita federal government health transfers. Also he adds dummy variables for the onset of Established Program Financing, the Canada Health and Social Transfer and the Canada Health Act. In order to capture the impact of the changing income distribution a variable representing the share of individual
22
income held by the top and bottom quintiles of the income distribution is included. The model specification is log-log and the estimation technique is OLS. According to the results of the estimation the key determinants of public-private mix are per capita income, the share of individual income held by the top quintile of the income distribution and federal health transfers. The coefficient for real per capita GDP is negative which suggests that public sector expenditure is less income elastic than private sector expenditure i.e. increases in per capita income are associated with more private health care spending relative to public spending.
In a later study Di Matteo (2003) compares parametric and nonparametric estimation methods in estimating the relationship between income and health expenditures by using three time series cross section data sets which are U.S state level data for the period 1980-1997, Canadian province level data for the period 1965-2000, and national level data for 16 OECD countries from 1960-1997. Their results for parametric OLS estimation for the U.S, Canada and the OECD show that per capita health expenditures are positively related to income and the proportion of population over age 65 except for the OECD case and federal cash transfers for Canada. The income elasticity of health spending evaluated at mean income is 0.70 for the U.S, 0.72 for Canada and 1.21 for the 16 OECD which means that health care is either a luxury or a necessity as income elasticity varies with level of analysis.
Ariste and Carr (2001) try to find answer to what determines the rise in health care expenditures in Canada and whether health care represent a luxury good in Canada. They use 10 Canadian provinces’ data of total income (disposable personal income plus government income), the proportion of the population 65 years of age
23
and over, and the ratio of the deficit or surplus to GDP for 1966 to 1998 to explain the real per capita government health expenditures. They examine the non-stationarity of the variables by using IPS, the cointegrating relationships by using Kao’s method and state that variables, both individually and collectively, are non-stationary and possibly non-cointegrated. They found that the determinants of government health expenditures are income, the ratio of the deficit/surplus to GDP and a time trend capturing technological progress. The coefficient of the share of senior population appears to be statistically insignificant. After concluding that all the variables are non-stationary and possibly non-cointegrated, they estimate a fixed effects model with non-stationary variables and conclude that the income elasticity of government health spending is 0.88.
Atella and Marini (2006) aimed to present new evidence on the relationship between income and health care expenditure allowing for substitution and complementary relationships between private and public health care expenditure, allowing for presence of structural breaks in the dependent variables and lastly presence of country-specific health systems. Their analysis is conducted over the interval 1960-2000 for 20 OECD countries. Variables they used are per capita health expenditure, per capita income, relative price of health care expenditure, dependency rate, and the share of government expenditures9. According to the results, in the long run and when technology is omitted, income elasticity of total health care expenditure is 1.162 for NHS countries and 1.195 for non-NHS countries. In the long run and when technology is included, income elasticity of total health care
9 The relative price of health care expenditure is calculated as the ratio of health services price
index to the GDP deflator, dependency rate is defined as sum of population below 15 and over 64 as percentage of population aged 15-64, the share of government expenditure is calculated as the ratio of government final consumption expenditure to GDP.
24
expenditure is 0.758 for NHS countries and 0.886 for non-NHS countries. They also report the estimated income elasticities with public and private health expenditure separation. They state that income elasticity for public health care expenditure and for private health care expenditure is higher in NHS countries than non-NHS countries. They also note that public expenditure is more dependent on GDP than private health care expenditures in the long-run and vice versa in the short-run. According to the analysis of the substitution and complementary relationships between public and private health care expenditures they report that extra one Dollar spent on private health care expenditure in NHS countries private health care expenditures decreases by 0.03 Dollars, extra one Dollar spent on public health care expenditure in NHS countries private health care expenditures decreases by 0.03 Dollars. Therefore it is concluded that for NHS countries there exists a substitution effect between public and private health care expenditures. For non-NHS countries the result is different; in the long-run both private and public health care expenditure report complementary relationship. For structural break debate they report that income elasticity for public health care expenditure is positively dependent on cyclical and long-run components of GDP; the reverse holds for private health care expenditure.
The results of most empirical studies summarized above show that income elasticity of health expenditure is greater than unity (Newhouse, 1997; Gerdtham et al., 1992; Hitiris and Posnett, 1992; Moore et al., 1992; Blomqvist and Carter, 1997; Roberts, 1999; Hitiris, 1999; Okunade and Karakus, 2001; Clemente et al., 2002; Bac and Lee Pen, 2002). In contrast, some studies show that income elasticity of health expenditure is below unity (Casasnovas and Saez, 1998; Di Matteo and Di Matteo,
25
1998; Ariste and Carr, 2001). Studies which include “public share in health expenditure” as a country-specific control variable in order to explain changes in health expenditure do not reach a concensus. Casasnovas and Saez (1998) and Hitiris (1997) find a positive coefficient whereas Gerdtham et al. (1992) find a negative coefficient and Hitiris and Posnett (1992) and Moore et al. (1992) find insignificant coefficients. The results of most empirical studies including age structure show a positive coefficient for this variable (Hitiris and Posnett, 1992; Hitiris, 1997; Blomqvist and Carter, 1997; Casasnovas and Saez, 1998, Hitiris, 1999; Atella and Marini, 2006). In contrast, Gbesemete and Gerdtham (1992) come up with a negative coefficient for the variable “proportion of population under 15” which they used as a measure of age structure. Results of other studies including age structure as a determinant of health expenditure show a non-significant coefficient for this variable (Gerdtham et al., 1992; Roberts, 1999; Ariste and Carr, 2001)
26
CHAPTER 3
DATA AND ECONOMETRIC METHODOLOGY
The postulated model analyzes the determinants of health expenditure among OECD countries. We utilize annual OECD health data between the years 1975 and 2006. Unfortunately the data series on 12 countries, which are Belgium, Czech Republic, France, Greece, Hungary, Italy, Korea, Luxembourg, Mexico, Poland, Slovak Republic and Switzerland are excluded from the analysis as they have much shorter series than remaining 18 countries.10 Thus, the panel data set consists of 32-year observations from 18 OECD countries (a sample of 576 observations). Time series used through the model are total health expenditure per capita, GDP per capita, dependency rate that is “population aged 0-14 plus 65 and over as percent of population aged 15-64” and the public share in total health expenditure. The cross section analysis requires the data to have comparable units of measurement across countries. For this purpose, we used GDP per capita in US$ PPP and health expenditure per capita in US$ PPP values of all countries.
10
Australia, Austria, Canada, Denmark, Finland, Germany, Iceland, Ireland, Japan, Netherlands, New Zealand, Norway, Portugal, Spain, Sweden, Turkey, United Kingdom and United States
27
As there is no common agreement about which functional form to use, in order to identify the determinants of health expenditure we estimate the model with both the linear functional form (equation 1) and log-linear functional form (equation 2). t i t i t i t i t i Y PDEPR PUBSH u HE , , 3 , 2 , 1 ,=α +β ( )+β ( )+β ( )+ (1) t i t i t i t i t i Y PDEPR PUBSH v HE , , 3 , 2 , 1 ,) ln( ) ln( ) ln( ) ln( =λ+ϑ +ϑ +ϑ + (2) for i=1,...,18
Dependent variable, HE, is the total health expenditure per capita. The explanatory variables are Y, PDEPR and PUBSH where Y is GDP per capita, PDEPR is dependency rate and PUBSH is the public share in total health expenditure.
3.1. Hausman Test:
First, we need to test whether fixed effect estimation model (versus random effect) is appropriate for the relation between health expenditure and explanatory variables listed above. The null hypothesis of Hausman’s specification test is that the fixed effect and random effect do not differ substantially. Fixed effect model is consistent in both null and alternative whereas random effect is consistent under null but inconsistent under alternative. In other words, under the null hypothesis both OLS in the LSDV (Least Squares Dummy Variable) model and GLS are consistent,
28
but OLS is inefficient, whereas under the alternative, OLS is consistent but GLS is not. The chi-squared test is based on the Wald criterion:
] [ ] var [var ]' [ 1 ∧ − ∧ ∧ − − − = b
β
bβ
bβ
W , where b represents coefficients obtained
from fixed effect model and
β
∧ represents coefficients obtained from random effect model. 1762 . 50 1= W 9715 . 35 2= WCalculated critical
χ
2value is 13.276 for 1% significance level. Both W and 1 2W are much higher than critical
χ
2value thus we reject the null hypothesis i.e. Hausman test does not support the random effect model. Therefore we conclude that fixed effect model is a better model for estimation of health expenditures in OECD countries.
3.2. Regression Outputs:
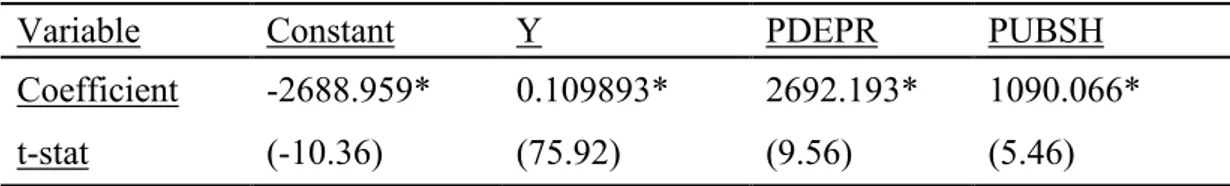
Table 2 presents the estimation results of linear functional form. The estimated coefficients of all explanatory variables (GDP per capita, public share in health expenditure and dependency rate) satisfy the statistical criteria. The coefficient of Y tells us that 100 US$ increase in GDP per capita raises health expenditure per capita by 10.99 US$. The coefficient of public share in health expenditure is positive which means that the more government is involved in providing or financing medical
29
care the higher are health expenditure. The coefficient of dependency rate is positive and it tells us that if the proportion of young children and seniors in the population increases the health expenditure of the country rises.
Table 2. Fixed Effect Model Estimation Results “Dependent Variable is HE”
Variable Constant Y PDEPR PUBSH
Coefficient -2688.959* 0.109893* 2692.193* 1090.066*
t-stat (-10.36) (75.92) (9.56) (5.46)
Note: * indicates significant at 1% significance level.
Table 3 presents the estimation results of log-linear functional form. The estimated coefficients of GDP per capita and public share in health expenditure are significant at 1% significance level; however dependency rate turns out to be insignificant. Coefficients of GDP per capita and public share in health expenditure are positive. The estimated income elasticity of health expenditure is 1.21 and it implies that health expenditure is a luxury which is consistent with the literature. Studies that find health is a luxury good are the following: Newhouse (1977), Gerdtham et al. (1992), Hitiris and Posnett (1992), Blomqvist and Carter (1997), Okunade and Karakus (2001), Clemente et al. (2002), Bac and Le Pen (2002).
Table 3. Fixed Effect Model Estimation Results “Dependent Variable is ln(HE)”
Variable Constant ln(Y) ln(PDEPR) ln(PUBSH)
Coefficient -4.509826* 1.209846* -0.001960 0.359925*
t-stat (-45.14) (85.88) (-0.02) (6.53)
30
In order to see whether the income elasticity of health expenditure in high income countries differs from the income elasticity of health expenditure in low income countries we categorized 18 OECD countries by means of comparing their GDP per capita and labeled Norway, US, Ireland, Iceland, Netherlands, Australia, Austria and Denmark as high income countries and labeled Finland, Germany, Japan, New Zealand, Portugal, Spain, Sweeden, Turkey and UK as low income countries.
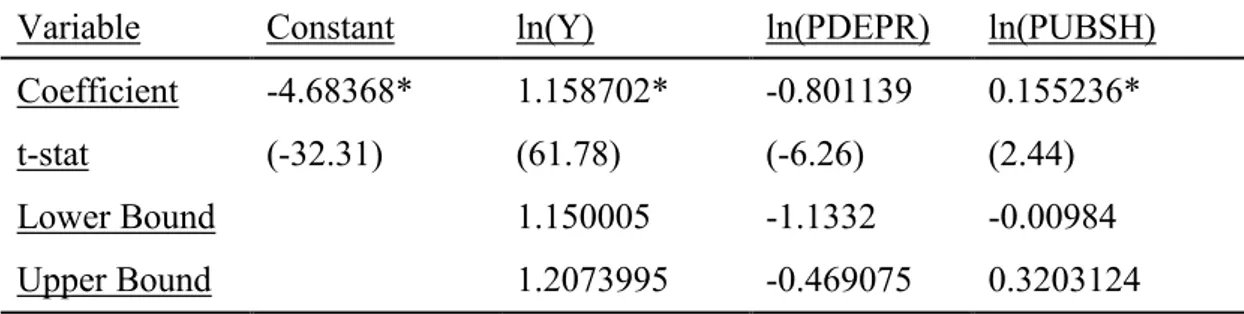
Table 4 presents the results of estimation done for low income countries. The estimated coefficients of GDP per capita and public share in health expenditure turn out to be significant, however the coefficient of dependency rate turns out to be insignificant. The estimated income elasticity for low-income countries is 1.16 which means that health is luxury for low-income countries. The coefficient of public share in health expenditure is positive likewise the result of the regression done for all 18 countries.
Table 4. Fixed Effect Model Estimation Results For Low Income Countries
Variable Constant ln(Y) ln(PDEPR) ln(PUBSH)
Coefficient -4.68368* 1.158702* -0.801139 0.155236*
t-stat (-32.31) (61.78) (-6.26) (2.44)
Lower Bound 1.150005 -1.1332 -0.00984
Upper Bound 1.2073995 -0.469075 0.3203124
Note: * indicates significant at 1% significance level.
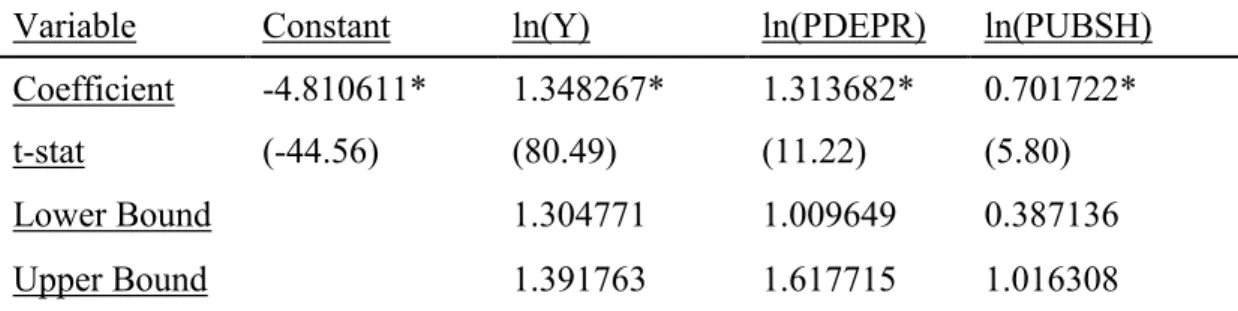
Table 5 presents the results of estimation done for high income countries. The estimated coefficients of all 3 explanatory variables turn out to be significant and positive. The estimated income elasticity for high income countries is 1.35 and it tells us that health is luxury also for high income countries. The coefficient of dependency
31
rate turns out to be significant this time and it is positive. The coefficient of public share in health expenditure is positive as happened in low-income countries meaning that increase in public share in health expenditure rises health expenditure in both group of countries.
Table 5. Fixed Effect Model Estimation Results For High Income Countries
Variable Constant ln(Y) ln(PDEPR) ln(PUBSH)
Coefficient -4.810611* 1.348267* 1.313682* 0.701722*
t-stat (-44.56) (80.49) (11.22) (5.80)
Lower Bound 1.304771 1.009649 0.387136
Upper Bound 1.391763 1.617715 1.016308
Note: * indicates significant at 1% significance level.
The income elasticity of low-income countries is 1.16, the income elasticity of all 18 countries is 1.21 and the income elasticity of high-income countries is 1.35. Income elasticities of high-income and low-income countries show that GDP level does not change health being a luxury. The upper bound of estimated income elasticity of low-income countries is 1.21 and the lower bound of estimated income elasticity of high-income countries is 1.30. We reject the hypothesis that income elasticity of low-income countries is not different than the income elasticity of high-income countries. Furthermore, the high-income elasticity is higher for high-high-income countries than the income elasticity of low-income countries.
32
CHAPTER 4
CONCLUSION
This thesis focused on the non-income determinants of health expenditure and the magnitude of income elasticity of health expenditure in OECD countries using panel data on GDP per capita, dependency rate and public share in health expenditure over the period 1975-2006. We estimated the model both with the linear and log-linear functional form. According to the results of linear functional form, 100 US$ increase in GDP per capita rises health expenditure with 10.99 US$. Both of the non-income variables are significant and the coefficients are positive. According to the results of log-linear functional form the coefficient of ln(Y) which implies the income elasticity of health expenditure is 1.21 i.e. health is a luxury good for OECD countries. Likewise the result of linear functional form, the coefficient of public share in health expenditure turns out to be positive, however the coefficient of dependency rate turns out to be insignificant in log-linear functional form.
As a contribution to the literature we grouped OECD countries as high-income and low-high-income countries and we estimated the model for low-high-income and high-income countries separately. According to the results, the income elasticity of
33
health expenditure for low-income countries is 1.16 whereas it is 1.35 for high-income countries revealing that health is a luxury good for both low-high-income and high-income countries but health is more income elastic in high-income countries.
As mentioned in the literature review, there is no common agreement about the sign of the non-income determinants of health expenditure which are dependency rate and public share in health expenditure. According to our results we cannot conclude about the sign of the coefficient of dependency rate as it turns out to be positive in linear functional form and insignificant in log-linear functional form. On the other hand, according to the results of both functional forms the coefficient of public share in health expenditure turns out to be positive. Thus we can conclude that the more health sector is intervened by governments or the more health expenditure is financed by governments the more health expenditures.
34
BIBLIOGRAPHY
Ariste, R. and J. Carr. 2001. “New Considerations on the Empirical Analysis of Health Expenditures in Canada: 1966 – 1998,” Health Canada Applied Research and Analysis Directorate.
Atella V. and G. Marini. 2007. “Is health care expenditure really a luxury good? A reassessment and new evidence based on OECD data,” Rivista di Politica Economica Marzo 3:87-119.
Bac, C. and Y. Le Pen. 2002. “An International Comparison of Health Care Expenditure Determinants,” 10th International Conference on Panel Data, Berlin.
Bird, R.M. 1970. “The Growth of Government Spending in Canada,” Canadian Tax Paper No. 51, Canadian Tax Foundation, Toronto.
Blomqvist, A.G. and R.A.L. Carter. 1997. “Is Health Care Really a Luxury,” Journal of Health Economics 16:207-229.
Buchanan, J.M. 1965. “The Inconsistencies of the National Health Services,” Institute of Economic Affairs, London.
Casasnovas, G.L. and M. Saez. 1998. “A Multilevel Analysis on the Determinants of Regional Health Care Expenditure,” Economics Working Paper 572, University of Pompeu Fabra.
Clemente J., C. Marcuello, A. Montanés and F. Pueyo. 2002. “On the International Stability of Health Care Expenditure Functions: Are Public and Private Functions Similar?,” Working Paper 2, University of Zaragoza.
35
Denton, F.T. and B.G. Spencer. 1975. “Health-Care Costs when the Population Changes.” Canadian Journal of Economics: 8-34.
Di Matteo, L. 2000. “The Determinants of the Public-Private Mix in Canadian Health Care Expenditures: 1975 – 1996,” Journal of Health Policy 52:87-112.
Di Matteo, L. 2003. “The Income Elasticity of Health Care Spending: A Comparison of Parametric and Nonparametric Approaches,” European Journal of Health Economics 4:20-29.
Di Matteo, L. and R. Di Matteo. 1998. “Evidence on the Determinants of Canadian Provincial Government Health Expenditures: 1965-1991,” Journal of Health Economics 17:211-228.
Gbesemete, K.P. and U.G. Gerdtham. 1992. “Determinants of Health Care Expenditure in Africa: A Cross-Sectional Study,” World Development 20:303-308.
Gerdtham U.G., J. Sogaard, F. Andersson and B. Jönsson. 1992. “An Econometric Analysis of Health Care Expenditure: A Cross-Section Study of the OECD Countries,” Journal of Health Economics 11:63-84.
Gerdtham, U.G. and M. Löthgren. 2002. “New Panel Results on Cointegration of International Health Expenditure and GDP,” Applied Economics 34:1679-1686.
Hansen, P. and A. King. 1996. “The Determinants of Health Care Expenditure: A Cointegrating Approach,” Journal of Health Economics 15:127-137.
Hitiris, T. 1997. “Health Care Expenditure and integration in the countries of the European Union,” Applied Economics 29:1-6.
Hitiris, T. 1999. “Health Care Expenditure and Cost Containment in G7 Countries,” University of York, discussion papers.
Hitiris T. and J. Posnett. 1992. “The Determinants and Effects of Health Expenditure in Developed Countries,” Journal of Health Economics 11:173-181.
36
Leu, R.E. 1986. “The Public-Private Mix and International Health Care Costs,” In Culyer, A.J. and Jonsson, B., eds. Public and Private Health Services,Oxford, Basil Blackwell.
Newhouse, J.P. 1977. “Medical Care Expenditure: A Cross National Survey,” Journal of Human Resources 12:112-125.
Moore, W.J., R.J. Newman and M. Fheili. 1992. “Measuring the Relationship between Income and National Health Care Expenditure,” Health Care Financing Review 14: 133-144.
Okunade, A. and M. Karakus. 2001. “Unit Root and Cointegration Tests: Time-series versus Panel Estimates for International Health Expenditure Models,” Applied Economics 33:1131-1137.
Parkin D., A. McGuire and B. Yule. 1987. “Aggregate Health Expenditures and National Income: Is Health Care a Luxury Good,” Journal of Health Economics 6:109-127.
Pollock, A. 2000. “Ageing as a Health-Care Cost Driver.” Ageing Series. Ottawa: Health Canada, Applied Research and Analysis Directorate.Mimeo.
Roberts, J. 1999. “Sensitivity of Elasticity Estimates for OECD Health Care Spending: Analysis of a Dynamic Heterogeneous Data Field,” Health Economics 8:459-472.
37
APPENDIX 1
Taxonomy of studies on income elasticity of health care expenditure
Year Author(s) Source Analysis sample size income elasticity
1977 Newhouse United Nations Cross-section 13 Luxury (>1)
1992 Gerdtham et al. OECD Cross-section 19 Luxury (>1)
1992 Gbesemete and Gerdtham
Africa Cross-section 30 Around 1
1992 Hitiris and Posnett OECD Panel 560 Luxury (>1)
1992 Moore et al. OECD Panel 384 Necessity (SR),
Luxury (LR) 1997 Blomqvist and Carter OECD Panel 744/31 Luxury (>1)
1998 Casasnovas and Saez OECD Panel 880 Necessity (<1)
1998 Di Matteo and Di Matteo
Canada Panel 270 Necessity (<1)
1999 Roberts OECD Panel 660 Around 1
1999 Hitiris G7 countries Panel 217 Around 1
2001 Ariste & Carr Canada Panel 330 Necessity (<1)
2001 Okunade & Karakus OECD Panel 722 Luxury (>1)
2002 Clemente et al. EU & OECD Panel 185/333/29 6
Luxury (>1)
38
APPENDIX 2
Taxonomy of studies that use public share in health expenditure
Year Author(s) Source Variable Sign
1992 Gerdtham et al. OECD Public health exp. / Total health exp. Negative
1992 Hitiris and Posnett OECD Public health exp. / Total health exp. not significant 1992 Moore et al. OECD Public health exp. / Total health exp. not
significant 1998 Casasnovas and Saez OECD Public health exp. / Total health exp. Positive
39
APPENDIX 3
Taxonomy of studies that include age structure
Year Author(s) Source Variable Sign
1992 Gbesemete and Gerdtham Africa Proportion of Population under 15 Negative
1992 Gerdtham et al. OECD Pop. >64 % Pop. 15-64 not significant
1992 Hitiris and Posnett OECD Proportion of Population over 65 Positive
1997 Hitiris EC Pop. <20 plus Pop. >64 % Pop. 20-64
Positive
1997 Blomqvist and Carter OECD Proportion of Population over 64 Negative
1998 Casasnovas and Saez OECD Proportion of Population over 65 Positive
1999 Hitiris G7 Proportion of Population over 64 Positive
1999 Roberts OECD Proportion of Population over 64 not significant
2001 Ariste & Carr Canada Proportion of Population over 64 not significant
2006 Atella and Marini OECD Pop. <15 plus Pop. >64 % Pop. 15-64