Evaluation of Correlations Between Nutrients, Fatty
Acids, Heavy Metals, and Deoxynivalenol in Corn
(Zea mays L.)
A. Y. Pekel,∗,1A. C¸ alık,†M. S. Alatas¸,‡E. Kuter,§O. Cengiz,¨ §G. Z. Omurtag,# and G. ˙Inan||
∗Department of Animal Nutrition and Nutritional Diseases, Faculty of Veterinary
Medicine, Istanbul University, Istanbul, 34320, Turkey;†Department of Animal Nutrition and Nutritional Diseases, Faculty of Veterinary Medicine, Ankara University, Ankara, 06110, Turkey;‡Department of Animal Nutrition and Nutritional Diseases, Faculty of Veterinary Medicine, Selc¸uk University, Konya, 42003, Turkey;§Department of Animal
Nutrition and Nutritional Diseases, Faculty of Veterinary Medicine, Adnan Menderes University, Aydın, 09016, Turkey;#Department of Pharmaceutical Toxicology, Faculty of
Pharmacy, Medipol University, Istanbul, 34810, Turkey; and||Optima Nutritional Products Inc., L¨uleburgaz, Kırklareli, 39780, Turkey
Primary Audience:
SUMMARY
This study was conducted to develop linear regression equations to estimate nutrients, fatty acids, heavy metals, color characteristics (L,∗a,∗b∗), and deoxynivalenol (DON) level of corn grains (n= 54) collected from different feed mills in Turkey. Procc corr and reg procedures were used to analyze the data. Among the nutrients, asit detergent lignin, Ca, and P had the highest variability. The heavy metal concentrations (Cd, Cr, Cu, Ni, Pb, and Zn) were lower than certain limits posted by regulation agencies for animals. Occurrence of DON was 53%, with the highest level of 0.725 ppm. Total of 32 highly significant (P< 0.01) correlations among nutrients, fatty acids, heavy metals, and color characteristics were determined in the current study. Correlations for estimating the range of parameters measured in corn from color characteristics lacked the practical importance. The correlations between C18:2 C18:1, ADF−NDF, Zn−Ca, Pb−Cu, and Pb−Cd produced the highest R (0.64 to 0.87) and R2 (0.41 to 0.74) values that would
be of practical importance. The research showed that there are significant correlations among different components in corn grains that could provide necessary information to both plant breeders and feed manufacturers in the field.
Key words: corn, correlation, deoxynivalenol, fatty acid, heavy metal, nutrient
2019 J. Appl. Poult. Res. 28:94–107
http://dx.doi.org/10.3382/japr/pfy023
1Corresponding author:[email protected]
DESCRIPTION OF PROBLEM Corn (Zea mays L.) is a cereal plant that was first cultivated by indigenous Americans in North America [1]. Nutrient composition of
corn reported to be influenced by the type of seed, soil composition, and especially weather conditions that can change from year to year [2]. Dry matter content of corn varies between 25% and 30% approximately at harvest that is very high for proper management of storage and, therefore, for animal nutrition [3]. The use of air drying to increase the DM content of corn has been the common industry practice to over-come the negative effects of this high mois-ture for decades. However, large variations in the temperatures (from 50◦C to 130◦C) used among facilities when drying corn may also af-fect its nutrient availability to animals, in addi-tion to a wide variety of factors effecting its nu-trient composition [4]. Hence, previous studies reported high variability on CP (6.4%−13.4%, DM-basis), EE (2.0%−7.7%, DM-basis), NDF (7.6−22.3, DM-basis), Ca (<0.001%−0.03% as-is), and P (0.18%−0.26%, as-is) content of corn [5–9]. When formulating animal diets, pre-cise nutrient content knowledge of ingredients is necessary in order to ensure that optimum animal performance is achieved as a result of utilizing more nutrients. Therefore, data on the nutrient content of corn need to be updated frequently to formulate diets more precisely.
Heavy metals can come from different vari-eties of sources including industrial practices, waste water usage, and fertilizer application in agriculture and pose a great threat to the health of both humans and animals [10]. High con-centrations of heavy metals have been found in both water sources and plants because of exten-sive usage of pesticides containing heavy metals [11]. Moreover, the extensive use of both syn-thetic and natural sources of fertilizers in agri-culture has resulted in excessive accumulations of heavy metals such as Cd, Cu, Pb, and Zn in soil that increases the uptake of these heavy metals by plants [12]. Therefore, frequent and detailed heavy metal content monitoring of corn and other cereals should be implemented to re-duce heavy metal intake of both animals and humans.
Deoxynivalenol (DON), also called as vomitoxin, is a mycotoxin belongs to tricotesene family and known to be present in most cereals consumed by both humans and animals [13]. Barley, wheat, and corn have been reported to be the most frequent sources of DON among
cereals [14]. A wide range of detrimental effects of DON have been reported in the literature including decrease in live performance and the number of offspring produced, immunotoxicity, DNA damage in lymphocytes in different animal species depending on specific host resistance [15-18]. In a recent study, Kos et al. [19] mon-itored the occurrence of DON in corn in Serbia, with a total of 1,800 samples collected during the years of 2013−2015, and the percentage of positive samples reported were 2.5% for 2013; 96% for 2014; and 15.5% for 2015, respectively. Kos et al. [19] reported that the extremely rainy weather during 2014 was the reason for the high DON occurrence in corn that year. Therefore, close monitoring of DON levels in corn and other cereals destined for both human and animal consumption is required to minimize problems associated with its occurrence.
Despite considerable data reporting the nutri-ent contnutri-ent of corn, to the best of our knowledge, no data are available regarding evaluation of cor-relations between nutrients, color characteristics, heavy metal content, and DON level. Therefore, the aim of the current study was to screen all pos-sible correlations among nutrients, heavy metals, color measurements, and DON concentrations to develop prediction equations that could be used in practice for breeding or feed formulation pur-poses.
MATERIALS AND METHODS
Corn Samples
The corn samples (n= 54) used in the current study were gathered from different feed mills lo-cated in Turkey between May 2015 and March 2016. Special attention was paid to collect sam-ples with a wide variety of color characteristics ranging from light yellow to red in visual appear-ance. Approximately 1 kg sample were taken from each source and sealed in plastic bags and immediately stored at−18◦C until analysis.
Color Measurement
Corn samples were ground to pass through a 0.5 mm screen [20] and were placed in a petri dish (90-mm diameter) to a depth of
approximately 1.5 cm before color measure-ments taken. Measuremeasure-ments were taken from 3 different locations on the outer surface of each corn sample with a Minolta chromameter [21] using the standard CIELAB color system (L∗= lightness, a∗ = redness, and b∗ = yellowness). The chromameter settings were as follows: 8 mm aperture size, 2◦angle of observation, and illumi-nant D65 as the light source. A standard ceramic tile was used to calibrate the chromameter.
Near-Infrared Reflectance Spectroscopy
Near-infrared reflectance spectroscopy [22] was used to estimate DM, CP, EE, crude ash, ADF, NDF, and CF content of corn samples. The data set used for the calibration of NIRSystem contained 150 corn samples that had been pre-viously analyzed by a private feed mill. The cal-ibration data set for corn used in NIRSystem did not include the validation samples used in the current study. Wavelengths from 1,100 to 2,500 nm were used for the prediction of a vari-able with the NIRSystem. Reflectance was taken at 2-nm intervals. The data of spectra were trans-formed to log (1/R) using a commercial software (WINISI II version 1.02, Infrasoft International, Port Matilda, PA, USA).
Proximate Composition
Samples of corn were analyzed [23] to deter-mine DM by the oven drying method (930.15), cruse ash in a muffle furnace (942.05), CP by the Kjeldahl method (984.13), EE by the Soxhlet method (920.39), ADF, NDF, and acid detergent lignin (ADL) by a filter bag technique (978.10; 973.18; 978.18D). Starch content was measured with a polarimeter by determining optical ac-tivity of a resulting solution obtained from the extraction of corn samples [24].
Fatty Acid Analysis
After the extraction of EE content gravimet-rically by the Soxhlet method [23], obtained fat samples per corn sample was frozen at−18◦C until they were analyzed for fatty acid compo-sition. The fat samples were mixed with 4 mL anhydrous diethyl ether (with 100 ppm BHT) and then transferred to Teflon-capped tubes
followed by evaporation of the solvent. Then, 5 mL of 2 N NaOH-methanol mixture was added and this mixture was placed in a water bath at 75◦C for 20 min. Then, 2 mL of borontrifluoride-methanol (20%, w/w) was added and incubated in a water bath at 75◦C for another 20 min. Fatty acid methyl esters (FAME) were extracted with 1.5 mL of hexane and 2 mL of saturated sodium chloride. Following centrifugation at 4,000× g for 5 min, upper phase was collected and trans-ferred to a clean glass vial before gas chro-matography. A gas chromatograph [25] with a flame ionization detector was used to analyze the FAME. A 30 m× 0.25 mm i.d. colon [26] was used for the FAME analysis. The initial tempera-tures of injector, detector, and oven were 240◦C, 240◦C, and 185◦C, respectively. The tempera-ture of the oven increased to 240◦C with 5◦C increases per min and held at this temperature for 1 min. OneμL sample was injected into the gas chromatograph with a 1:100 split ratio. Each FAME was identified by comparing their reten-tion times with the FAME standards [27].
Heavy Metal Analysis
Approximately 0.25 g corn sample was placed in a Teflon digestion vessel and samples di-gested in HNO3 (65%) and NH4F (10%) for
30 min at 170◦C in a microwave oven [28]. Af-ter cooling the samples to approximately 40◦C, they were diluted to 25 mL with distilled wa-ter and transferred to test tubes before induc-tively coupled plasma (ICP) spectroscopy read-ings. Then, the mineral (Ca, Cd, Cr, Cu, Ni, Pb, and Zn) concentrations were determined by an ICP/Mass spectrometry [29]. Phospho-rus content from the same digested and diluted samples was determined through the formation of a phospho-molybdenum complex using acid molybdate and Fiske−Subbarow reducer solu-tions followed by reading absorbance at 630 nm [23] (method 946.06) in a plate reader [30].
Deoxynivalenol Analysis
Deoxynivalenol analysis was performed as described by Kl¨otzel et al. [31] at Tubitak MAM laboratories [32]. Briefly, finely ground corn samples (25 g) were extracted with 200 mL dis-tilled water using an Ultra Turrax homogenizer
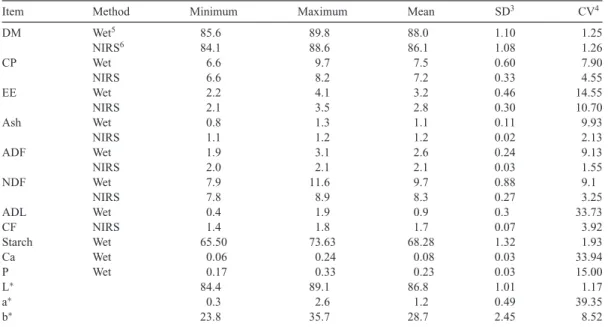
Table 1. Descriptive statistics for the nutrient composition (%) and color characteristics (l∗, a∗, b∗)1of corn samples (as-is)2.
Item Method Minimum Maximum Mean SD3 CV4
DM Wet5 85.6 89.8 88.0 1.10 1.25 NIRS6 84.1 88.6 86.1 1.08 1.26 CP Wet 6.6 9.7 7.5 0.60 7.90 NIRS 6.6 8.2 7.2 0.33 4.55 EE Wet 2.2 4.1 3.2 0.46 14.55 NIRS 2.1 3.5 2.8 0.30 10.70 Ash Wet 0.8 1.3 1.1 0.11 9.93 NIRS 1.1 1.2 1.2 0.02 2.13 ADF Wet 1.9 3.1 2.6 0.24 9.13 NIRS 2.0 2.1 2.1 0.03 1.55 NDF Wet 7.9 11.6 9.7 0.88 9.1 NIRS 7.8 8.9 8.3 0.27 3.25 ADL Wet 0.4 1.9 0.9 0.3 33.73 CF NIRS 1.4 1.8 1.7 0.07 3.92 Starch Wet 65.50 73.63 68.28 1.32 1.93 Ca Wet 0.06 0.24 0.08 0.03 33.94 P Wet 0.17 0.33 0.23 0.03 15.00 L∗ 84.4 89.1 86.8 1.01 1.17 a∗ 0.3 2.6 1.2 0.49 39.35 b∗ 23.8 35.7 28.7 2.45 8.52
1L∗= lightness, a∗= redness, b∗= yellowness.
2The values based on analysis of duplicate and triplicate samples for nutrients and color characteristics, respectively (n= 54). 3SD= standard deviation.
4CV= coefficient of variation. 5Wet= refers to chemical analysis.
6NIRS= near infrared reflectance spectroscopy.
[33] at 11,000 rpm for 3 min. The extract was then centrifuged at 10,000 rpm for 5 min and passed through a filter paper [34]. Two mL of the extract was then applied onto an immunoaffinity column [35]. The column then was washed with 5 mL of distilled water at one drop/s and dried by passing air through it with a sterile syringe. De-oxynivalenol was eluted from the columns with methanol 4 times (2× 250 μL and 2 × 500 μL) with 3 min holding time after each elution. The eluate was then evaporated under a nitrogen gas stream at 40◦C. Then, 100μL of the final elu-ate was used to determine DON concentrations by HPLC [36] that was equipped with a UV-vis detector [37].
Statistical Analysis
Data were subjected to simple linear regres-sion using PROC REG and Pearson correla-tion (R) analysis was conducted by using PROC CORR statements in SAS [38].
RESULTS AND DISCUSSION
Nutrient Composition of Corn Grains
Nutrient composition of corn generally de-pends on seed variety, soil it was planted, and the weather conditions related to the year it was harvested [2]. Therefore, continuous mon-itoring of the nutrient content of corn is nec-essary to ensure consistent product quality, re-gardless of the purpose of its usage in the in-dustry. The average DM content of 88% was very satisfactory to safely store and handle corn grains in the current study (Table1). The CP content of the corn samples ranged from 6.6% to 9.7%, with an average of 7.5% (as-is). The average CP content of the corn samples was about 12% and 9% lower (7.5% vs. 8.5% and 8.2%) than the CP content reported by NRC [7,39]. However, the CP levels (minimum and maximum) reported in the current study were within the reported ranges (5.7%–11%, as-is) by other studies [40–43]. The EE content was about
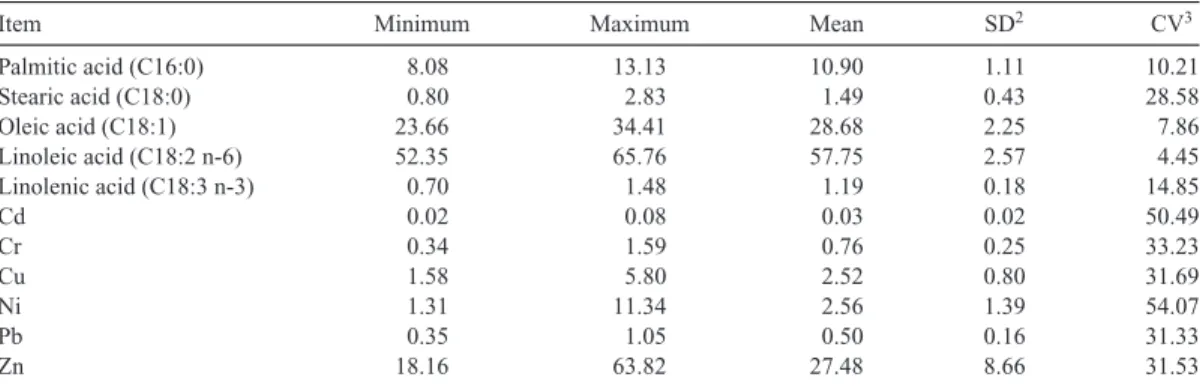
Table 2. Descriptive statistics for fatty acid composition (% of total fatty acids) and heavy metal content (mg/kg) of corn samples (as-is)1.
Item Minimum Maximum Mean SD2 CV3
Palmitic acid (C16:0) 8.08 13.13 10.90 1.11 10.21 Stearic acid (C18:0) 0.80 2.83 1.49 0.43 28.58 Oleic acid (C18:1) 23.66 34.41 28.68 2.25 7.86 Linoleic acid (C18:2 n-6) 52.35 65.76 57.75 2.57 4.45 Linolenic acid (C18:3 n-3) 0.70 1.48 1.19 0.18 14.85 Cd 0.02 0.08 0.03 0.02 50.49 Cr 0.34 1.59 0.76 0.25 33.23 Cu 1.58 5.80 2.52 0.80 31.69 Ni 1.31 11.34 2.56 1.39 54.07 Pb 0.35 1.05 0.50 0.16 31.33 Zn 18.16 63.82 27.48 8.66 31.53
1The values reported for fatty acids (n= 54) and heavy metals (n = 50) are mean of two analyses per sample. 2SD= standard deviation.
3CV= coefficient of variation = [(SD/mean) × 100].
15%–9% lower (3.2% vs. 3.8% and 3.5%) than the EE levels reported by NRC [7,39]. Crude ash values were found to range between 0.8% and 1.3% with an average of 1.1% that is very close to the crude ash value of 1.3% reported by the NRC [7]. The average ADF and NDF values of 2.6% and 9.7% were slightly lower than those reported by NRC [44], which showed an average of 3.3% for ADF and 10.8% for NDF, respec-tively. Starch is mainly located within the cells of endosperm of the seed, and corn is one of the most abundant and valuable starch sources for both humans and animals throughout the world [45]. The average starch content of the 54 corn samples was 68% and ranged between 65% and 74% on an as-is basis. Moreover, the starch con-tent of corn grains showed relatively low CV (1.93) when compared to other nutrients in the current study. The average starch content (78%, DM-basis) reported in the current study was around 7%–15% higher than the reported values between 67% and 73% (DM-basis) by others [8,
42,46]. Corn Ca values (0.06%–0.24%, as-is) in the present study were considerably higher than values (<0.001%–0.03%, as-is) in the literature [6, 7, 39,41]. Our results indicated that there is extreme variation in the Ca content of corn grains, which is in line with the other reports. However, the substantial variation in the Ca con-tent of corn grains is expected to be negligible because of its very low total levels for human and animal diets. The quite high variation for Ca content in corn grains between studies, at least, could be due to different protocols used between
laboratories. Phosphorus is a significant contrib-utor to feed cost after energy and protein and in-organic sources such as monocalcium phosphate and dicalcium phosphate have been the biggest contributor to the overall total P content of diets. Therefore, optimizing the inclusion of inorganic P sources in the diet of animals by having a pre-cise data on P content of ingredients in diets is crucial. The average P content of 0.23% (as-is) in the current study showed good agreement with Lee et al. [47] and NRC [7], who reported means of 0.22% and 0.26% for total P content of corn on an as-is basis, respectively. The obtained CV value of 15 for the P content of corn grains in the current study also agrees with the CV values of 14.5 and 19.2 reported by Lee et al. [47] and NRC [7], respectively.
Fatty Acid Composition
C18:2 was the predominant (57.7%, Table2) fatty acid in the corn grains followed by C18:1 (28.7%) and C16:0 (10.9%), and its level is in good agreement with previous reports [48,49]. However, the upper (1.48%) and lower (0.70%) limits obtained for C18:3 content in the current study were markedly lower than the upper (2.1%) and lower (1.20%) limits reported by Goffman and B¨ohme [48].
Heavy Metal Content
Cadmium is an extremely abundant toxic metal and the crops destined for consumption
by animals and humans could be easily contam-inated by this heavy metal [50]. Different indus-trial applications and increasing agricultural her-bicide, pesticide, and fertilizer usage have been reported as some of the causative sources for the accumulation of Cd in the environment and plants [51, 52]. Plants grown on soil naturally or artificially contaminated with Cd have been reported to be the second leading source of this heavy metal for humans, after cigarette smok-ing [53]. The highest Cd level (0.08 ppm) deter-mined in the current study (Table2) was found to be below the permitted concentration limits of 0.10 and 0.20 ppm for humans proposed both by the codex alimentarious commission [54] and the European Union (EU) [55], respectively. More-over, all the analyzed corn samples had lower Cd concentrations than the 10 ppm maximum tol-erable level set for poultry [39]. Therefore, the current data indicated that there was no health risk related to Cd exposure by corn consumption in both humans and animals.
Chromium is one of the heavy metals whose concentration in the environment is still high. Its common usage in industries such as stain-less steel, non-iron alloy, leather, and mining throughout the world is the reason for its high accumulation in the soil and plants [56–58]. The Cr content of corn grains was between 0.34 and 1.59 ppm (as-is), which is considerably (approx-imately 5-folds) higher than the Cr levels of 0.07 and 0.28 ppm reported by Alg¨ul and Kara [59] for 18 corn samples collected from various cities in Turkey. The large difference on Cr level of corn grains between two studies could partly be due to different sample collection cites used in two studies and different sources (feed mills in the current study vs. human markets/groceries in the latter). Major plant parts that accumulate Cr have been reported as the root and leaves compared to the grains or fruits [60]. Therefore, accumulation of Cr in grains would unlikely to pose a threat to both human and animal health even under a heavy contamination [61]. NRC [62] has proposed a maximum daily Cr intake allowance of 100 ppm for pigs, horses, cattle, sheep, and 500 ppm for chickens. Therefore, theoretically, it does not seem possible that even consuming the corn with the highest Cr content in the current study would pose a problem for the animals.
Copper is an essential trace mineral that has many metabolic duties that directly affect health and therefore the traits of economic importance in animals. However, excessive amounts of di-etary Cu can have detrimental effects on ani-mals, with the liver being the major target organ, and also lead to a buildup of Cu in the environ-ment [63,64]. The Cu contents for corn grains reported in the current study were within the previously reported range of 0.8–10 ppm [6,65,
66]. No adverse effects were reported from daily consumption of 10–12 mg of Cu in foods for humans with normal Cu homeostasis [67]. As another example, NRC [62] sets the maximum daily tolerable level of Cu to 40 ppm for dairy cattle. Therefore, even consumption of corn with the greatest Cu level (5.8 ppm) in the current study up to 2 kg for humans and 8 kg for cattle would not have a negative impact on the health of both species.
The specific function and dietary requirement level of Ni in humans and animals have not yet been identified. However, there are studies show-ing detrimental effects of high dietary Ni con-sumption such as immunotoxicity, neurotoxicity, and increased risk of developing different cancer types [68]. Ling and Leach [69] demonstrated that feeding 1,100 ppm Ni to broiler chicks re-sulted in anemia and increased mortality. Among the very few studies published, Oscar et al. [70] reported that the dietary level of 2.4 ppm Ni was adequate to produce satisfactory growth per-formance and carcass quality in broiler chick-ens. The range of Ni content (1.31–11.34 ppm, as-is) of corn grains obtained in the current study was comparable to those reported by Brizio et al. [50]. A maximum tolerance level of 100 ppm was established for cattle and sheep by NRC [62]; therefore, it seems that even the corn with the highest Ni content (11.34 ppm) in the cur-rent study can be tolerated by these animals at high dietary inclusion levels. The CV (54.07) for Ni content in corn grains was the greatest com-pared to all the other parameters studied in the current study. Therefore, more studies need to be directed toward the determination of the reason for such high variation in the Ni content of corn grains and toward understanding its role in the metabolism of animals.
Lead is considered as one of the most toxic heavy metals and has no reported essential role
Table 3. Correlations (R) between nutrients, and correlations between color scores (l∗, a∗, b∗)1and nutrients for corn samples2.
Item DM CP EE Ash ADF NDF ADL Starch Ca P
DM – – – – – – – – – – CP NS3 – – – – – – – – – EE −0.322∗ NS – – – – – – – – Ash 0.475∗∗∗ 0.472∗∗∗ −0.281∗ – – – – – – – ADF 0.316∗ NS NS 0.306∗ – – – – – – NDF NS NS NS 0.292∗ 0.713∗∗∗ – – – – – ADL 0.562∗∗∗ 0.362∗∗ NS 0.328∗ 0.313∗ −0.143∗ – – – – Starch NS NS NS NS −0.323∗ −0.362∗∗ NS – – – Ca NS NS 0.401∗∗ 0.334∗ NS NS NS NS – – P 0.345∗ 0.625∗∗∗ NS 0.634∗∗∗ NS NS 0.415∗∗ NS NS – L∗ NS2 NS −0.258∗ NS NS NS NS NS NS NS a∗ NS NS NS NS NS 0.316∗ NS NS NS NS b∗ −0.314∗ NS 0.426∗∗ −0.280∗ NS NS −0.301∗ NS 0.405∗∗ NS
1L∗= lightness, a∗= redness, b∗= yellowness.
2Significant correlations are expressed using a single asterisk (∗) for P< 0.05, double asterisk (∗∗) for P< 0.01, and triple asterisk (∗∗∗) for P< 0.001, respectively (n = 54).
3NS= Not significant.
for any biochemical and physiological functions in the living organism [71]. Bakalli et al. [72] found that 1 ppm dietary Pb resulted in a sig-nificant decrease on feed intake and depressing effect on overall live weight of broiler chickens. The mean Pb value obtained in the current study was approximately 50 times higher than those reported (0.01 ppm, as-is) by Brizio et al. [50] for 12 corn samples collected in Italy. One expla-nation for the large difference between studies is the source of samples taken. The samples used in the current study were gathered from feed mills; however, Brizio et al. [50] collected sam-ples right after harvest that would be expected to have less time for getting Pb from the environ-ment. On the other hand, the obtained maximum Pb level in the current study was very similar to those reported (0.98 ppm, as-is) by Lavado et al. [73]. The all Pb concentrations obtained in the current study exceeded the maximum ac-ceptable level of 0.20 ppm defined by the EU regulation (no: 420/2011) for foodstuffs [74]. However, even the highest Pb level obtained in the current study was significantly lower than the 10 ppm (with 12% moisture) maximum tolerable Pb level posted by NRC for poultry feeds [39]. Therefore, the Pb levels obtained for corn sam-ples used in the current study can be regarded as safe in regard to animal consumption.
Zinc is a trace mineral that involves in many metabolic processes including appetite control,
immune system regulation, and growth and re-production of animals [75,76]. The Zn concen-trations are within the range of reported values (16 to 130 ppm) by Demirkıran [77]. Consider-ably high dietary levels of Zn have been shown to be very well tolerated and pose no health con-cerns for both animals and humans [78]. For ex-ample, the toxicity threshold for dietary Zn was estimated to range from 500 to 1,500 ppm for dairy cattle [79]. Likewise, Southern and Baker [80] reported only a slight growth depression by feeding a relatively high level of Zn (2,000 ppm) to young chicks. Therefore, the obtained Zn lev-els for the corn samples in the current study would not pose any health concerns for animals.
Correlations Between Nutrients and Color Characteristics
In addition to determination of nutrient com-position of the corn samples studied, another aim of the study was to evaluate correlations between nutrients, fatty acids, heavy metals, and DON concentrations. Although there were many significant correlations between investigated parameters at P < 0.05 and < 0.01 levels (Tables 3–9), only correlations determined to be statistically significant at P < 0.001, which are of practical importance, are discussed in the current study. Moreover, the correlations at P
Table 4. Correlations (R) between fatty acids and color scores (l∗, a∗, b∗)1for corn samples2. Item C16:0 C18:0 C18:1 C18:2 n-6 C18:3 n-3 C16:0 – NS3 NS −0.445∗∗∗ NS C18:0 – – NS −0.325∗ NS C18:1 – – – −0.868∗∗∗ NS C18:2 n-6 – – – – NS C18:3 n-3 – – – – – L∗ −0.275∗ NS 0.347∗∗ NS NS a∗ NS NS NS NS NS b∗ NS NS NS NS −0.267∗
1L∗= lightness, a∗= redness, b∗= yellowness.
2Significant correlations are expressed using a single asterisk (∗) for P< 0.05, double asterisk (∗∗) for P< 0.01, and triple asterisk (∗∗∗) for P< 0.001, respectively (n = 54).
3NS= Not significant.
Table 5. Correlations (R) between heavy metals and color characteristics (L∗, a∗, b∗)1for corn samples2.
Cd Cr Cu Ni Pb Zn Cd – NS3 0.498∗∗∗ NS 0.639∗∗∗ NS Cr – – NS 0.318∗ NS 0.409∗∗ Cu – – – NS 0.641∗∗∗ 0.484∗∗∗ Ni – – – – NS NS Pb – – – – – 0.459∗∗∗ Zn – – – – – – L∗ NS NS NS NS NS NS a∗ NS NS NS 0.341∗ NS NS b∗ NS NS NS NS NS 0.291∗
1L∗= lightness, a∗= redness, b∗= yellowness.
2Significant correlations are expressed using a single asterisk (∗) for P< 0.05, double asterisk (∗∗) for P< 0.01, and triple asterisk (∗∗∗) for P< 0.001, respectively (n = 50).
3NS= Not significant.
Table 6. Correlations (R) between nutrients and heavy metals for corn samples1.
Cd Cr Cu Ni Pb Zn DM NS2 NS −0.280∗ NS NS −0.342∗ CP NS NS NS NS NS NS EE NS NS 0.403∗∗ −0.293∗ 0.290∗ 0.439∗∗ Ash NS NS NS NS NS NS ADF NS NS NS NS NS NS NDF NS NS NS NS NS NS ADL NS NS NS NS NS −0.307∗ Starch NS NS NS NS NS NS Ca NS 0.528∗∗∗ 0.336∗ NS 0.317∗ 0.672∗∗∗ P NS NS NS NS NS NS
1Significant correlations are expressed using a single asterisk (∗) for P< 0.05, double asterisk (∗∗) for P< 0.01, and triple asterisk (∗∗∗) for P< 0.001, respectively (n = 50).
2NS= Not significant.
± 0.45 and 0.65 were classified as “moderate” and between ± 0.66 and 0.85 were classified as “high.” The prediction equations calculated from significant correlations (P < 0.01) are given in Table 10. Significant correlations between nutrient composition and color
charac-teristics of corn samples are provided in Table3. The highest correlation was between NDF and ADF (0.713) followed by moderate correlations between P and ash (0.634), and P and CP (0.625). Similarly, Wang and Daun [81] showed that there was a very high linear correlation
Table 7. Correlations (R) between fatty acid composition, nutrients and heavy metals for corn samples1. C16:0 C18:0 C18:1 C18:2 n-6 C18:3 n-3 DM NS2 NS NS NS 0.416∗∗ CP −0.288∗ NS NS NS NS EE 0.287∗ NS NS NS −0.282∗ Ash −0.390∗∗ NS NS NS NS ADF NS NS NS NS NS NDF NS 0.288∗ NS NS NS ADL NS NS NS NS NS Starch NS −0.379∗∗ NS NS NS Ca NS NS NS NS −0.495∗∗∗ P NS NS NS NS NS Cd NS NS NS NS NS Cr NS NS NS NS NS Cu NS NS NS NS −0.476∗∗∗ Ni NS NS NS 0.280∗ NS Pb NS NS NS NS −0.354∗ Zn NS NS NS NS −0.362∗∗
1Significant correlations are expressed using a single asterisk (∗) for P< 0.05, double asterisk (∗∗) for P< 0.01, and triple asterisk (∗∗∗) for P< 0.001, respectively. n = 54 for correlations between fatty acids and nutrients. n = 50 for correlations between fatty acids and heavy metals.
2NS= Not significant.
Table 8. Occurrence of deoxynivalenol (DON) and its concentration in DON positive corn grains1. DON concentrations in positive samples (mg/kg)
Positive samples/total sample (%) Minimum Maximum Median Mean
DON 26/49 (53%) 0.040 0.725 0.100 0.158
1n= 49.
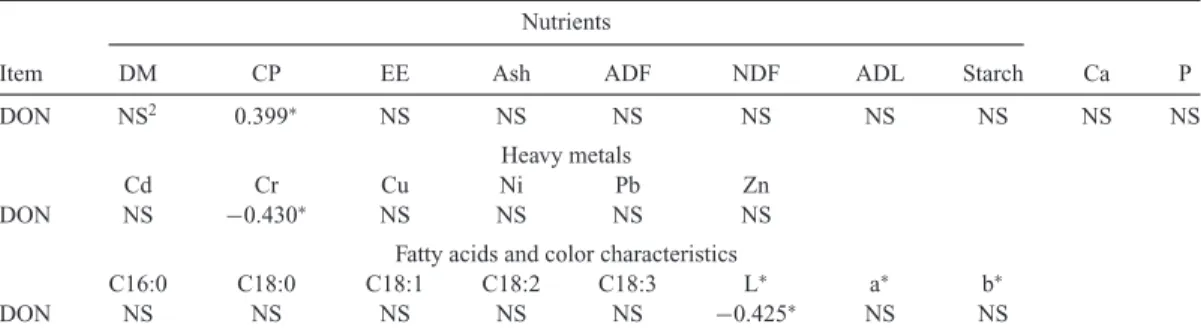
Table 9. Correlations (R) between deoxynivalenol (DON) level, nutrients, heavy metals, fatty acids, and color characteristics for corn samples1.
Nutrients
Item DM CP EE Ash ADF NDF ADL Starch Ca P
DON NS2 0.399∗ NS NS NS NS NS NS NS NS
Heavy metals
Cd Cr Cu Ni Pb Zn
DON NS −0.430∗ NS NS NS NS
Fatty acids and color characteristics
C16:0 C18:0 C18:1 C18:2 C18:3 L∗ a∗ b∗
DON NS NS NS NS NS −0.425∗ NS NS
1Significant correlations are expressed using a single asterisk (∗) for P< 0.05. 2NS= Not significant.
between ADF and NDF in alfalfa hay. Since both ADF and NDF are the representation of fiber in plant tissues with hemicelluloses being the only difference, the more ADF in corn, the greater the NDF content, as would be expected. Phosphorus is the most abundant mineral in corn following K content as a macro-mineral [6] and ash represents the total mineral content; therefore, it is not surprising to obtain a
signifi-cant correlation between ash and P in the current study. Phosphorus and CP correlated moder-ately, which is contrary to the results observed in Japonica rice and field beans by others [82,83]. However, those two studies correlated phytate P or phytic acid with protein content instead of total P as in the current study. Moreover, the difference in results between studies could be also, at least partially, due to the different
Table 10. Equations generated from single Linear Regression between variables that have significant correlations (P < 0.01)1.
Correlations Units P-value R R2 Equation
CP–Ash %–% ∗∗∗ 0.472 0.222 CP (%)= (2.662 × Ash) + 4.716 EE–b∗ %–score ∗∗ 0.426 0.183 EE (%)= (0.081 × b∗)+ 0.86 Ash–DM %–% ∗∗∗ 0.475 0.225 Ash (%)= (0.045 × DM) – 2.941 ADF–NDF %–% ∗∗∗ 0.713 0.508 ADF (%)= (0.2 × NDF) + 0.686 ADL–DM %–% ∗∗∗ 0.562 0.316 ADL (%)= (0.162 × DM) – 13.37 ADL–CP %–% ∗∗ 0.362 0.130 ADL (%)= (0.188 × CP) – 0.485 Starch–NDF %–% ∗∗ − 0.362 0.131 Starch (%)= (−0.547 × NDF) + 73.50 C16:0–Ash %–% ∗∗ − 0.390 0.152 C16:0 (%)= (−4.100 × Ash) + 15.26 C 18:0–Starch %–% ∗∗ − 0.379 0.143 C18:0 (%)= (−0.122 × Starch) + 9.869 C18:1–L∗ %–score ∗∗ 0.347 0.120 C18:1 (%)= (0.771 × L∗) – 38.29 C18:2–C16:0 %–% ∗∗∗ − 0.445 0.198 C18:2 (%)= (−1.029 × C16:0) + 68.96 C18:2–C18:1 %–% ∗∗∗ − 0.868 0.754 C18:2 (%)= (−0.990 × C18:1) + 86.16 C 18:3–DM %–% ∗∗ 0.416 0.174 C18:3 (%)= (0.066 × DM) – 4.700 C18:3–Ca %–% ∗∗∗ − 0.495 0.245 C18:3 (%)= (−3.186 × Ca) + 1.456 C18:3–Cu %–ppm ∗∗∗ − 0.476 0.226 C18:3 (%)= (−0.107 × Cu) + 1.463 C18:3–Pb %–ppm ∗ − 0.354 0.125 C18:3 (%)= (−0.404 × Pb) + 1.396 C18:3–Zn %–ppm ∗∗ − 0.362 0.131 C18:3 (%)= (−0.007 × Zn) + 1.400 Ca–EE %–% ∗∗ 0.401 0.161 Ca (%)= (0.023 × EE) + 0.007 Ca–b∗ %–score ∗∗ 0.405 0.164 Ca (%)= (0.004 × b∗) – 0.046 P–ADL %–% ∗∗ 0.415 0.172 P (%)= (0.045 × ADL) + 0.186 P–Ash %–% ∗∗∗ 0.634 0.402 P (%)= (0.206 × Ash) + 0.009 P–CP %–% ∗∗∗ 0.625 0.391 P (%)= (0.036 × CP) – 0.043 Cd–Cu ppm–ppm ∗∗∗ 0.498 0.247 Cd (ppm)= (0.010 × Cu) + 0.007 Cr–Ca ppm–% ∗∗∗ 0.528 0.278 Cr (ppm)= (4.785 × Ca) + 0.369 Cr–Zn ppm–ppm ∗∗ 0.409 0.167 Cr (ppm)= (0.012 × Zn) + 0.434 Cu–EE ppm–% ∗∗ 0.403 0.162 Cu (ppm)= (0.677 × EE) + 0.366 Pb–Cd ppm–ppm ∗∗∗ 0.639 0.409 Pb (ppm)= (5.847 × Cd) + 0.303 Pb–Cu ppm–ppm ∗∗∗ 0.641 0.411 Pb (ppm)= (0.126 × Cu) + 0.184 Pb–Zn ppm–ppm ∗∗∗ 0.459 0.210 Pb (ppm)= (0.008 × Zn) + 0.273 Zn–EE ppm–% ∗∗ 0.439 0.192 Zn (ppm)= (8.006 × EE) + 2.000 Zn–Ca ppm–% ∗∗∗ 0.672 0.452 Zn (ppm)= (208.0 × Ca) + 10.31 Zn–Cu ppm–ppm ∗∗∗ 0.484 0.234 Zn (ppm)= (5.245 × Cu) + 14.25
1Double asterisk (∗∗) indicates P< 0.01, and triple asterisk (∗∗∗) indicates P< 0.001, respectively.
plant species evaluated. A moderate correlation was found between ADL and DM (0.562). This result agrees with those of Wilkinson et al. [84] in which a low correlation was found between ADL and DM for coastal bermudagrass. Although crude ash was significantly correlated to DM (0.475) and CP (0.472), low R2 values
(0.225 and 0.222, respectively) obtained suggest that the calculated regression equations (Ta-ble10) would have limited practical significance in the field for these two correlations.
Correlations Between Fatty Acids and Color Characteristics
Significant correlations between fatty acids and color characteristics of corn samples are provided in Table 4. Notably, the negative
correlation (−0.868) between C18:2 and C18:1 was the highest correlation with a relatively high
R2(0.754) in the current study. Similarly, Green
[85] reported a very high (−0.97) negative corre-lation between C18:2 and C18:1 content in flax seed oil. In contrast, Kitta et al. [86] and Saas-tamoinen et al. [87] reported significant posi-tive correlations between C18:2 and C18:1 con-tent in rice and oat, respectively. Although there was a significant correlation between C18:2 and C16:0, its relatively low R2(0.198) decreases its
practical importance.
Correlations Between Heavy Metals and Color Characteristics
Significant correlations between heavy metal composition and color characteristics of corn
samples are provided in Table5. The low R2
val-ues (0.247 and 0.234) obtained for the significant correlations between Cd and Cu and between Zn and Cu suggest that the equations generated have limited practical importance. However, Cu (R2 = 0.411) and Cd (R2 = 0.409) correlated
well with Pb content in corn grains, indicating that these two heavy metals might be used for predicting the Pb levels in corn samples. Similar significant positive correlations have also been reported between the Cd and Pb levels in aspara-gus bean, Brassica Chinensis, rice, wild rice, and wheat [88–91]. The authors suggested that Pb could enhance the activity of plants to accu-mulate more Cd. This phenomenon seems to be also true for the corn grains in the current study. Moreover, our findings may also support the statement that plants are mostly contaminated by more than one metal in the field [92]. In wild rice, Pip [88] reported no correlation between Pb and Cu levels, which conflicted with the cur-rent study. Although the correlation between Zn and Pb was moderate, the low R2(0.210) again
suggested that the prediction equation generated would be of limited practical importance. How-ever, Lu et al. [93] reported a significant positive correlation between Pn and Zn concentrations in soils collected in China. Therefore, the phenom-ena of multiple heavy metal contamination may also be true for Pb and Zn levels in both soil and corn samples studied in the current study [92].
Correlations Between Nutrients, Heavy Metals, and Fatty Acids
Although four significant correlations (P< 0.01) existed between nutrients and heavy metals, only the correlation between Zn and Ca would be of practical importance with a relatively high R (0.672) and R2 (0.452) value
in the current study (Table 6). Among fatty acids, nutrients, and heavy metals, the strongest correlations were between Ca and C18:3 (R = −0.495), and Cu and C18:3 (R = −0.476) (Table7).
Deoxynivalenol Occurrence and Correlations for Deoxynivalenol
Deoxynivalenol was found in 26 out of the 49 corn samples tested (53%), with all DON
posi-tive samples having less than 1 ppm in the cur-rent study (Table8). Ransom et al. [94] reported DON as the most commonly detected mycotoxin with a 17% occurrence rate in 94 corn samples from North Dakota in USA. The result of the current study agreed with Oliveira et al. [95], who reported a frequency of DON occurrence in 48% of corn samples (n= 148), with a maximum level of 1 ppm in Brazil. However, the DON oc-currence in the current study is lower than a pre-vious study conducted in Turkey reporting 80% DON positivity in 20 corn samples [96]. The highest level of DON found in the current study is below the current advisory maximum level for use in feedstuffs of 10 ppm for poultry and rumi-nants by FDA [97]. Moreover, even the highest DON concentration (0.725 ppm) obtained in the current study was lower than the EU regulation limit of 1.75 ppm DON posted for unprocessed corn [98]. Nevertheless, while even the highest DON level can be regarded as safe for animals and humans, the high occurrence rate obtained in the current study implies a requirement for a close monitoring of DON levels in corn. No correlation of practical importance was found between DON and nutrients, heavy metals, and fatty acids in the current study (Table9).
CONCLUSIONS AND APPLICATIONS
1. The variation was especially high for Ca, P, and EE among the nutrients of corn, which may suggest a need to more close monitor-ing of these nutrients to optimize its utiliza-tion by animals.
2. The color characteristics (L∗, a∗, b∗) were not a good predictor of any nutrients, heavy metals, and DON concentration in corn grains.
3. Although all samples exceeded the maxi-mum tolerable limit set for Pb by EU for humans, they were within the safe limit for animals. All the other analyzed heavy metal (Cd, Cr, Cu, Ni, and Zn) levels were below the maximum tolerable levels set by differ-ent agencies both for humans and animals. 4. The results of the current study showed
that the significant correlations found be-tween nutrients, minerals, and heavy
met-als can be used to predict related contents such as C18:2, ADF, Zn, Pb, and P in corn grains.
5. None of the DON positive samples had con-centrations above maximum tolerable levels set by FDA and EU.
REFERENCES AND NOTES
1. Hilaire, L. 2000. Spanning the gap: Corn, an Amer-ican native, The newsletter of Delaware water gap na-tional recreation area, 22:1. Accessed Aug. 2017.http:// www.nps.gov/dewa/learn/nature/upload/cmsstgCORN.pdf.
2. Bruetsch, T. F., and G. O. Estes 1976. Genotype varia-tion in nutrient uptake efficiency in corn1. Agron. J. 68:521– 523.
3. Mehdi, B. B., C. A. Madramootoo, and G. R. Mehuys 1999. Yield and nitrogen content of corn under different tillage practices. Agron. J. 91:631–636.
4. Malumba, P., S. Janas, O. Roiseux, G. Sinnaeve, T. Masimango, M. Sindic, C. Deroanne, and F. Bera 2010. Com-parative study of the effect of drying temperatures and heat-moisture treatment on the physicochemical and functional properties of corn starch. Carbohydr. Polym. 79:633–641.
5. Viljoen, M., T. S. Brand, D. A. Brandt, and L. C. Hoff-man 2005. Prediction of the chemical composition of winter grain and maize with near infrared reflectance spectroscopy. South Afr. J. Plant Soil 22:89–93.
6. Batal, A. B., N. M. Dale, and U. K. Saha 2010. Min-eral composition of corn and soybean meal. J. Appl. Poult. Res. 19:361–364.
7. National Research Council (NRC). 2012. Nutrient Requirements of Swine. Natl. Acad. Press, Washington, DC. 8. Li, Q., J. Zang, D. Liu, X. Piao, C. Lai, and D. Li 2014. Predicting corn digestible and metabolizable energy content from its chemical composition in growing pigs. J. Anim. Sci. Technol. 5:1–11.
9. Cong, B., C. Maxwell, S. Luck, D. Vespestad, K. Richard, J. Mickelson, and C. Zhong 2015. Genotypic and environmental impact on natural variation of nutrient com-position in 50 non genetically modified commercial maize hybrids in North America. J. Agric. Food Chem. 63:5321– 5334.
10. Govind, P., and S. Madhuri 2014. Heavy metals caus-ing toxicity in animals and fishes. Res. J. Anim. Vet. Fish. Sci. 2:17–23.
11. Osma, E., M. Serin, Z. Leblebici, and A. Aksoy 2013. Assessment of heavy metal accumulations (Cd, Cr, Cu, Ni, Pb, and Zn) in vegetables and soils. Pol. J. Environ. Stud. 22: 1449–1455.
12. He, Z. L. L., X. E. Yang, and P. J. Staffella 2005. Trace elements in agroecosystems and impacts on the environment. J. Trace Elem. Med. Biol. 19:125–140.
13. Rotter, B. A. 1996. Invited review: Toxicology of deoxynivalenol (vomitoxin). J. Toxicol. Environ. Health. 48: 1–34.
14. Tanaka, T., A. Hasegawa, S. Yamamoto, U.S. Lee, Y. Sugiura, and Y. Ueno 1988. Worldwide contamination of ce-reals by the Fusarium mycotoxins nivalenol, deoxynivalenol, and zearalenone. 1. Survey of 19 countries. J. Agric. Food Chem. 36:979–983.
15. Pestka, J., and T. Smolinski 2005. Deoxynivalenol: toxicology and potential effects on humans. J. Toxicol. Env-iron. Health, Part B 8:39–69.
16. Awad, W. A., J. R. Aschenbach, F. M. C. S. Setyabudi, E. Razzazi-Fazeli, J. B¨ohm, and J. Zentek 2007. In vitro ef-fects of deoxynivalenol on small intestinal D-glucose uptake and absorption of deoxynivalenol across the isolated jejunal epithelium of laying hens. Poult. Sci. 86:15–20.
17. Xu, L., S. D. Eicher, and T. J. Applegate 2011. Effects of increasing dietary concentrations of corn naturally con-taminated with deoxynivalenol on broiler and turkey poult performance and response to lipopolysaccharide. Poult. Sci. 90:2766–2774.
18. Awad, W. A., K. Ghareeb, A. Dadak, L. Gille, K. Staniek, M. Hess, and J. B¨ohm 2012. Genotoxic effects of deoxynivalenol in broiler chickens fed low-protein feeds. Poult. Sci. 91:550–555.
19. Kos, J., E. J. Hajnal, B. ˇSari´c, P. Jovanov, N. Nedeljkovi´c, I. Milovanovi´c, and J. Krulj 2017. The influence of climate conditions on the occurrence of deoxynivalenol in maize harvested in Serbia during 2013–2015. Food Control. 73:734–740.
20. Retsch ZM 200, Retsch GmbH Co. KG, Haan, Germany.
21. Minolta ChromaMeter CR−300, Milano, Italy. 22. Model 5000, Foss NIRSystems Inc., Eden Prairie, MN.
23. AOAC. 2006. Official Methods of Analysis of AOAC International. 18th ed., AOAC Int., Gaithersburg, MD.
24. ISO (International Organization for Standardiza-tion). 2000. Animal Feeding Stuffs-Determination of Starch Content-Polarimetric Method. ISO 6493. ISO, Geneva, Switzerland.
25. Shimadzu GC-2010, Shimadzu Co., Kyoto, Japan. 26. SPTM-2380, Supelco, Bellefonte, PA.
27. FAME mix C8-C24, Supelco, Bellefonte, PA. 28. CEM MARS-5, Matthews, NC, USA. 29. Thermo Elemental X Series 2, UK.
30. ELX 800, Bio-tek Inst., Winooski, Vermont, USA. 31. Kl¨otzel, M., S. Schmidt, U. Lauber, G. Thielert, and H. U. Humpf 2005. Comparison of different clean-up pro-cedures for the analysis of deoxynivalenol in cereal-based food and validation of a reliable HPLC method. Chroma. 62:41–48.
32. Gebze/Kocaeli, 41470, Turkey.
33. Ultra-Turrax T50 basic, IKA Werke. GmbH and Co. KG, Staufen, Germany.
34. MN 619 1
4, Machery-Nagel, Dueren, Germany. 35. DON-Prep, R-Biopharm Rhone Ltd, Darmstadt, Germany.
36. Shimadzu LC-10 AD, Kyoto, Japan. 37. SPD-10AVP, Shimadzu, Kyoto, Japan.
38. SAS. 2003. SAS User’s Guide: Statistics. Version 9.1. ed. SAS Institute Inc., Cary, NC.
39. National Research Council (NRC). 1994. Nutrient Requirements of Poultry. 9th Rev. Ed. Natl. Acad. Press, Washington, DC.
40. Dale, N. 1994. Relationship between bushel weight, metabolizable energy, and protein content of corn from an adverse growing season. J. Appl. Poult. Res. 3:83–86.
41. Cromwell, G. L., C. C. Calvert, T. R. Cline, J. D. Crenshaw, T. D. Crenshaw, R. A. Easter, R. C. Ewan, C.
R. Hamilton, G. M. Hill, A. J. Lewis, D. C. Mahan, E. R. Miller, and J. L. Nelssen 1999. Variability among sources and laboratories in nutrient analyses of corn and soybean meal. NCR-42 Committee on Swine Nutrition. North Central Regional-42. J. Anim. Sci. 77:3262–3273.
42. Cowieson, A. J. 2005. Factors that affect the nutri-tional value of maize for broilers. Anim. Feed Sci. Technol. 119:293–305.
43. Singh, M., M. R. Paulsen, L. Tian, and H. Yao 2005. Site-specific study of corn protein, oil, and extractable starch variability using NIT spectroscopy. App. Engine. Agri. 21:239–251.
44. National Research Council (NRC). 1996. Nutrient Requirements of Beef Cattle. 7th Rev. Ed. Natl. Acad. Press, Washington, D.C.
45. Watson, S. A. 2003. Description, development, struc-ture, and composition of the corn kernel. Pages 69–106 in Corn: Chemistry and Technology. 2nd ed., White, PJ, and LA Johnson, eds, American Association of Cereal Chemists, Inc., St. Paul, MN.
46. Belyea, R. L., K. D. Rausch, and M. E. Tumbleson 2004. Composition of corn and distillers dried grains with solubles from dry grind ethanol processing. Bioresour. Tech-nol. 94:293–298.
47. Lee, J., D. S. Nam, and C. Kong 2016. Variability in nutrient composition of cereal grains from different origins. SpringerPlus. 5:419.
48. Goffman, F. D., and T. B¨ohme 2001. Relationship between fatty acid profile and vitamin e content in maize hybrids ( Zea mays L.). J. Agric. Food Chem. 49:4990– 4994.
49. Sabudak, T. 2007. Fatty acid composition of seed and leaf oils of pumpkin, walnut, almond, maize, sunflower and melon. Chem. Nat. Compd. 43:465–467.
50. Brizio, P., A. Benedetto, S. Squadrone, A. Curcio, M. Pellegrino, M. Ferrero, and M. C. Abete 2016. Heavy metals and essential elements in Italian cereals. Food Addit. Contam. Part B. 9:261–267.
51. Sandalio, L. M., H. C. Dalurzo, M. G´omez, M. C. Romero-Puertas, and L. A. R´ıo 2001. Cadmium-induced changes in the growth and oxidative metabolism of pea plants. J. Exp. Bot. 52:2115–2126.
52. Liu, H., S. Hussain, S. Peng, J. Huang, K. Cui, and L. Nie 2014. Potentially toxic elements concentration in milled rice differ among various planting patterns. Field Crops Res. 168:19–26.
53. Satarug, S., J. R. Baker, S. Urbenjapol, M. R. Haswell-Elkins, P. E. B. Reilly, and D. J. Williams 2003. A global perspective on cadmium pollution and toxicity in non-occupationally exposed population. Toxicol. Lett. 137:65– 83.
54. Joint FAO/WHO Food Standards Programme. 2001. Report of the 33rd Session of the Codex Committee on Food Additives and Contaminants. Hague, The Netherlands.
55. European Commission (EC). 2014. Commission Regulation (EU) No 488/2014 (2014). Amending Regula-tion (EC) No 1881/2006 as regards maximum levels of cad-mium in foodstuffs, 12 May 2014. Official J Eur Union. L138:75–79.
56. Wang, Y. T., and C. Xiao 1995. Factors affecting hexavalent chromium reduction in pure cultures of bacteria. Water Res. 29:2467–2474.
57. Jacobs, J. A., and S. M. Testa 2005. Overview of chromium (VI) in the environment: background and history.
Pages 1–22 in Chromium (VI) Handbook. Guertin, J. A., and C. P. Avakian eds. CRC, Boca Raton, FL.
58. Gao, Y., and J. Xia 2011. Chromium contamination accident in China: viewing environment policy of China. Environ. Sci. Technol. 45:8605–8606.
59. Alg¨ul, I., and D. Kara 2014. Determination and chemometric evaluation of total aflatoxin, aflatoxin B1, ochratoxin A and heavy metals content in corn flours from Turkey. Food Chem. 157:70–76.
60. Rai, V., P. Vajpayee, S. N. Singh, and S. Mehrotra 2004. Effect of chromium accumulation on photosynthetic pigments, oxidative stress defense system, nitrate reduction, proline level and eugenol content of Ocimum tenuiflorum L. Plant Sci. 167:1159–1169.
61. Smith, S., P. J. Peterson, and K. H. M. Kwan 1989. Chromium accumulation, transport and toxicity in plants. Toxicol. Environ. Chem. 24:241–251.
62. National Research Council (NRC). 2005. Mineral Tolerance of Animals. 2nd Rev. Ed. Natl. Acad. Press, Wash-ington, DC.
63. Kuo, S. 1981. Effects of drainage and long-term ma-nure application on nitrogen, copper, zinc, and salt distribu-tion and availability in soils1. J. Environ. Qual. 10:365–368. 64. Yang, F., H. Cao, R. Su, J. Guo, C. Li, J. Pan, and Z. Tang 2017. Liver mitochondrial dysfunction and electron transport chain defect induced by high dietary copper in broilers. Poult Sci.https://doi.org/10.3382/ps/pex137.
65. Jia, L., W. Wang, Y. Li, and L. Yang 2010. Heavy metals in soil and crops of an intensively farmed area: a case study in Yucheng City, Shandong Province, China. Int. J. Environ. Res. Public Health. 7:395–412.
66. Olu, M., O. I. Olufade, O. O. Adekoyeni, and M. O. Jimoh 2013. Evaluation of heavy metal concentration in maize grown in selected industrial areas of Ogun State and its effects on urban food security. Int. J. Sci. Technol. Soc. 1:48–56.
67. Trumbo, P., A. A. Yates, S. Schlicker, and M. Poos 2001. Dietary reference intakes. J. Am. Diet. Assoc. 101:294–301.
68. ATSDR. 2011. Toxic Substances Portal, Agency for Toxic Substances & Disease Registry. Accessed Aug. 2017.
http://www.atsdr.cdc.gov/substances/toxsubstance.asp? toxid=44.
69. Ling, J. R., and R. M. Leach, Jr. 1979. Studies on nickel metabolism: interaction with other mineral elements. Poult. Sci. 58:591–596.
70. Oscar, T. P., D. M. Mitchell, H. M. Engster, B. R. Mal-one, and W. M. Watson 1995. Growth performance, carcass composition, and pigmentation of broilers fed supplemental nickel. Poult. Sci. 74:976–982.
71. Piscator, M., and B. Lind 1972. Cadmium, zinc, cop-per, and lead in human renal cortex. Arch. Environ. Health Int. J. 24:426–431.
72. Bakalli, R. I., I. G. Pesti, and W. L. Ragland 1995. The magnitude of lead toxicity in broiler chickens. Vet. Hum. Toxicol. 37:17–19.
73. Lavado, R. S., C. A. Porcelli, and R. Alvarez 2001. Nutrient and heavy metal concentration and distribution in corn, soybean and wheat as affected by different tillage sys-tems in the Argentine Pampas. Soil Till. Res. 62:55–60.
74. European Commission (EC). 2011. Commission Regulation (EU) No 420/2011. Amending Regulation (EC) No 1881/2006 setting maximum levels for certain
contam-inants in foodstuffs, 29 April 2011. Official J. Eur. Union. L111:3–6.
75. Chesters, J. 1997. Zinc. Pages 185–230 in Handbook of Nutritionally Essential Mineral Elements. O’Dell, B., and R. Sunde, eds. Marcel Dekker Inc., New York, NY.
76. Suttle, N. F. 2010. The Mineral Nutrition of Live-stock. 4th ed. CABI Publishing, Oxfordshire, UK.
77. Demirkıran, A. R. 2009. Determination of Fe, Cu, and Zn contents of wheat and corn grains from different growing site. J. Anim. Vet. Adv. 8:1563–1567.
78. Park, S. Y., S. G. Birkhold, L. F. Kubena, D. J. Nisbet, and S. C. Ricke 2004. Review on the role of dietary zinc in poultry nutrition, immunity, and reproduction. Biol. Trace Elem. Res. 101:147–164.
79. National Research Council (NRC). 1988. Nutrient Requirements of Dairy Cattle. 6th Rev. Ed. Natl. Acad. Press, Washington, DC.
80. Southern, L. L., and D. H. Baker 1983. Zinc toxicity, zinc deficiency and zinc-copper interrelationship in Eimeria acervulina-infected chicks. J. Nutr. 113:688–696.
81. Wang, N., and J. K. Daun 2006. Effects of variety and crude protein content on nutrients and anti-nutrients in lentils (Lens culinaris). Food Chem. 95:493–502.
82. Griffiths, D. W., and T. A. Thomas 1981. Phytate and total phosphorus content of field beans (Vicia faba L.). J. Sci. Food Agric. 32:187–192.
83. Liu, Z., F. Cheng, and G. Zhang 2005. Grain phytic acid content in japonica rice as affected by cultivar and en-vironment and its relation to protein content. Food Chem. 89:49–52.
84. Wilkinson, S. R., W. E. Adams, and W. A. Jackson 1970. Chemical composition and in vitro digestibility of ver-tical layers of coastal bermudagrass (Cynodon dactylon L.)1. Agron J. 62:39–43.
85. Green, A. G. 1986. A mutant genotype of flax (Linum usitatissimum L.) containing very low levels of linolenic acid in its seed oil. Can. J. Plant Sci. 66:499–503.
86. Kitta, K., M. Ebihara, T. Iizuka, R. Yoshikawa, K. Is-shiki, and S. Kawamoto 2005. Variations in lipid content and fatty acid composition of major non-glutinous rice cultivars in Japan. J. Food Compos. Anal. 18:269–278.
87. Saastamoinen, M., J. Kumpulainen, and S. Nummela 1989. Genetic and environmental variation in oil content and fatty acid composition of oats. Cereal Chem. 66:296–300.
88. Pip, E. 1993. Cadmium, copper and lead in wild rice from central Canada. Arch. Environ. Contam. Toxicol. 24:179–181.
89. Qin, T., Y. Wu, and H. Wang 1994. Effect of cad-mium, lead and their interactions on the physiological
and biochemical characteristics of Brassica chinensis. Acta. Ecol. Sin. 14:46–50.
90. Lin, Q., H. Chen, C. Zheng, and Y. Chen 1999. Chem-ical behavior of Cd, Pb and their interaction in rhizosphere and bulk. J. Zhejiang Univ. (Agric Life Sci). 26:527–532.
91. Zhu, Y., H. Yu, J. Wang, W. Fang, J. Yuan, and Z. Yang 2007. Heavy metal accumulations of 24 asparagus bean cultivars grown in soil contaminated with Cd alone and with multiple metals (Cd, Pb, and Zn). J. Agric. Food Chem. 55:1045–1052.
92. Wang, F. Y., X. G. Lin, R. Yin, and L. H. Wu 2006. Effects of arbuscular mycorrhizal inoculation on the growth of Elsholtzia splendens and Zea mays and the activities of phosphatase and urease in a multi-metal-contaminated soil under unsterilized conditions. Appl. Soil Ecol. 31:110–119. 93. Lu, Y., Z. Gong, G. Zhang, and W. Burghardt 2003. Concentrations and chemical speciations of Cu, Zn, Pb and Cr of urban soils in Nanjing, China. Geoderma. 115:101– 111.
94. Ransom, J., K. Kinzer, M. McMullen, M. Mostrom, I. Mutukwa, and A. Friskop 2016. Prevalence of mycotoxins in late-season corn ear molds in North Dakota. AJPS. 7:709– 714.
95. Oliveira, M. S., A. Rocha, M. Sulyok, R. Krska, and C. A. Mallmann 2017. Natural mycotoxin contamination of maize (Zea mays L.) in the South region of Brazil. Food Control. 73:127–132.
96. Numanoglu, E., U. Uygun, H. Koksel, and M. Sol-frizzo 2010. Stability of fusarium toxins during traditional Turkish maize bread production. Qual Assur Saf Crop. 2:84– 92.
97. Food and Drug Administration (FDA). 2010. Guid-ance for Industry and FDA: Advisory Levels for Deoxyni-valenol (DON) in Finished Wheat Products for Human Con-sumption and Grains and Grain by-Products Used for Animal Feed. US FDA, Silver Spring, MD.
98. European Commission (EC). 2007. Commission Regulation (EC) No 1126/2007 of 28 September 2007 amending Regulation (EC) No 1881/2006 setting maximum levels for certain contaminants in foodstuffs as regards Fusar-ium toxins in maize and maize products. Official J Eur Union. L255:14–17.
Acknowledgments
This study was supported by Scientific Research Projects Coordination Unit of Istanbul University. Project num-ber TSA-2017- 23791. Therefore, we gratefully appreci-ate Istanbul University for providing the aforementioned grant.