THE AGRICULTURAL STRUCTURE OF TURKEY IS CHANGING
Seyfettin Gürsel1 ve Ulaş Karakoç2Executive Summary
The agricultural structure of Turkey has changed considerably since 2001, in contrast to the relative stagnation between 1991 and 2001. The percentage of the number of enterprises working on an area less than 20 decares has decreased from 33.4 to 24.8 percent. This is indicative of the elimination of small-scale enterprises in agriculture and partly of a consolidation of medium and large-scale ones. The increase in the average scale of an enterprise has partly been boosted by renting of land by medium and large enterprises. On the other hand, this has taken place at the expense of further fragmentation of land parcels.
A parallel development has been a change in the crop pattern. The smallest and the largest
enterprises have a tendency towards cultivating fruits instead of traditional field crops. Moreover, total irrigated area nearly doubled since 2001, a sign of increasing land productivity and continuing
technological change, the deep rooted structural problems of the sector notwithstanding. Small-Scale Producers are Being Driven out of the Market
TurkStat announced the preliminary results of the Agricultural Enterprise Structure Survey last
December. This research brief compares the results of this survey with those of Agricultural Censuses conducted in 1991 and 2001. Thus, we will see how the agricultural enterprises have transformed between 1991 and 2006 in general terms.
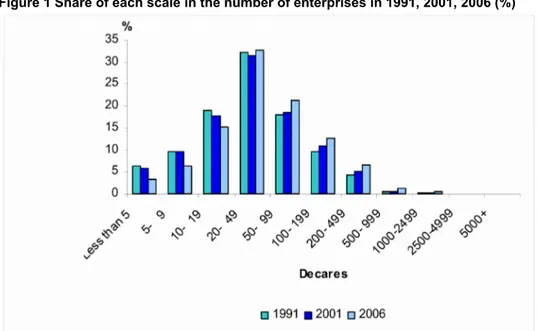
Figure 1 shows the scale distribution of enterprises for each year. The change between 1991 and 2001 does not seem to be in any particular direction. However, the situation definitely changes after 2001: the share of the producers producing on 20 decares or less decreases from 33.4 to 24.8 percent. On the other hand, those operating on larger areas proliferate. The share of the enterprises larger than 100 decares jumped from 16.64 to 21.1 percent. This indicates that, after 2001, the smallest producers have been driven out of the agricultural markets, and in parallel, the medium and large-scale producers have filled their place.
We calculate that the average landholding of enterprises was around 70 decares in 1991 and 2001, and 93 decares in 2006.3 This change was driven, for the most part, through the elimination of the smallest producers for whom production became unsustainable. The increase in the average landholding is not only indicative of the proliferation of the large-scale modern farms, but also of the fact that the minimum amount of land necessary for profitable production has increased for traditional family enterprises.
1 Prof.Dr. Seyfettin Gürsel, Director, betam, seyfettin.gursel@bahcesehir.edu.tr
6 February 2008
Research Brief 09/24
Figure 1 Share of each scale in the number of enterprises in 1991, 2001, 2006 (%)
Sources: TurkStat 2006 Agricultural Enterprise Structure Survey, 1991 and 2001 Agricultural Censuses
Figure 2 indicates the share of each scale in total agricultural land. Large-scale enterprises operating on 500 decares or more have diminished their total land possession between 1991 and 2001, in favor of those producing on 50-500 decares, whose share increased from 60.7 to 67.3 percent. As for the 2001-2006 period, the share of those producing on less than 200 decares seems to have decreased partially, while larger scales augments. In 1991 and 2001, the enterprises of the size 100-199 decares held the largest share in total land, whereas in 2006, it was the size of 200-499 decares.
Combining this information with the number of enterprises, it is obvious that the medium scale
enterprises (20-200 decares) proliferated even though there was a fall in their share in total land (from 60.5 to 52 percent) after 2001. In addition, the producers operating on more than 200 decares
increased their share of land possession from 34.2 to 44.7 percent.
Figure 2 Share of each scale in total land (%)
In summary, we find that the medium scale enterprises that had consolidated themselves in number and land possession, experienced a decrease in the latter after 2001. Moreover, the smallest scale (less than 20 decares) had succeeded to survive until 2001, but has been dropping out of the market since then.
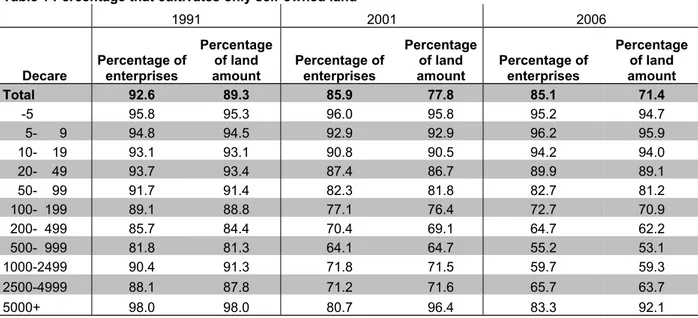
Medium and Large Scale Enterprises are Consolidating Themselves through Renting of Land Sharecropping and renting are basic characteristics of the Turkish agriculture. TurkStat survey sheds light on how this has changed recently.1 In Table 1, we summarize the number of the producers that cultivate only self-owned land. Thus for example, in 1991, 92.6 percent of all enterprises cultivate only their self-owned land, that is, 7.4 percent of all enterprises are leasing land.
It seems that the percentage of the number of those who are cultivating only self-owned land decreased from 92.6 to 85.9 percent between 1991 and 2001. This fall has continued after 2001. By 2006, around 30 percent of all agricultural land was rented. Considering each scale, we observe that the renting of land expanded significantly in the scales of more than 20 decares between 1991 and 2001, and in the scales of more than 100 decares after 2001.
Therefore, we can conclude that medium and large-scale enterprises consolidated themselves through renting land previously owned by the smaller producers who have been exiting the sector.
Table 1 Percentage that cultivates only self-owned land
1991 2001 2006 Decare Percentage of enterprises Percentage of land amount Percentage of enterprises Percentage of land amount Percentage of enterprises Percentage of land amount Total 92.6 89.3 85.9 77.8 85.1 71.4 -5 95.8 95.3 96.0 95.8 95.2 94.7 5- 9 94.8 94.5 92.9 92.9 96.2 95.9 10- 19 93.1 93.1 90.8 90.5 94.2 94.0 20- 49 93.7 93.4 87.4 86.7 89.9 89.1 50- 99 91.7 91.4 82.3 81.8 82.7 81.2 100- 199 89.1 88.8 77.1 76.4 72.7 70.9 200- 499 85.7 84.4 70.4 69.1 64.7 62.2 500- 999 81.8 81.3 64.1 64.7 55.2 53.1 1000-2499 90.4 91.3 71.8 71.5 59.7 59.3 2500-4999 88.1 87.8 71.2 71.6 65.7 63.7 5000+ 98.0 98.0 80.7 96.4 83.3 92.1
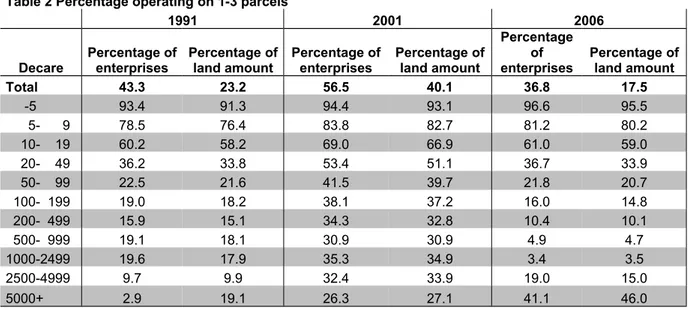
Land Fragmentation is Accelerating
The fragmentation of land parcels is a major structural problem of the Turkish agriculture. Table 2 indicates the number of enterprises whose land is composed of 1-3 parcels, as an indication of land concentration.
It can clearly be seen that landholdings concentrated to some degree between 1991 and 2001: The percentage of enterprises operating on 1-3 parcels increased from 43.3 to 56.5 percent. Note that this increase was observed in all scales.
On the contrary, after 2001, this trend was reversed and land fragmentation has been accelerating. Quite expectedly, it seems that as the land possession of enterprises increases, the fragmentation increases, too. While 23.2 percent of all agricultural land is composed of 1-3 parcels in 1991, this was 40.1 and 17.5 percent in 2001 and 2006, respectively.
We need more detailed data to give a full account of the acceleration of fragmentation; however, this may be a tentative explanation: First, the land parcels have a tendency towards fragmentation because of inheritance laws, encouraging dividing holdings among family members upon the death of the family head. Secondly, the ubiquity of shared title on land complicates land sales. Lastly, and 1
independently of these structural aspects, the expansion of the landholdings of medium and large-scale enterprises at the expense of smaller ones seems to have given a further push to fragmentation.
Additionally, in the last few years, the increasing costs are driving small producers out of the market. However, many farmers still see land possession as a social safety net and thereby tend to lease, rather than sell, their land.
Table 2 Percentage operating on 1-3 parcels
1991 2001 2006 Decare Percentage of enterprises Percentage of land amount Percentage of enterprises Percentage of land amount Percentage of enterprises Percentage of land amount Total 43.3 23.2 56.5 40.1 36.8 17.5 -5 93.4 91.3 94.4 93.1 96.6 95.5 5- 9 78.5 76.4 83.8 82.7 81.2 80.2 10- 19 60.2 58.2 69.0 66.9 61.0 59.0 20- 49 36.2 33.8 53.4 51.1 36.7 33.9 50- 99 22.5 21.6 41.5 39.7 21.8 20.7 100- 199 19.0 18.2 38.1 37.2 16.0 14.8 200- 499 15.9 15.1 34.3 32.8 10.4 10.1 500- 999 19.1 18.1 30.9 30.9 4.9 4.7 1000-2499 19.6 17.9 35.3 34.9 3.4 3.5 2500-4999 9.7 9.9 32.4 33.9 19.0 15.0 5000+ 2.9 19.1 26.3 27.1 41.1 46.0
Smallest and Largest Enterprises Tend to Cultivate Fruits
TurkStat’s survey includes some information on field crops: fallow, vegetables and flowers, fruit orchards and other permanent crops, poplar and willow grove, woodland, permanent pasture, unused potentially productive land, meadows and non-agricultural land (See Table 3). Between 1991 and 2006, there does not seem to be a significant change between 1991 and 2001, except a decrease in the share of unused and the non-agricultural land. Since 2001, the share of field crops has increased by 2.8 percentage points.
What is remarkable is that the enterprises of size less than 50 decares reduced the share of field crops between 1991 and 2001. Similarly, there is a limited increase in the share of fruits. But, looking at each scale, it seems that the smallest and largest enterprises enlarged their cultivation of fruits. While, in 1991, the enterprises of size less than 100 decares allocated 19.5 percent of the land to fruits on average, this increased to 24.9 and 30.7 percent in 2001 and 2006, respectively. The largest producers, running on more than 2500 decares, partly replaced fruits with field crops after 2001. Here is a possible explanation: The decreasing prices of traditional field crops like grains, corns and sugar beet accompanied by massive supplies in them may have caused farmers to switch to more profitable crops like fruits. However, only two types of farmers may have been able to do this: The large enterprises that can afford the investment costs and the smallest ones for which such an investment could be financed by a small amount of credit. Besides, we must bear in mind that the regions more suitable for fruit cultivation are at the same time the regions where the average farm size is smaller.
Table 3 The percentage of field crops and fruits in total land for each
scale (%)
1991 2001 2006
Decare cropsField Fruits Others cropsField Fruits Others cropsField Fruits Others Turkey 67.3 8.3 24.4 66.5 9.5 24.0 69.7 9.4 20.9 Less than 5 43.8 30.9 25.2 33.5 39.6 26.8 33.1 48.1 18.8 5- 9 53.8 27.3 19.0 39.5 38.2 22.3 36.1 49.7 14.2 10- 19 58.9 23.4 17.7 48.5 29.4 22.1 46.9 39.1 14.0 20- 49 61.7 16.7 21.6 56.1 20.6 23.2 58.9 24.4 16.7 50- 99 65.6 10.4 24.0 65.0 11.9 23.1 66.6 13.7 19.7 100- 199 69.3 5.6 25.1 71.1 5.3 23.6 74.0 5.6 20.3 200- 499 69.2 3.0 27.8 73.1 2.5 24.3 75.0 3.0 22.0 500- 999 71.9 2.1 26.0 76.4 2.1 21.5 76.0 1.6 22.4 1000-2499 71.8 1.7 26.5 74.6 3.0 22.3 76.5 2.1 21.4 2500-4999 80.6 1.4 18.1 80.1 1.3 18.6 71.0 7.0 22.0 5000+ 73.0 0.4 26.6 42.3 1.4 56.3 43.8 2.9 53.3 Irrigation
As seen in Figure 3, the amount of irrigated areas increased from 14.4 to 24.1 percent between 1991 and 2006. It nearly doubled in this period, especially in the cultivation of field crops. The only exception has been the fruit and vegetable farms.
Figure 3 Percentage of irrigated area with respect to the land use
TurkStat has not released further information on production technologies. However, it can be inferred that the expansion of irrigation facilities may have taken the level of mechanization further, and have rendered crop rotation possible. Thus irrigation may be a good proxy for technical change in general. Better irrigation may mean more extensive use of the labor force, fertilizers and chemicals, which implies an increase in land productivity and integration of producers to the markets. On another note, this may partly account for the increasing size of the seasonal rural labor force in Turkey.