SERVICES PULL EMPLOYMENT
Seyfettin Gürsel
*Gökçe Uysal
∗∗ve Ayşenur Acar
∗∗∗Abstract
Seasonally adjusted labor market data shows that non-agricultural unemployment decreased from 11.7 percent in
September 2012 to 11.5 percent in October 2012. We have not observed a sizeable increase in non-agricultural
unemployment for a year. Increases in non-agricultural employment mostly stem from increases in service
employment. Half of the increases in service employment are due to the increases in following sub-sectors:
administrative and support service activities, public administration and defense, education, human health and
social work activities.
Strong increases in non-agricultural labor force and non-agricultural employment
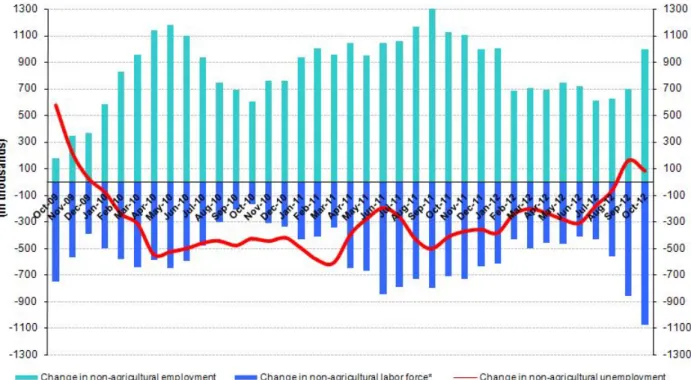
According to the data released by TurkSTAT, non-agricultural labor force increased by 1 million 74 thousand (5.2
percent), the non-agricultural employment increased by 993 thousand (5.5 percent) and non-agricultural
unemployment increased by 81 thousand to 2 million 469 thousand persons in the period of October 2012 on a
year on year basis (Figure 1).
Figure 1 Year-on-year changes in non-agricultural labor force, employment and unemployment
Source: TurkSTAT, Betam
* Prof. Dr. Seyfettin Gürsel, Betam, Director, [email protected]
∗∗ Yrd. Doç. Dr. Gökçe Uysal, Betam, Vice Director, [email protected] ∗∗∗ Ayşenur Acar, Betam, Research Assistant, [email protected]
Labor Market Outlook:
January 2013
An increase in seasonally adjusted non-agricultural unemployment
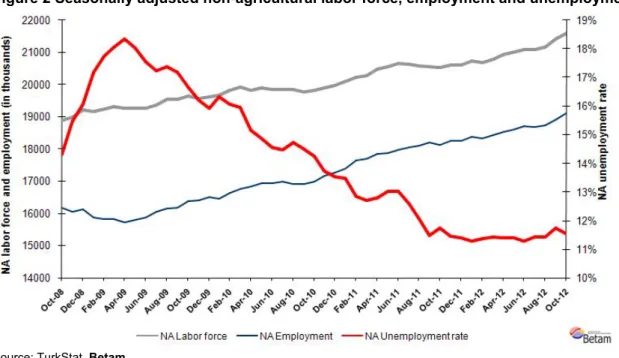
According to seasonally adjusted data, compared to the period of September 2012, non-agricultural labor force
increased by 176 thousand to 21 million 598 thousand in the period of October2012 (Figure 2, Table 1).
Non-agricultural employment increased by 201 thousand to 19 million 107 thousand. Consequently, the number of
persons in non-agricultural decreased by 25 thousand, non-agricultural unemployment rate decreased from 11.7
percent to 11.5 percent.
Figure 2 Seasonally adjusted non-agricultural labor force, employment and unemployment
Source: TurkStat, Betam
According to Kariyer.net data, increase in non-agricultural unemployment continues
Application per vacancy calculated by using series released by Kariyer.net
1indicates that non-agricultural
unemployment rate will increase slightly in the period of November 2012.
Figure 1 Seasonally adjusted non-agricultural unemployment rate and application per vacancy
Data source: Kariyer.net, TurkStat, Betam
1
Betam has been calculating application per vacancy using series released by Kariyer.net for a while. Seasonal and calendar adjustment
procedure is applied to application per vacancy series. A decrease in applications per vacancy may be caused by an increase in vacancies or by a decrease in the number of applications. An increase in vacancies signals economic growth while decreasing number of applications indicates a decrease in number of people looking for a job.Increase in service employment continues
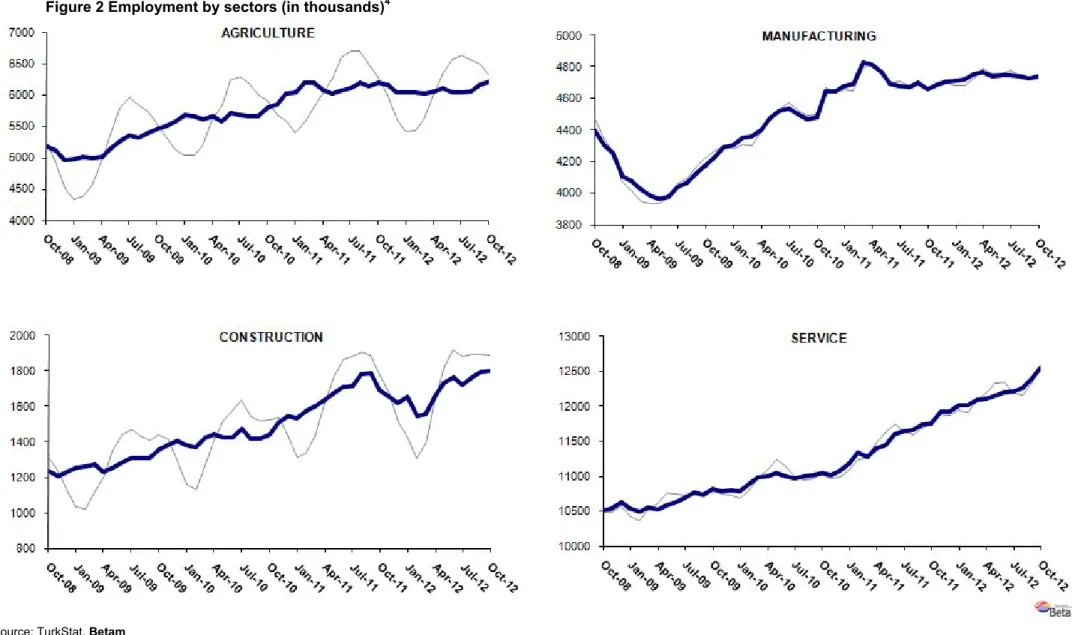
Seasonally adjusted data shows that service employment increased by 160 thousand in October 2012 compared to
September 2012 (Table 2, Figure 4)2. Manufacturing employment increased by only 9 thousand, while construction
employment increased by 8 thousand in this period.
Employment increased by 1 million 19 thousand in the past year. Approximately 800 thousand of the increase
stems from increases in service employment. To study the driving factors behind the increase, we seasonally
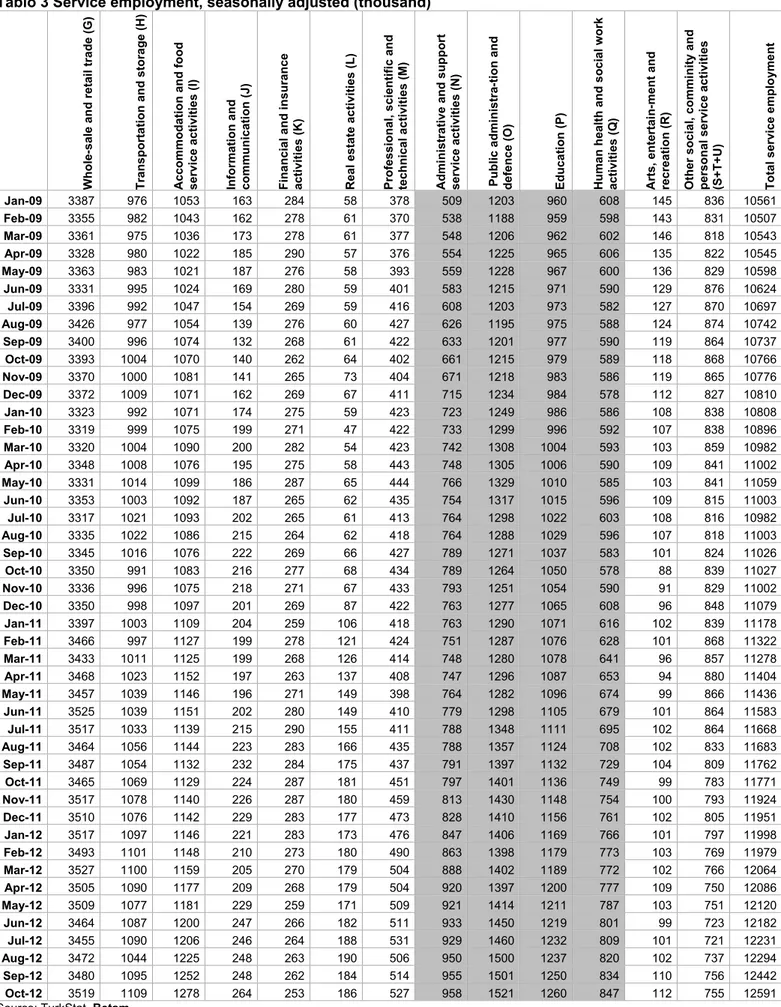
adjust service employment data by subsectors (Table 3).
3Increases in service employment are concentrated in
certain sub-sectors. We grouped those sub-sectors, which are administrative and support service activities (N),
public administration and defence (O), education (P) and human health and social work activities (Q). This group
created 652 thousand jobs in service employment, which is 80 percent of the 820 thousand increase in service
employment in the past year. This group constitutes 72 thousand of the 148 thousand increases in service
employment from October 2012 to September 2012 as well.
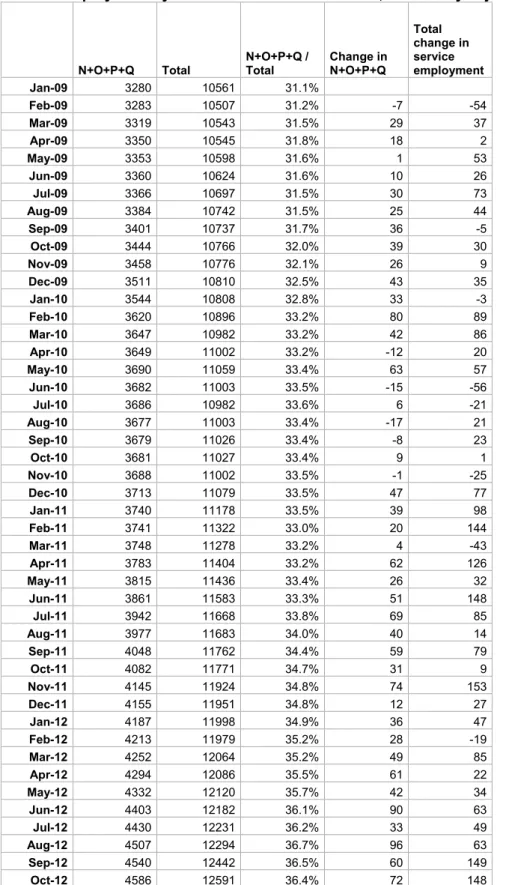
Seasonally adjusted service employment series show that share of this group (administrative and support service
activities (N), public administration and defence (O), education (P) and human health and social work activities (Q)
in total service employment has been increasing regularly. While the share of the group is 31.1 percent in October
2009, it increased to 36.4 percent in October 2012. In other words, more employment was created in this group
relative to other sub-sectors.
2 Seasonal adjustment procedure is applied to each sector of employment series separately. Hence the sum of these series may
differ from the seasonally adjusted series of total employment. The difference stems from the non-linearity of the seasonal adjustment process.
3
Seasonal adjustment procedure is applied to each sub-sector of service employment separately. Hence the sum of these series may differ from the seasonally adjusted series of total service employment. The difference stems from the non-linearity of the seasonal adjustment process.
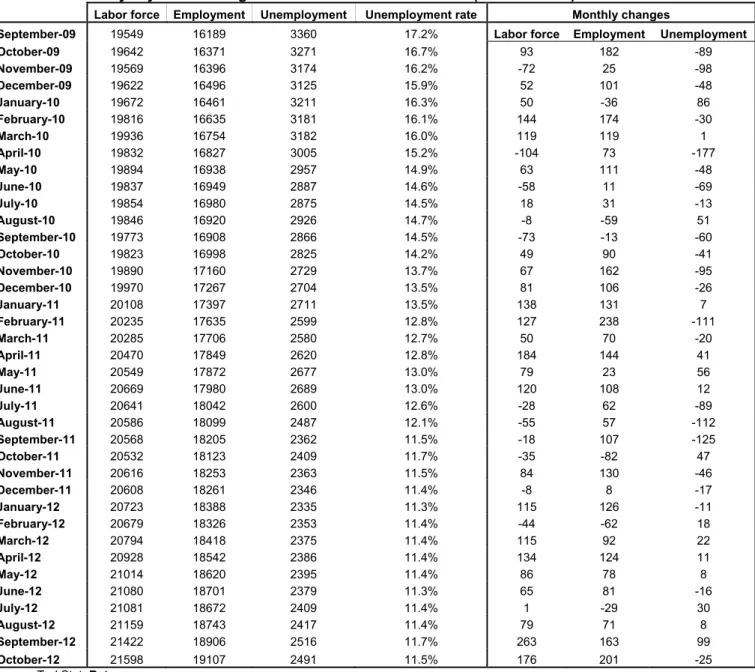
Tablo 1 Seasonally adjusted non-agricultural labor force indicators (in thousands)
Labor force Employment Unemployment Unemployment rate Monthly changes
September-09 19549 16189 3360 17.2% Labor force Employment Unemployment
October-09 19642 16371 3271 16.7% 93 182 -89 November-09 19569 16396 3174 16.2% -72 25 -98 December-09 19622 16496 3125 15.9% 52 101 -48 January-10 19672 16461 3211 16.3% 50 -36 86 February-10 19816 16635 3181 16.1% 144 174 -30 March-10 19936 16754 3182 16.0% 119 119 1 April-10 19832 16827 3005 15.2% -104 73 -177 May-10 19894 16938 2957 14.9% 63 111 -48 June-10 19837 16949 2887 14.6% -58 11 -69 July-10 19854 16980 2875 14.5% 18 31 -13 August-10 19846 16920 2926 14.7% -8 -59 51 September-10 19773 16908 2866 14.5% -73 -13 -60 October-10 19823 16998 2825 14.2% 49 90 -41 November-10 19890 17160 2729 13.7% 67 162 -95 December-10 19970 17267 2704 13.5% 81 106 -26 January-11 20108 17397 2711 13.5% 138 131 7 February-11 20235 17635 2599 12.8% 127 238 -111 March-11 20285 17706 2580 12.7% 50 70 -20 April-11 20470 17849 2620 12.8% 184 144 41 May-11 20549 17872 2677 13.0% 79 23 56 June-11 20669 17980 2689 13.0% 120 108 12 July-11 20641 18042 2600 12.6% -28 62 -89 August-11 20586 18099 2487 12.1% -55 57 -112 September-11 20568 18205 2362 11.5% -18 107 -125 October-11 20532 18123 2409 11.7% -35 -82 47 November-11 20616 18253 2363 11.5% 84 130 -46 December-11 20608 18261 2346 11.4% -8 8 -17 January-12 20723 18388 2335 11.3% 115 126 -11 February-12 20679 18326 2353 11.4% -44 -62 18 March-12 20794 18418 2375 11.4% 115 92 22 April-12 20928 18542 2386 11.4% 134 124 11 May-12 21014 18620 2395 11.4% 86 78 8 June-12 21080 18701 2379 11.3% 65 81 -16 July-12 21081 18672 2409 11.4% 1 -29 30 August-12 21159 18743 2417 11.4% 79 71 8 September-12 21422 18906 2516 11.7% 263 163 99 October-12 21598 19107 2491 11.5% 176 201 -25
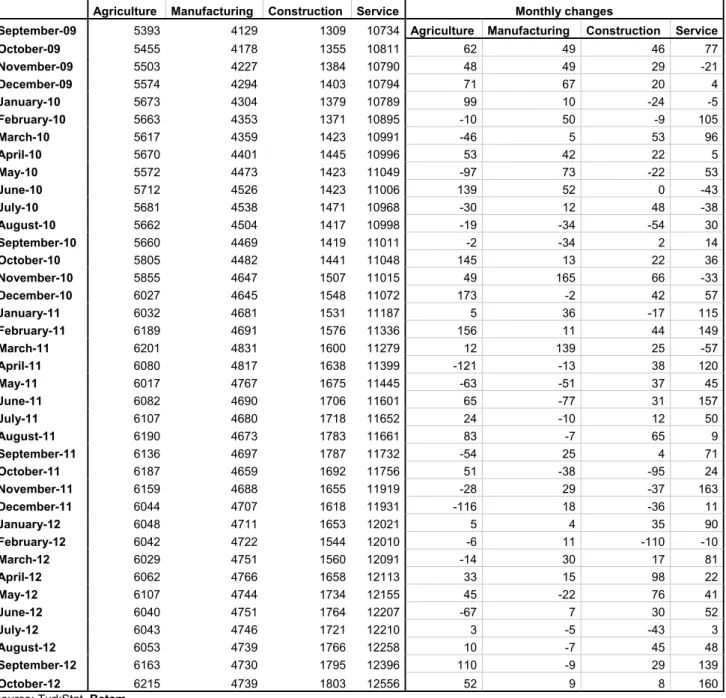
Tablo 2 Seasonally adjusted employment by sector (in thousands)
Agriculture Manufacturing Construction Service Monthly changes
September-09 5393 4129 1309 10734 Agriculture Manufacturing Construction Service
October-09 5455 4178 1355 10811 62 49 46 77 November-09 5503 4227 1384 10790 48 49 29 -21 December-09 5574 4294 1403 10794 71 67 20 4 January-10 5673 4304 1379 10789 99 10 -24 -5 February-10 5663 4353 1371 10895 -10 50 -9 105 March-10 5617 4359 1423 10991 -46 5 53 96 April-10 5670 4401 1445 10996 53 42 22 5 May-10 5572 4473 1423 11049 -97 73 -22 53 June-10 5712 4526 1423 11006 139 52 0 -43 July-10 5681 4538 1471 10968 -30 12 48 -38 August-10 5662 4504 1417 10998 -19 -34 -54 30 September-10 5660 4469 1419 11011 -2 -34 2 14 October-10 5805 4482 1441 11048 145 13 22 36 November-10 5855 4647 1507 11015 49 165 66 -33 December-10 6027 4645 1548 11072 173 -2 42 57 January-11 6032 4681 1531 11187 5 36 -17 115 February-11 6189 4691 1576 11336 156 11 44 149 March-11 6201 4831 1600 11279 12 139 25 -57 April-11 6080 4817 1638 11399 -121 -13 38 120 May-11 6017 4767 1675 11445 -63 -51 37 45 June-11 6082 4690 1706 11601 65 -77 31 157 July-11 6107 4680 1718 11652 24 -10 12 50 August-11 6190 4673 1783 11661 83 -7 65 9 September-11 6136 4697 1787 11732 -54 25 4 71 October-11 6187 4659 1692 11756 51 -38 -95 24 November-11 6159 4688 1655 11919 -28 29 -37 163 December-11 6044 4707 1618 11931 -116 18 -36 11 January-12 6048 4711 1653 12021 5 4 35 90 February-12 6042 4722 1544 12010 -6 11 -110 -10 March-12 6029 4751 1560 12091 -14 30 17 81 April-12 6062 4766 1658 12113 33 15 98 22 May-12 6107 4744 1734 12155 45 -22 76 41 June-12 6040 4751 1764 12207 -67 7 30 52 July-12 6043 4746 1721 12210 3 -5 -43 3 August-12 6053 4739 1766 12258 10 -7 45 48 September-12 6163 4730 1795 12396 110 -9 29 139 October-12 6215 4739 1803 12556 52 9 8 160
Figure 2 Employment by sectors (in thousands)
4Source: TurkStat, Betam