REVIVAL IS BECOMING CLEAR
Zümrüt İmamoğlu* ve Barış Soybilgen
†Executive Summary
In November, the industrial production index (IPI) increased by 1.5 percent from October. Export volume index decreased by 4.8 percent, whereas import volume index increased by 4.9 percent. The increases in the import and production indices imply that domestic demand has been recovering, and consumption and investment increased in the fourth quarter. On the other hand, the increase in exports is not large enough to make net exports contribute positively to growth. Therefore, we keep our 4th quarter growth forecasts same, but we
increase our current account deficit forecast slightly. Betam’s quarter on quarter (QoQ) growth forecast for the fourth quarter of 2012 is 1.2 percent. The corresponding year of year (YoY) growth rate is 3.0 percent and the annual GDP growth rate estimate for 2012 is 2.7 percent. Trade deficit continued to shrink but at a slower pace in November due to increase in imports. Betam revised its forecast for the current account deficit upwards to 6.4 percent from 6.3 percent previously.
* Dr. Zümrüt İmamoğlu, Betam, Research Associate. [email protected]
† Barış Soybilgen, Betam, Research Assistant,
Table 1. Betam’s quarterly and annual growth rate forecasts
Source: Betam
*sa: seasonally and calendar day adjusted **ca: calendar day adjusted
Domestic demand driven growth causes net exports to contribute negatively
The revival in the economy becomes more clear after the data release for November. The increase in imports is a significant indicator of the recovery in domestic demand. Even though the IPI does not indicate a strong recovery, the increase in December capacity utilization rate is a positive sign for industrial production. Consumer and investment goods imports continued to rise in November. The consumer confidence index showed strong recovery for the first time in the last four months. Real sector confidence index fell
2012 4th Quarter
Forecast Real GDP growth, %
(quarter on quarter, sa*) 1.2
Real GDP growth, %
(year on year, ca**) 3.0
Current account deficit
(% of GDP, annual) 6.4
2012 Annual Growth
Real GDP growth, % 2.7
Economic Outlook and Forecasts:
January 2013
slightly in December, but it increased on a quarterly basis. On the financial side, strong rally in the Istanbul Stock Exchange implies high growth for both the last quarter of 2012 and the first quarter of 2013. Interest rates for bank loans continue to decline (Figure 4). Rates for housing loans have fallen down to all time low levels of 2010. Rates for other loans are still slightly above 2010 levels. The fall in interest rates cause the speed of credit growth to increase for the first time this year (Table 3). Bank loans, which accelerated after the 2009 crisis, decelerated in 2011 and have slowed down since the last quarter of 2011. We observe that the speed of credit growth has turned positive in the last quarter of 2012, even though it remains to be small.
The revival in domestic demand in the last quarter boosts contribution of consumption and investment to growth, but reduces that of net exports since the exports are not enough to compensate for the increase in imports. The fall in exports in November is mainly caused by the decline in exports of gold to Iran. According to Betam’s calculations, exports excluding gold surged in the fourth quarter. However, the increase in imports which is fuelled by the revival in domestic demand might cause net exports to contribute negatively to growth. In line with Betam’s forecasts, the contribution of net exports to GDP growth was positive but very limited in the third quarter.1 We expect the contribution of
net exports to turn negative in the fourth quarter. This implies that domestic demand driven growth regime is making a comeback.
1 Betam’s “Growth Review: 3rd Quarter” Research Brief.
Even though the revival in domestic demand became clearer after November data release, we keep our 4th quarter growth forecasts same as
previous month. Betam’s quarter on quarter (QoQ) growth forecast for the fourth quarter of 2012 is 1.2 percent. The corresponding year of Year (YoY) growth rate is 3.0 percent and the annual GDP growth rate estimate for 2012 is 2.7 percent. We revised our current account deficit forecast from 6.3 percent to 6.4 percent due to increase in imports.
Outlook for economic growth
We expect the government expenditures, which contributed significantly to GDP growth in the third quarter, to continue to contribute positively to growth in the fourth quarter. On the other hand, the Central Bank of Turkey (CBRT) acted cautiously and did not reduce the lower bound of interest rate corridor in its December meeting. CBRT made a symbolic cut in the policy interest rate. Only in January has the Bank lowered both the upper and lower bounds of the interest rate corridor. The decline in the current account deficit from 10 percent to less than 7 percent in 2012 and the strong fiscal figures are increase investors risk appetite. Thus capital inflows accelerated again. In the coming periods, there may be needs some policy measures to prevent financial instability and increases in current account deficit.
Private consumption expenditures continue to rise
After the ongoing decline in the last three months, consumer confidence index increased by 3.8
percent in November. Production of nondurable and durable consumer goods increased by 0.6 percent and 6.1 percent, respectively, in November. Consumer goods imports have been increasing for the last three months. Overall, we expect the private consumption expenditures to increase in the last quarter of 2012 from the third quarter.
The contribution of investment is turning positive
After increasing continuously for three months, the real sector confidence index fell by 0.9 percent in December. However, it increased by 4.6 percent in the last quarter from the third quarter. Automobile production and investment goods imports continued to increase in November following increases in the last four months. They increased by 1.4 percent and 5.8 percent, respectively. In November, intermediate goods production and the IPI increased by 5.0 percent and 1.5 percent, respectively. In conclusion, signs of a revival in investment demand are becoming clear. We expect the private investment expenditures to contribute positively to GDP growth in the fourth quarter.
The contribution of net exports is negative
Figure 2 shows monthly changes of seasonally adjusted import and export volume indices. In November, export volume index decreased by 4.8 percent whereas import volume index increased by 4.9 percent. When we adjust the trade data for gold (i.e., excluding gold imports and exports), we see that the real exports and real imports increased by 5.4 percent and 4.5 percent, respectively. Although the increase in exports was slightly above imports, it is not enough to turn the contribution of net exports to growth to positive.
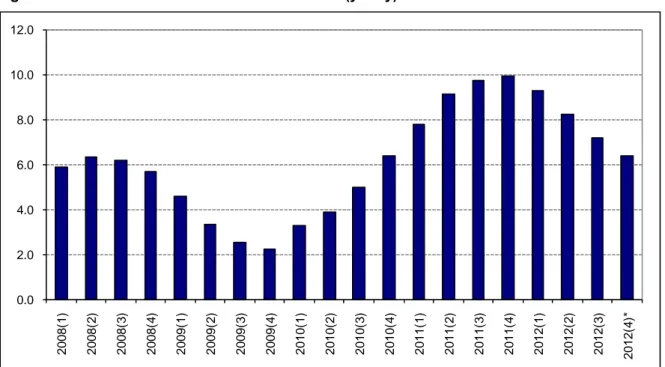
The current account deficit returns to pre-crisis levels
The 12-month CAD was $53.1 billion in October. In November it decreased to $51.8 billion due to a small fall in the trade deficit. We expect the 12-month current account deficit to the GDP ratio, which was 7.2 percent at the end of the third quarter, to fall down to 6.4 percent at the end of the fourth quarter.
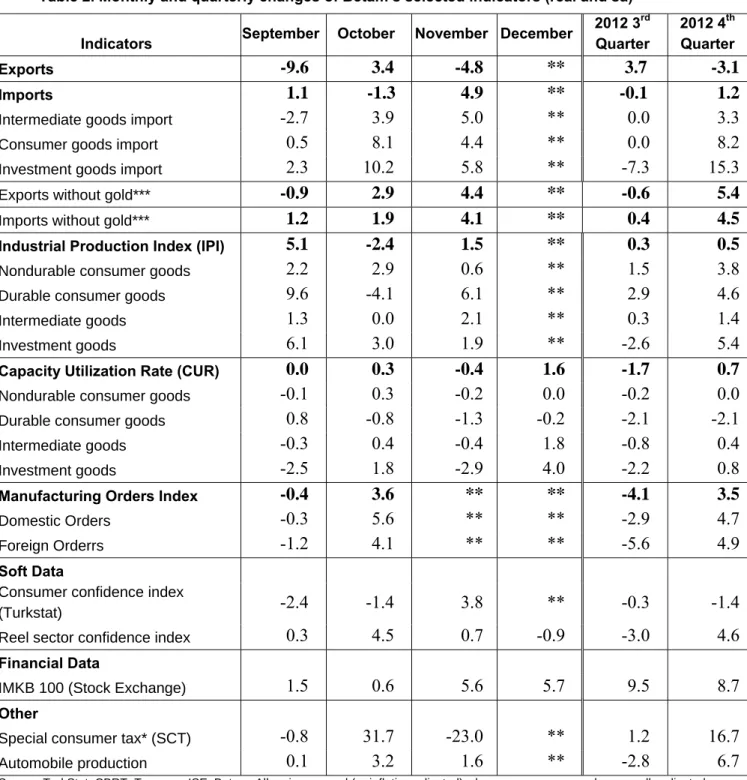
Table 2. Monthly and quarterly changes of Betam’s selected indicators (real and sa)
Indicators September October November December
2012 3rd Quarter 2012 4th Quarter Exports
-9.6 3.4
-4.8
**
3.7
-3.1
Imports1.1 -1.3
4.9
**
-0.1
1.2
Intermediate goods import
-2.7 3.9 5.0 ** 0.0 3.3
Consumer goods import
0.5 8.1 4.4 ** 0.0 8.2
Investment goods import
2.3 10.2 5.8 ** -7.3 15.3
Exports without gold***
-0.9 2.9 4.4 ** -0.6 5.4
Imports without gold***
1.2 1.9 4.1 ** 0.4 4.5
Industrial Production Index (IPI)
5.1 -2.4 1.5 ** 0.3 0.5
Nondurable consumer goods
2.2 2.9 0.6 ** 1.5 3.8
Durable consumer goods
9.6 -4.1 6.1 ** 2.9 4.6
Intermediate goods
1.3 0.0 2.1 ** 0.3 1.4
Investment goods
6.1 3.0 1.9 ** -2.6 5.4
Capacity Utilization Rate (CUR)
0.0 0.3 -0.4 1.6 -1.7 0.7
Nondurable consumer goods
-0.1 0.3 -0.2 0.0 -0.2 0.0
Durable consumer goods
0.8 -0.8 -1.3 -0.2 -2.1 -2.1
Intermediate goods
-0.3 0.4 -0.4 1.8 -0.8 0.4
Investment goods
-2.5 1.8 -2.9 4.0 -2.2 0.8
Manufacturing Orders Index
-0.4 3.6 ** ** -4.1 3.5
Domestic Orders
-0.3 5.6 ** ** -2.9 4.7
Foreign Orderrs
-1.2 4.1 ** ** -5.6 4.9
Soft Data
Consumer confidence index
(Turkstat)
-2.4 -1.4 3.8 ** -0.3 -1.4
Reel sector confidence index
0.3 4.5 0.7
-0.9 -3.0 4.6
Financial Data
IMKB 100 (Stock Exchange)
1.5 0.6 5.6 5.7 9.5 8.7
Other
Special consumer tax* (SCT)
-0.8 31.7 -23.0 ** 1.2 16.7
Automobile production
0.1 3.2 1.6 ** -2.8 6.7
Source: TurkStat, CBRT, Treasury, ISE, Betam. All series are real (or inflation adjusted) wherever necessary and seasonally adjusted. *This tax is collected on sales of goods such as gas, fuel oils, alcohol, tobacco products and automobiles.
**Data not yet released.
Figure 1: Capacity utilization rate and industrial production index (sa. left axis for CUR and right axis for IPI)
Source: TurkStat. Betam.
Figure 2: Volume indices of exports and imports (sa)
Source: TurkStat. Betam.
Figure 3: Ratio of current account deficit to GDP (yearly)
Source: CBRT. TurkStat. Betam.
95 100 105 110 115 120 125 130 135 60 65 70 75 80 85 Ja n -0 7 Ma y -0 7 Se p -0 7 Ja n -0 8 May -08 Se p -0 8 Ja n -0 9 Ma y -0 9 Se p -0 9 Ja n -1 0 May -10 Se p -1 0 Ja n -1 1 Ma y -1 1 Se p -1 1 Ja n -1 2 May -12 Se p -1 2 CUR IPI 120 140 160 180 200 220 240 Ja n -07 Ma y-07 Se p -0 7 Ja n -08 Ma y-08 Se p -0 8 Ja n -09 Ma y-09 Se p -0 9 Ja n -10 Ma y-10 Se p -1 0 Ja n -11 Ma y-11 Se p -1 1 Ja n -12 Ma y-12 Se p -1 2 Export Import 0.0 2.0 4.0 6.0 8.0 10.0 12.0 2 008( 1) 2 008( 2) 2 008( 3) 2 008( 4) 2 009( 1) 2 009( 2) 2 009( 3) 2 009( 4) 2 010( 1) 2 010( 2) 2 010( 3) 2 010( 4) 2 011( 1) 2 011( 2) 2 011( 3) 2 011( 4) 2 012( 1) 2 012( 2) 2 012( 3) 2012( 4) *
Figure 4: Weighted Average Interest Rates for Turkish Lira Banks' Loans (%)
Source: CBRT.
Tablo 3.
The change in the total credit growth
and GDP growth (Quarterly)The change in the
credit growth
Real GDP growth (YoY)
March 08
32.5
7.0
June 08
11.4
2.6
September 08
9.8
0.9
December 08
-15.7
-7.0
March 09
-38.4
-14.7
June 09
-38.5
-7.8
September 09
-68.0
-2.8
December 09
156.4
5.9
March 10
78.3
12.6
June 10
62.6
10.4
September 10
30.0
5.3
December 10
34.2
9.3
March 11
7.8
12.1
June 11
13.1
9.1
September 11
17.4
8.4
December 11
-18.1
5.0
March 12
-9.3
3.4
June 12
-10.2
3.0
September 12
-24.8
1.6
December 12
4.2
Source: CBRT, TurkStat, Betam. 5 7 9 11 13 15 17 19 21 Jan ‐10 Fe b ‐10 Ma r‐ 10 Ap r‐ 10 Ma y‐ 10 Ju n ‐10 Ju l‐ 10 Au g‐ 10 Se p ‐10 Oc t‐ 10 No v‐ 10 De c‐ 10 Jan ‐11 Fe b ‐11 Ma r‐ 11 Ap r‐ 11 Ma y‐ 11 Ju n ‐11 Ju l‐ 11 Au g‐ 11 Se p ‐11 Oc t‐ 11 No v‐ 11 De c‐ 11 Jan ‐12 Fe b ‐12 Ma r‐ 12 Ap r‐ 12 Ma y‐ 12 Ju n ‐12 Ju l‐ 12 Au g‐ 12 Se p ‐12 Oc t‐ 12 No v‐ 12 De c‐ 12 Cash Vehicle Housing Commercial
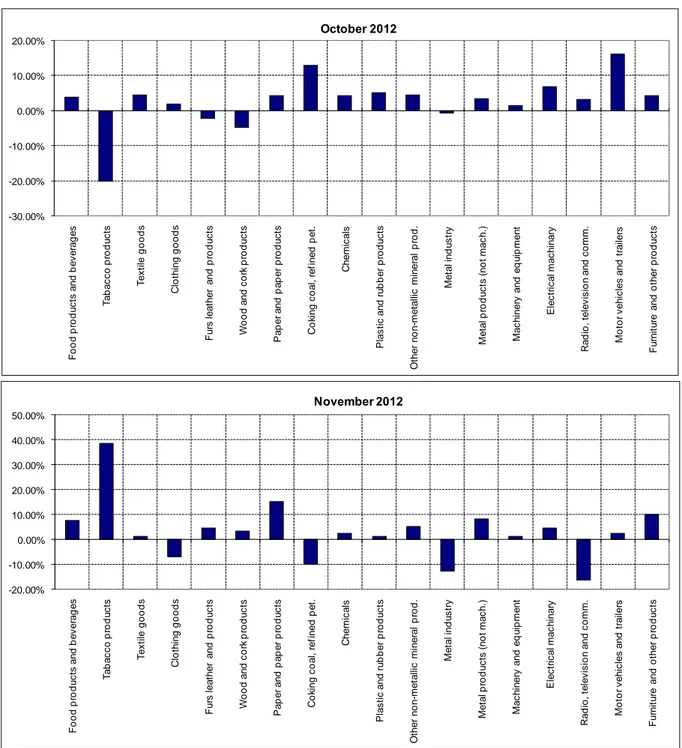
Figure 5: Monthly changes of manufacturing industry exports (sa)
Source: TurkStat. Betam.
-20.00% -10.00% 0.00% 10.00% 20.00% 30.00% 40.00% 50.00% F ood pr o d u c ts a n d b e v e ra g e s T a ba c c o p rod u c ts T e x ti le goo ds C lo th in g g oods F u rs leat her and p ro d uc ts W ood a n d c o rk pr odu c ts P a p e r a n d pa pe r p rod u c ts C o k ing c o al , r e fi ned p e t. C hem ic a ls P la s ti c a n d r u bbe r pr odu c ts O th e r n o n -me ta llic mi n e ra l p ro d . M e ta l in d u s tr y M e ta l pr odu c ts ( n ot m a c h .) M a c h in er y and eq ui p m e n t E le c tr ic al m a c h inar y R a di o, t e le v is ion a n d c o m m . M o to r v ehi c les an d t rai le rs F u rn it ur e and o ther p ro d u c ts November 2012 -30.00% -20.00% -10.00% 0.00% 10.00% 20.00% F o o d pr odu c ts a n d be v e ra ge s T a ba c c o pr od u c ts T e x ti le good s C lot h in g g oods F u rs leat her and p ro d uc ts W ood a n d c o rk pr odu c ts P a p e r a n d p a p e r pr od u c ts C o ki ng c o al , re fi ned p e t. C hem ic al s P las ti c an d r u b b er p ro d uc ts O ther no n-m e ta ll ic m iner al p ro d . Me ta l in d u s tr y M e ta l pr od u c ts ( n o t m a c h .) M a c h iner y an d eq ui p m ent E lec tr ic al m a c h in ar y R a di o , t e le v is ion a n d c o m m . M o to r v ehi c les and t rai le rs F u rn it u re and o ther p ro d uc ts October 2012