Issues
ISSN: 2146-4138
available at http: www.econjournals.com
International Journal of Economics and Financial Issues, 2018, 8(1), 21-29.
The Impact of Size and Growth Decisions on Turkish Banks’
Profitability
#1Ozcan Isik
1, S. Merve Kosaroglu
2*, Ayhan Demirci
31Department of Banking and Finance, Cumhuriyet University, Sivas, Turkey, 2Department of Banking and Finance, Cumhuriyet
University, Sivas, Turkey, 3Department of International Trade and Logistics, Toros University, Mersin, Turkey. *Email:
mervekosaroglu@gmail.com
ABSTRACT
The aim of this study is to examine whether bank profitability is affected by the decisions regarding bank size and growth rate. All parameter estimates of regression models are based on fixed-effect panel regression analyses. Our data covers all banks publicly traded on the BIST during the period 2009Q1–2016Q1. Our empirical findings show that there exists a nonlinear (concave) association between different size measures and profitability. In spite of the fact that growth rate tend to be positively associated with profitability, the impact of this variable is not statistically significant.
Keywords: Turkish Banking Sector, Bank Size, Growth Rate, Profitability JEL Classifications: C23, E44, G21
# This article is the revised and extended version of the paper presented in XVIII. International Symposium on Econometrics Operations Research and Statistics, in Trabzon/Turkey, on October 05-07, 2017.
1. INTRODUCTION
Banks, which form an important part of the financial sector in both bank-based and market-based financial systems, are financial institutions that act as fund transfer mechanism in transforming deposits collected into productive investments (Sufian and Habibullah, 2009; Kasman et al., 2010; Alp et al., 2010; Isik, 2017).Thus, their profitability performance is of great importance in terms of efficiency and stability of the financial system (Işık et al., 2017). Meeting the financial resource needs of real sector firms operating in manufacturing and services industries, banks have taken on pivotal responsibilities both in the industrialization of the countries and in the sustainable economic growth of the countries (Aladwan, 2015; Menicucci and Paolucci, 2016; Ucler and Dogan, 2017). Contributing significantly to the efficiency of the money and capital markets, a strong and lucrative banking system helps to make the economy more resistant to macroeconomic shocks (Athanasoglou et al., 2008; Yeboah et al., 2015; Menicucci and Paolucci, 2016). Nevertheless, the negative consequences of the financial
intermediation activities of the banking sector are also more likely to weaken the stability of the financial system, resulting in slow economic growth, high unemployment and inflation (INF) and bank-oriented financial crises. In recent years, the financial crises experienced both across Turkey and throughout the world have shown how important the banks and banking activities are in ensuring and maintaining the economic stability (Isik and Bolat, 2016).
Helping the efficient use of funds among the economic units in the financial system, banks take significant risks related to the intermediation activities and have to make the profit for their shareholders and other stakeholders. Profitability contributes to the success of a bank in a competitive environment. Furthermore, the presence and growth of a bank is often linked to its profitability. Therefore, the level of profitability which banks have achieved as a result of their activities is of great importance both in terms of micro and macro. In this context, this study analyzes whether the policies regarding size and growth of banks are associated with profitability of banks.
Empirical studies analyzing the linkages between bank size and growth rate and profitability in Turkish baking sector are relatively few in number. As far as we know, İskenderoğlu et al. (2012) is first to explore the associations between alternative size and growth variables and profitability of Turkish listed banks. When compared to their study, our study differs from theirs in terms of the econometric model used and the sample period. In other words, our study explores the impacts of size and growth decisions on banks’ profitability in more detail. First, variables regarding the size and growth rate are modelled separately in our profitability analysis. Second, because of the fact that the control variables used by the profitability model of İskenderoğlu et al. (2012) are limited, in the present study we utilize macro as well as bank specific determinants that are more likely to influence the profitability of banks. Therefore, our models are less likely to suffer from omitted variable bias. Third, In the Turkish context, our study is the first to analyze this issue over the post-crisis period 2009–2016.
Based on standard fixed-effect panel data regression analyses, the estimation results suggest that there exists a nonlinear (concave) association between all indicators representing bank size and banks’ profitability. Another important result of our study is that all indicators representing bank growth rate tend to be positively correlated with banks’ profitability but the coefficients of these indicators are not found to be statistically significant.
The paper is organized in the following manner. Section 2 overviews the review of related studies. In Section 3 we describe the variables, our data, and the empirical model we employ. Section 4 describes the empirical results and finally we present our conclusions in section 5.
2. LITERATURE REVIEW
The determinants of the profitability of 17 commercial banks operating in Greece during 1989-2000 are analyzed by Mamatzakis and Remoundos (2003). Based on panel data regression analysis, both the bank size (i.e., the natural logarithm of the total assets) and its squared value are found to be statistically significant for the models where return on assets (ROA) and return on equity (ROE) are dependent variables. These findings reveal the existence of an inverted U-shaped association between size and profitability. In their study aiming to investigate the factor affecting the profitability the profitability of 584 commercial banks operating in 15 European Union countries between the years from 1995 to 2001, Pasiouras and Kosmidou (2007) employed the fixed effects panel data methodology. Results of their empirical investigation show that the effect of the bank size, represented by the log of total assets, on the return on average total assets of the bank (ROAA) is negative and significant. Besides, when the authors split the sample into two groups considering the ownership structures of the banks, similar findings are obtained for both domestic and foreign banks. In another study on Greek banks, Athanasoglou et al. (2008) tried to determine variables that affect bank profitability (ROA) by using panel data of commercial banks during 1985–2001. The
results of dynamic panel data analysis indicate that neither bank size nor its square has any statistically significant impact on the bank profitability.
Chiorazzo et al. (2008), using panel data from 85 banks operating in the Italian banking sector during the period 1993–2003, investigate empirically the factors affecting the risk-adjusted returns (SHROE and SHROA). The results of fixed effects panel data models indicate that there is an inverse-U shaped linkage between bank size measured in terms of total assets and risk-adjusted bank returns. In addition, it is determined that there is no statistically significant relation between the growth rate of bank assets and the risk-adjusted returns.
Dietrich and Wanzenried (2011) analyzed empirically the determinants of bank profitability (ROAA, ROAE, and NIM) by using panel data of 372 deposit banks in Switzerland over the period 1999–2009. In their study, the authors split up banks sample into two periods i.e., 1999–2006 (pre-crisis period) and 2007–2009 (crisis period) in order to examine the effect of the recent financial crisis. According to the estimation results obtained from the dynamic panel data estimators, the annual deposit growth rate negatively and significantly affects ROAA both in the pre-crisis period and in the pre-crisis period. In models where ROAE is used as a measure of profitability, the annual deposit growth rate significantly affects ROAE neither in the pre-crisis period nor in the crisis period. Lastly, in the equations where the net interest margin (NIM) is used as the profitability indicator, the annual deposit growth rate negatively and significantly influence the NIM in the crisis period, but no significant relation is found between the two variables in the pre-crisis period.
İskenderoğlu et al. (2012), using quarterly data for the period of 2004-2009 belonging to 13 commercial banks registered in Borsa Istanbul (BIST), explore the impact of bank scale and growth on bank performance measured by ROA and ROE. In their study, they use the log of total assets and the log of equity capital to represent size variables. Besides, the growth rates of total assets and equity capital are employed to measure growth variables. Findings from dynamic panel data estimators show that bank performance indicators measured by ROA and ROE are positively and significantly influenced by bank size indicators. When the results are analyzed in terms of the variables representing the growth rate, the authors report that the effect of growth rate on performance is positive. This positive impact is only significant for ROE models.
Factors influencing the profitability of 89 banks in Spain during 1999–2009 period are analyzed by Trujillo-Ponce (2013). Findings from both ROA and ROE models show a positive but insignificant linkage between deposit growth rate and profitability variables. Besides, the impact of size of the bank measured by the natural log of total bank assets on the profitability indicators is negative but statistically insignificant. In addition, the author investigates whether there is nonlinearity in the bank size-profitability association. The results from nonlinear models demonstrate that there is no nonlinear association between size and profitability measures.
The associations between bank scale and growth and profitability of deposit banks from 148 countries with and without OECD membership during 1998–2010 period are explored by Shehzad et al. (2013). Dynamic panel data estimation results for 10.194 banks operating in OECD countries show that bank profitability is positively and significantly influenced by lagged bank size and lagged asset growth. Besides, findings of the study for 1.586 banks from non-OECD countries indicate that neither lagged bank size nor lagged asset growth rate significantly influences the profitability of banks.
Gürbüz et al. (2013), examining the factors that influence the risk-adjusted returns of the 26 commercial banks operating in Turkey banking sector between the years 2005 and 2011, report that there is a positive and statistically significant link between risk-adjusted returns with regard to ROA and ROE and the natural log of the asset total. In addition to this result, the authors also find that the growth rate calculated in terms of total assets is positively and significantly associated with risk-adjusted ROE but negatively and insignificantly related to risk-adjusted ROA.
The factors that influence the performance of banks operating in the Korean, Chinese and Japanese banking sectors over the period from 2003 to 2010 are analyzed by Lee and Kim (2013). The findings demonstrate that: (i) In the sample of 17 Korean banks, an inverted U-shaped relationship is found between bank size and ROA. However, no significant association is found between the two variables in the ROE model; (ii) when the relationship between bank size and bank profitability is analyzed for the Chinese banking sector (125 banks), it appears that the link between two variables in both ROA and ROE models has an inverted U shape; (iii) in the Japanese bank analysis, neither ROA nor ROE equations demonstrate a significant relationship between bank size and profitability measures.
Dietrich and Wanzenried (2014) examined the factors affecting the profitability of 10.165 deposit banks from 118 different countries with low, medium and high income levels in the period covering 1998–2012. According to the results from the dynamic panel data analysis technique, bank profitability (ROAA, ROAE and NIM) variables appear to be positively and statistically significantly related to deposit growth rate variable.
Turgutlu (2014), employing the panel data set of 30 deposit banks for the period of 2006Q4–2012Q2, investigates the factors affecting the performance of the banks operating in the Turkish banking sector. System generalized method of moments results show that while the logarithm of the total assets affects the ROE positively and significantly, the logarithm of total loans is negatively and significantly related to ROE.
Titko et al. (2015) investigated the determinants of the profitability of banks operating in Latvia and Lithuania. In their study covering the 7 years 2008–2014, while bank performance is measured by profitability ratios such as ROA, ROE, NIM and non-interest income (NII), bank size is represented by the natural log of total assets, the natural logarithm of loans, the natural logarithm of deposits, the number of private customers and the number of
legal customers. Multiple regression analysis results imply that there is no statistically significant relationship between bank size indicators and profitability.
Chronopoulos et al. (2015) investigated the performance of 17.588 US banks during the period of 1984–2010. The findings from dynamic panel data estimation procedure clearly imply that the impact of bank size on bank performance is non-linear. More clearly, an increase in total assets of banks causes ROA first to increase, and then to decrease. In the research when commercial bank sample is divided into three groups as small, medium and large-sized banks in terms of asset size. Findings from all three bank samples show that there is a positive and significant linkage between asset growth and ROA. The nonlinear association between bank size and bank performance is also confirmed with all three bank samples.
Based on a sample of 20 commercial banks operating in Sudi Arabia during 2000–2014, Saif-Alyousf et al. (2017) examined the factors that influence bank profitability (ROE, ROE and NIM) by employing classical panel data regression analysis. In their study bank sample is divided into domestic and foreign banks. The findings imply that the impact of log of total assets on bank profitability indicators for both of groups is negative and significant. Ahamed (2017) examined empirically the determinants of performance of 107 commercial banks (ROA and risk-adjusted ROA) in the Indian banking industry by using annual data for the period of 1998-2014. The empirical results from static and dynamic panel data estimation methods indicate that performance indicators are positively and significantly affected by bank size (log of total assets). Nevertheless, there is no significant linkage between asset growth rate and performance indicators. When the bank sample is divided into three groups (state, private, and foreign) according to their ownership structure, the author finds that bank size positively and significantly influences private and foreign banks’ risk-adjusted ROA. The effect of the asset growth rate on the performance measures is not important for each of bank groups.
In their study of Turkish banks, Işık et al. (2017) explored the performance of 20 deposit banks during the period between 2006 and 2014. Based on static panel data estimation results, it seems that there is a U-shaped curvilinear linkage between bank size represented by log of total bank assets and ROAA.
3. DATA AND METHODOLOGY
3.1. Data
This study aims at examining the impacts of size and growth indicators, which are determined according to alternative measures, on bank profitability. For this purpose, the analysis utilizes an unbalanced panel dataset of thirteen banks1 publicly
1 Akbank T.A.Ş., Alternatif Bank A.Ş., Denizbank A.Ş., Finansbank A.Ş., Fortisbank A.Ş., Şekerbank T.A.Ş., ICBC Turkey Bank A.Ş., Türk Ekonomi Bankası A.Ş., Türkiye Garanti Bankası A.Ş., Türkiye İş Bankası A.Ş., Yapı ve Kredi Bankası A.Ş., Türkiye Halk Bankası A.Ş., Türkiye Vakıflar Bankası T.A.O.
traded in BIST over the period from 2009Q1 to 2016Q1 period consisting of 354 observations. Bank-level data included in the sample are provided from the Finnet database, whereas data on macroeconomic indicators are obtained from the Central Bank of the Republic of Turkey.
3.2. Econometric Methodology
In general terms, the following empirical specification is to be estimated to test the effects of size and growth rate variables on the profitability of Turkish listed banks:
2
it 0 1 it 2 it 3 it
4 it t i it
ROAA SIZE SIZE GROWTH
CONTROL
β β β β
β λ µ ε
= + + +
+ + + + (1)
In this equation i and t indicate an individual bank and time period, respectively; ROAAit, measured by the return on average assets, is independent variable of the model; β0 is the constant term; SIZEit and represent bank size and 2
it
SIZE the square of bank size, respectively. Bank size is measured with the three alternative variables (SIZE1, SIZE2, and SIZE3); GROWTHit represents one of the variables representing bank growth rates (AssetGrowth, LoanGrowth, and DepositGrowth). CONTROLit refers to the bank-specific financial variables and macro variables. While λt represents time-specific effects, µi represents the unobservable heterogeneity or bank’s unobservable individual effects, ϵit is the classical error term assumed to be unrelated to all other variables specified in the profitability equation. Finally, the coefficients to be estimated are β0, β1, β2, β3 and β4, respectively.
The coefficients of the size and growth rate variables used in the bank profitability equations are expected to take the following signs: The bank size variable is generally used to investigate the impact of potential scale economies in the banking sector. Since the theory of microeconomics links large-scale operations with low costs, the sign of the coefficient of this variable could be expected to be positive (Brighi and Venturelli, 2014; Chiorazzo et al., 2008; Chronopoulos et al., 2015). However, larger and more diversified banks are also likely to face scale inefficiencies, perhaps because of bureaucratic processes, high agency and operating costs. This leads us to predict a negative relationship between bank size and profitability (Jensen, 1986, Goddard et al., 2004; Athanasoglou et al., 2008; Barros et al., 2007; Isik, 2017). Therefore, a positive or negative relationship can be expected between the bank size indicators and profitability indicator in Eq. (1). A quadratic term of bank size is also used for testing the existence of a possible nonlinear relation between size and profitability measures i.e., we expect a concave relation to exist. The growth rate variables used in the regression models represent the risk taking behaviors of the bank managers regarding their investment decisions (Chiorazzo et al., 2008). Theoretically, an increase in activity volumes of banks having higher growth rate leads to higher profits compared to those with lower growing rate. However, the increased levels of risk associated with the activities of the banks might negatively affect profitability rate of banks. In addition, high growth rates in the market are likely to attract extra competitors (Dietrich ve Wanzenried, 2014; Chronopoulos et al., 2015). In the banking sector, one of the sectors where asymmetric
information problems are experienced at a high level, a bank with higher growth rate is able to expand its business by taking higher credit and liquidity risk, which may lead to a decrease in profitability.
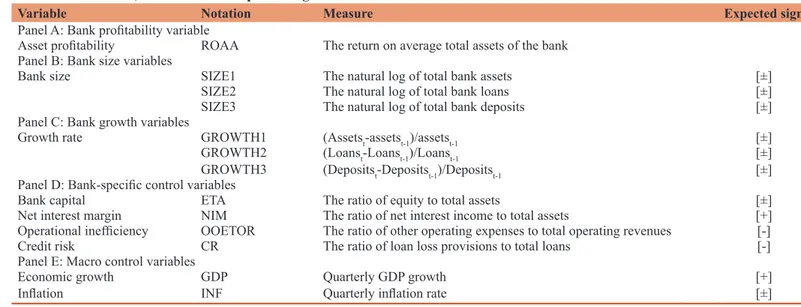
Following İskenderoğlu et al. (2012), Shehzad et al. (2013), Karakaya and Bünyamin (2013); Dietrich and Wanzenried (2014), Turgutlu (2014), Titko et al. (2015), Chronopoulos et al. (2015), Samad (2015), Adusei (2015), Aydemir and Guloglu (2017) and Işık and Belke (2017) among others, both bank size and growth rate are measured with three alternative indicators. As in most studies of banking (i.e., Mamatzakis and Remoundos, 2003; Athanasoglou et al., 2008; Lee and Kim, 2013; Shehzad et al., 2013; Dietrich and Wanzenried, 2014; Chronopoulos et al., 2015; Isik, 2017), a numbers of bank-specific and macro control determinants are added to our regression models. The definitions, notations and expected signs of all independent variables employed in bank profitability model are given in Table 1.
4. FINDINGS AND DISCUSSIONS
4.1. Summary Statistics
The summary statistics of the data used for the analysis are presented in Table 2. It is seen that the mean ROAA used as a measure of profitability in the analysis is about 1%. The largest value of this variable is about 3% and its smallest value is about −1%. The fact that the mean of ROAA is larger than its standard deviation indicates that the variability of the ROAA series is not high. When the descriptive statistics of the variables used for representing the bank size are examined, it is seen that the means of these variables are larger than their standard deviations. These results suggest that volatility for these variables is not particularly high. When the findings are evaluated in terms of bank growth rates, the standard deviations for the related series are larger than their average values. Therefore we can conclude that the variables representing growth rate are considerably volatile.
4.2. Correlation Matrix
Table 3 displays the results of the correlation analysis. As seen in Table 3, we find that bank size variables are significantly and positively correlated with profitability. However, the correlations between bank profitability and growth rate indicators are statistically insignificant. It is also observed that the variables representing bank size are highly correlated with each other. Likewise, the same holds true for the variables representing growth rate. Note that bank size variables as well as growth rate variables will enter the regression model separately because of possible collinearity problems between variables. When we take into account the correlation coefficients for bank specific and macro control variables, we can say that multicollinearity problems are not severe, suggesting that our regression models are valid and reliable.
4.3. Regression Results
Before reporting our results, we perform Hausman test to decide which panel data estimator is more appropriate to estimate our
regression models. According to the result of Hausman test, we reject the null hypothesis (H0:E(Xit,µi)=0) and decide there is an evidence of correlation between banks’ individual effects and the explanatory variables, which means that the fixed-effects panel data estimator is more appropriate for the analysis. Afterwards, we carry out diagnostic tests to check whether there exist autocorrelation and heteroskedasticity in the models. The result of the Wooldridge test implies that we reject the null hypothesis of no first-order autocorrelation. According to the modified Wald test, the null hypothesis stated that there is no heteroscedasticity in the panel data is rejected. Thus, the standard errors that are robust to autocorrelation and heteroskedasticity are obtained from the Driscoll and Kraay (1998) estimator (Hoechle, 2007) and reported in the Tables 4-6.
Profitability model in Eq. (1) is then estimated separately taking into account both bank size measures and growth rate indicators. The estimation results for Turkish banks whose shares are traded on BIST during 2009Q1–2016Q1 period are presented in Tables 4-6, respectively.
In Table 4, various specifications of Eq. (1) employing SIZE1 (as measured by the log of total assets) suggest that SIZE1 is related
positively and significantly to profitability of banks, whereas the coefficient estimate for SIZE12 is negative and significant.
Statistically significant negative coefficients on SIZE12 imply that
this relation is nonlinear. Therefore, when the size of bank exceeds a certain threshold, size is negatively associated with the profitability of banks. The estimate of the threshold value ranges across different regression specifications shown in Table 4, averaging at approximately 403 billion TL (De Haan and Poghosyan, 2012)2.
We run again the regressions by replacing SIZE1 with SIZE2 to check the robustness of our findings. As reported in Columns 1, 2 and 3 of Table 5, we achieve similar results. The nonlinear linkage between bank size (as measured by the log of total loans) and profitability is confirmed with another proxy for bank size. The inflection point in terms of total loans ranges across different models in Table 5, averaging at about 305 billion TL.
2 Following De Haan and Poghosyan (2012) and Moutsianas and Kosmidou (2016), the threshold value at which the associations sign change is estimated by taking the first derivative of Eq. (1) in terms of the log of total bank assets and equalizing it to zero. The optimal size of total bank assets can be calculated as exp=(-0.5* β1/β2), where β1 and β2 are the coefficients
of log of total bank assets and its squared value, respectively (De Haan and Poghosyan, 2012; Moutsianas and Kosmidou, 2016).
Table 1: Measures, notations and expected signs of variables on ROAA
Variable Notation Measure Expected sign
Panel A: Bank profitability variable
Asset profitability ROAA The return on average total assets of the bank Panel B: Bank size variables
Bank size SIZE1 The natural log of total bank assets [±]
SIZE2 The natural log of total bank loans [±]
SIZE3 The natural log of total bank deposits [±] Panel C: Bank growth variables
Growth rate GROWTH1 (Assetst-assetst-1)/assetst-1 [±]
GROWTH2 (Loanst-Loanst-1)/Loanst-1 [±]
GROWTH3 (Depositst-Depositst-1)/Depositst-1 [±] Panel D: Bank-specific control variables
Bank capital ETA The ratio of equity to total assets [±]
Net interest margin NIM The ratio of net interest income to total assets [+] Operational inefficiency OOETOR The ratio of other operating expenses to total operating revenues [-] Credit risk CR The ratio of loan loss provisions to total loans [-] Panel E: Macro control variables
Economic growth GDP Quarterly GDP growth [+]
Inflation INF Quarterly inflation rate [±]
Table 2: Summary statistics
Variable n Mean Median SD Minimum Maximum
ROAA 354 0.0097756 0.0081948 0.0064063 −0.00689 0.0294236 SIZE1 354 10.66705 10.8451 0.5716433 9.30103 11.44716 SIZE2 354 10.46354 10.61802 0.5524535 9.113943 11.25527 SIZE3 354 10.44965 10.63347 0.5702557 9.079182 11.20412 GROWTH1 354 0.0431406 0.0422703 0.0623743 −0.2025159 0.6491444 GROWTH3 354 0.0495104 0.0487631 0.0606243 −0.1244055 0.7787568 GROWTH3 354 0.0399166 0.0421103 0.0631617 −0.1729828 0.4410695 ETA 354 0.1178009 0.1146871 0.0263422 0.0573028 0.2423125 NIM 354 0.0263393 0.0247476 0.0140083 0.007073 0.0798233 OOETOR 354 0.4838193 0.4638789 0.1200376 0.2799271 1.034454 CR 354 0.0312612 0.0286592 0.0135173 0.0113779 0.0768683 GDP 354 0.0382712 0.043 0.0551681 −0.147 0.126 INF 354 0.0774853 0.0789 0.0150226 0.0399 0.1045 SD: Standard deviation
In a third robustness check in Table 6, Eq. (1) is re-estimated by SIZE3 in place of SIZE1. The results obtained from Table 6 are similar to those of Tables 4 and 5. Significant results regarding bank size variables again confirm that the relation is non-linear. The inflection point with regards to total deposits ranges across different regression models reported in Table 6, averaging at approximately 330 billion TL. Thus, our results signify that as size of bank increases, bank profitability first increases and then decreases. These findings from Tables 4-6 allow us to conclude that there is enough statistical evidence
to support a non-linear linkage between bank size indicators and profitability.
Our findings suggesting the presence of a nonlinear relationship (i.e., an inverse-U-shaped relationship) between bank size and profitability agree with the findings obtained by Mamatzakis and Remoundos (2003) for Greece, Chiorazzo et al. (2008) for Italy, Lee and Kim (2013) for Korea and China, Chronopoulos et al. (2015) for the US and Işık et al. (2017) for Turkey but contrast with those reported by Lee and Kim (2013) for Japan,
Table 3: Correlation matrix
1 2 3 4 5 6 7 8 9 10 11 12 13 (1) 1 (2) 0.29 (0.00) 1 (3) 0.26 (0.00) (0.00)0.99 1 (4) 0.31 (0.00) (0.00)0.99 (0.00)0.99 1 (5) −0.02 (0.72) (0.43)0.04 (0.42)0.04 (0.52)0.03 1 (6) −0.020 (0.71) (0.77)0.016 (0.67)0.023 (0.81)0.013 (0.00)0.82 1 (7) 0.09 (0.10) (0.33)0.052 (0.30)0.055 (0.28)0.058 (0.00)0.66 (0.00)0.62 1 (8) 0.05 (0.34) −0.35(0.00) (0.00)−0.37 (0.00)−0.34 (0.00)−0.20 (0.02)−0.12 (0.01)−0.13 1 (9) 0.63 (0.00) −0.25(0.00) (0.00)−0.25 (0.00)−0.24 (0.36)−0.05 (0.44)−0.04 (0.04)0.11 (0.01)0.15 1 (10) −0.51 (0.00) (0.00)−0.53 (0.00)−0.50 (0.00)−0.55 (0.00)0.16 (0.03)0.12 (0.21)0.07 (0.00)0.16 (0.42)0.04 1 (11) 0.12 (0.02) (0.000)−0.28 (0.00)−0.30 (0.00)−0.26 (0.31)−0.05 (0.12)−0.08 (0.17)−0.07 (0.00)0.22 (0.00)0.31 (0.99)0.01 1 (12) −0.02 (0.78) (0.38)0.05 (0.27)0.06 (0.40)0.05 (0.00)0.27 (0.00)0.39 (0.00)0.23 −0.02(0.98) −0.07(0.22) (0.00)0.16 (0.31)−0.05 1 (13) −0.16 (0.00) (0.14)0.08 (0.08)0.09 (0.16)0.07 (0.00)−0.24 (0.00)−0.19 (0.00)−0.21 −0.10(0.06) −0.16(0.00) (0.31)0.05 (0.02)−0.12 (0.66)0.02 1 (1) ROAA, (2) SIZE1, (3) SIZE2, (4) SIZE3, (5) GROWTH1, (6) GROWTH2, (7) GROWTH3, (8) ETA, (9) NIM, (10) OOETOR, (11) CR, (12) GDP, (13) INF, respectively. Probability values are shown in brackets below the coefficients
Table 4: Estimation results with bank size represented by log of total bank assets Independent
variables 1 Independent variable: ROAA2 3
Constant −0.5906*** (0.0542) −0.6018*** (0.0561) −0.6025*** (0.0546) SIZE1 0.1157*** (0.0109) 0.1170*** (0.0112) 0.1172*** (0.0109) SIZE12 −0.0055*** (0.0005) −0.0055*** (0.0005) −0.0055*** (0.0005) GROWTH1 0.0048* (0.0023) GROWTH2 0.0005 (0.0033) GROWTH3 0.0007 (0.0039) ETA 0.0687*** (0.0093) 0.0668*** (0.0098) 0.0670*** (0.0100) NIM 0.0898*** (0.0221) 0.0854*** (0.0209) 0.0843*** (0.0203) OOETOR −0.0299*** (0.0026) −0.0295*** (0.0025) −0.0295*** (0.0025) CR −0.0198* (0.0111) −0.0193 (0.0110) −0.0191* (0.0103) GDP 0.0038 (0.0024) 0.0049* (0.0026) 0049* (0.0026) INF −0.0182 (0.0144) −0.0238 (0.0141) −0.0236 (0.0147) Hausman test 37.32*** 45.50*** 34.82*** Wooldridge test 34.563*** 30.757*** 30.929***
Modified Wald test 101.91*** 88.31*** 93.06***
F-test 1285.50*** 1220.10*** 1328.21***
R2 0.8140 0.8124 0.8124
SIZE1 represents the logarithm of total assets. All variables are as defined in Table 1. Estimations are performed through the pooled OLS estimators. Quarter dummy variables are included in the models, but their coefficient estimates are not reported. ***P<0.01, **P<0.05 ve P<0.1
Trujillo-Ponce (2013) for Spain, and Athanasoglou et al. (2008) for Greece.
The regression analysis also reveals that growth rate in terms of log of total bank assets (GROWTH1) is found to be positive and significant impact on profitability of banks at the 10% level of significance in column 1 of Tables 4-6. However, in Columns 2 and 3 of Tables 4-6, GROWTH2 and GROWTH3 are found to be positive but insignificant effects on profitability of banks. The results in terms of growth rate are similar to the results of Chiorazzo et al. (2008) for Italy, İskenderoğlu et al. (2012) for Turkey, Trujillo-Ponce (2013) for Spain, Ahamed (2017) for India. However, our results are different from those of Dietrich and Wanzenried (2011) for Switzerland, Gürbüz et al. (2013) for Turkey, Shehzad et al. (2013) for OECD countries, and Chronopoulos et al. (2015) for the US.
Given all specifications, the impact of bank capital (ETA) on bank profitability is statistically highly significant and positive, suggesting that banks having higher capital ratio tend to be more profitable than those with a lower capital ratio. The results show that NIM is significantly and positively related to bank profitability which means that a higher NIM contributes to bank profitability. In contrast, operational inefficiency (OOETOR) measured by the ratio of other operating expenses to total operating revenues has a negative and statistically significant influence on bank profitability. This suggests that an increase in this ratio leads to a decrease in bank profitability. Similar to OOETOR, credit risk (CR), as measured by the ratio of loan loss provisions to total loans, has a significant and negative relationship with bank profitability, showing that higher CR leads to lower profitability. According to the results of this study, macroeconomic factors such as economic growth (GDP) and INF rate are statistically insignificant. This
Table 5: Estimation results with bank size represented by log of total bank loans Independent
variables 1 Independent variable: ROAA2 3
Constant −0.5919*** (0.0564) −0.5996*** (0.0575) −0.6000*** (0.0565) SIZE2 0.1180*** (0.0114) 0.1196*** (0.0117) 0.1197*** (0.0115) SIZE22 −0.0057*** (0.0006) −0.0058*** (0.0006) −0.0058*** (0.0006) GROWTH1 0.0045* (0.0024) GROWTH2 0.0003 (0.0034) GROWTH3 0.0005 (0.0040) ETA 0.0654*** (0.0090) 0.0636*** (0.0093) 0.0637*** (0.0095) NIM 0.0977*** (0.0220) 0.0933*** (0.0208) 0.0926*** (0.0209) OOETOR −0.0291*** (0.0023) −0.0288*** (0.0022) −0.0288*** (0.0022) CR −0.0217** (0.0098) −0.0214** (0.0097) −0.0212** (0.0091) GDP 0.0031 (0.0022) 0.0041 (0.0025) 0.0041 (0.0025) INF −0.0181 (0.0144) −0.0235 (0.0139) −0.0232 (0.0145) Hausman test 38.75*** 55.86*** 38.87*** Wooldridge test 38.681*** 29.566*** 32.583***
Modified Wald test 102.13*** 89.37*** 92.66***
F-test 1089.61*** 898.15*** 1124.17***
R2 0.8151 0.8137 0.8137
SIZE2 represents the logarithm of total loans. All variables are as defined in Table 1. Estimations are performed through the pooled OLS estimators. Quarter dummy variables are included in the models, but their coefficient estimates are not reported. ***P<0.01, **P<0.05 ve P<0.1
Table 6: Estimation results with bank size represented by log of total bank deposits Independent
variables 1 Independent variable: ROAA2 3
Constant −0.5390*** (0.0722) −0.5450*** (0.0752) −0.5415*** (0.0730) SIZE3 0.1072*** (0.0145) 0.1085*** (0.0151) 0.1088*** (0.0147) SIZE32 −0.0052*** (0.0007) −0.0052*** (0.0007) −0.0052*** (0.0007) GROWTH1 0.0049* (0.0025) GROWTH2 0.0007 (0.0036) GROWTH3 0.0001 (0.0039) ETA 0.0616*** (0.0082) 0.0596*** (0.0085) 0.0595*** (0.0085) NIM 0.0947*** (0.0208) 0.0902*** (0.0194) 0.0897*** (0.0173) OOETOR −0.0293*** (0.0025) −0.0289*** (0.0025) −0.0289*** (0.0025) CR −0.0150 (0.0113) −0.0144 (0.0112) −0.0146 (0.0105) GDP 0.0038 (0.0028) 0.0048 (0.0031) 0.0051 (0.0031) INF −0.0179 (0.0148) −0.0234 (0.0145) −0.0240 (0.0151) Hausman test 46.20*** 50.13*** 43.60*** Wooldridge test 40.758*** 31.715*** 37.962***
Modified Wald test 106.24*** 93.07*** 98.21***
F-test 879.00*** 857.84*** 903.30***
R2 0.8083 0.8066 0.8065
SIZE3 represents the logarithm of total deposits. All variables are as defined in Table 1. Estimations are performed through the pooled OLS estimators. Quarter dummy variables are included in the models, but their coefficient estimates are not reported. ***P<0.01, **P<0.05 ve P<0.1
implies that these variables do not explain a substantial part of the variation of the profitability of banks during the period under consideration.
5. CONCLUSION
Meeting the resource needs of real sector firms, banks fulfill an important economic function. As in other bank-based economies, banks playing a vital role in the process of financial intermediation are the most significant part of the Turkish financial system. The profitability level of banks in Turkey is of great importance not only for bank shareholders and other stakeholders but also for the stability of Turkish financial system and economic growth. In this paper, we examine the impacts of size and growth decisions on bank profitability for a sample of listed commercial banks in Turkish banking industry over the period from 2009Q1 to 2016Q1. Given the estimation results obtained from panel data regressions, it can be concluded that bank size variables are significant in explaining changes in profitability. More specifically, there exists a nonlinear (concave) association between bank size measures and bank profitability. This result show that as size of banks increases, profitability first increases, and then decreases. Our results robust to alternative definitions of bank size do not support the economies of scale hypothesis in Turkish banking industry. In addition, the results also indicate that growth rate variables show no impact on profitability.
With respect to the control variables, bank capital and NIM are positively and significantly related to bank profitability. However, CR and operational inefficiency are negatively and significantly associated with profitability of bank. In this study macro factors such as GDP growth and inflation rate are not found to be significant in explaining the variations of profitability of banks. The findings of these studies can only be interpreted with regards to listed commercial banks. Future research could focus on participation and investment banks as well as commercial banks. It could be fruitful to use alternative profitability measures (i.e., ROE and NIM) to better understand how profitability indicators are affected by size and growth decisions of bank management.
REFERENCES
Adusei, M. (2015), The impact of bank size and funding risk on bank stability. Cogent Economics and Finance, 3(1), 1-19.
Ahamed, M.M. (2017), Asset quality, non-interest income, and bank profitability: Evidence from Indian banks. Economic Modelling, 63, 1-14.
Aladwan, M.S. (2015), The impact of bank size on profitability an empirical study on listed Jordanian commercial banks. European Scientific Journal, 11(34), 217-236.
Alp, A., Ban, Ü., Demirgüneş, K., Kılıç, S. (2010), Türk bankacilik sektöründe karliliğin içsel belirleyicileri/internal determinants of profitability in Turkish banking sector. İMKB Dergisi, 12(46), 1-15. Athanasoglou, P.P., Brissimis, S.N., Delis, M.D. (2008), Bank-specific,
industry-specific and macroeconomic determinants of bank profitability. Journal of International Financial Markets, Institutions and Money, 18(2), 121-136.
Aydemir, R., Guloglu, B. (2017), How do banks determine their spreads under credit and liquidity risks during business cycles? Journal of International Financial Markets, Institutions and Money, 46, 147-157. Barros, C.P., Ferreira, C., Williams, J. (2007), Analysing the determinants
of performance of best and worst European banks: A mixed logit approach. Journal of Banking and Finance, 31(7), 2189-2203. Brighi, P., Venturelli, V. (2014), How do income diversification, firm size
and capital ratio affect performance? Evidence for bank holding companies. Applied Financial Economics, 24(21), 1375-1392. Chiorazzo, V., Milani, C., Salvini, F. (2008), Income diversification and
bank performance: Evidence from Italian banks. Journal of Financial Services Research, 33(3), 181-203.
Chronopoulos, D.K., Liu, H., McMillan, F.J., Wilson, J.O. (2015), The dynamics of US bank profitability. The European Journal of Finance, 21(5), 426-443.
De Haan, J., Poghosyan, T. (2012), Size and earnings volatility of US bank holding companies. Journal of Banking and Finance, 36(11), 3008-3016.
Dietrich, A., Wanzenried, G. (2011), Determinants of bank profitability before and during the crisis: Evidence from Switzerland. Journal of International Financial Markets, Institutions and Money, 21(3), 307-327.
Dietrich, A., Wanzenried, G. (2014), The determinants of commercial banking profitability in low-, middle-, and high-income countries. The Quarterly Review of Economics and Finance, 54(3), 337-354. Driscoll, J., Kraay, A.C. (1998), Consistent covariance matrix estimation
with spatially dependent data. Review of Economics and Statistics, 80(4), 549-560.
Goddard, J., Molyneux, P., Wilson, J.O. (2004), The profitability of European banks: A cross‐sectional and dynamic panel analysis. The Manchester School, 72(3), 363-381.
Gürbüz, A.O., Yanık, S., Aytürk, Y. (2013), Income diversification and bank performance: Evidence from Turkish banking sector. BDDK Bankacılık ve Finansal Piyasalar, 7(1), 9-29.
Hoechle, D. (2007), Robust standard errors for panel regressions with cross-sectional dependence. Stata Journal, 7(3), 281-312.
Isik, O. (2017), Internal determinants of profitability of state, private and foreign owned commercial banks operating in Turkey. Journal of Economics, Finance and Accounting, 4(3), 342-353.
Işık, Ö., Belke, M. (2017), An empirical analysis of the determinants of net interest margins of Turkish listed banks: Panel data evidence from post-crisis Era. Sosyoekonomi, 25(34), 227-245.
Isik, O., Bolat, S. (2016), Determinants of non-performing loans of deposit banks in Turkey. Journal of Business, Economics and Finance, 5(4), 341-350.
Işık, Ö., Yalman, İ.N., Koşaroğlu Ş.M. (2017), Türkiye’de mevduat bankalarinin kârliliğini etkileyen faktörler/factors affecting the profitability of deposit banks in turkey. İşletme Araştırmaları Dergisi, 9(1), 362-380.
İskenderoğlu, Ö., Karadeniz, E., Atioğlu, E. (2012), Türk bankacilik sektöründe büyüme, büyüklük ve sermaye yapisi kararlarinin karliliğa etkisinin analizi/the effects of growth, size and capital structure decisions on profitability in Turkish banking sector. Eskişehir Osmangazi Üniversitesi İktisadi ve İdari Bilimler Dergisi, 7(1), 291-311.
Jensen, M.C. (1986), Agency costs of free cash flow, corporate finance, and takeovers. The American Economic Review, 76(2), 323-329. Karakaya, A., Bünyamin, E.R. (2013), Noninterest (nonprofit) income
and financial performance at Turkish commercial and participation banks. International Business Research, 6(1), 106-117.
Kasman, A., Tunc, G., Vardar, G., Okan, B. (2010), Consolidation and commercial bank net interest margins: Evidence from the old and new European union members and candidate countries. Economic
Modelling, 27(3), 648-655.
Lee, J.Y., Kim, D. (2013), Bank performance and its determinants in Korea. Japan and the World Economy, 27, 83-94.
Mamatzakis, E., Remoundos, P. (2003), Determinants of Greek commercial banks, 1989-2000. Spoudai, 53(1), 84-94.
Menicucci, E., Paolucci, G. (2016), The determinants of bank profitability: Empirical evidence from European banking sector. Journal of Financial Reporting and Accounting, 14(1), 86-115.
Moutsianas, K.A., Kosmidou, K. (2016), Bank earnings volatility in the UK: Does size matter? A comparison between commercial and investment banks. Research in International Business and Finance, 38, 137-150.
Pasiouras, F., Kosmidou, K. (2007), Factors influencing the profitability of domestic and foreign commercial banks in the European union. Research in International Business and Finance, 21(2), 222-237. Saif-Alyousf, A.Y., Saha, A., Md-Rus, R. (2017), Profitability of Saudi
commercial banks: A comparative evaluation between domestic and foreign banks using capital adequacy, asset quality, management quality, earning ability and liquidity parameters. International Journal of Economics and Financial Issues, 7(2), 477-484.
Samad, A. (2015), Determinants bank profitability: Empirical evidence from Bangladesh commercial banks. International Journal of
Financial Research, 6(3), 173-179.
Shehzad, C.T., De Haan, J., Scholtens, B. (2013), The relationship between size, growth and profitability of commercial banks. Applied Economics, 45(13), 1751-1765.
Sufian, F., Habibullah, M.S. (2009), Determinants of bank profitability in a developing economy: Empirical evidence from Bangladesh. Journal of Business Economics and Management, 10(3), 207-217. Titko, J., Skvarciany, V., Jurevičienė, D. (2015), Drivers of bank
profitability: Case of Latvia and Lithuania. Intellectual Economics, 9(2), 120-129.
Trujillo-Ponce, A. (2013), What determines the profitability of banks? Evidence from Spain. Accounting and Finance, 53(2), 561-586. Turgutlu, E. (2014), Dynamics of profitability in the Turkish banking
industry. Ege Akademik Bakış, 14(1), 43-52.
Ucler, G., Dogan, U. (2017), Asymmetric relationship between financial performance of Turkish banking sector and macroeconomic performance. Journal of Economics, Finance and Accounting, 4(2), 87-97.
Yeboah, J., Asirifi, E.K., Ampadu, S. (2015), The impact of mergers and acquisitions on service quality of banks in Ghana: Case study of eco bank and access bank Ghana. International Journal of Business and Management, 10(12), 167-180.