ISSN-L: 2501 - 1111 Available on-line at: www.oapub.org/edu
Copyright © The Author(s). All Rights Reserved.
doi: 10.5281/zenodo.1241544 Volume 4 │ Issue 6 │ 2018
EVALUATION OF THE PERCEIVED SERVICE QUALITY OF
SPECIAL SPORT CENTER ORIENTED AT RECRATION
ACCORDING TO SOME VARIABLES
Harun Ayari High School of Physical Education
and Sports Recreation, Gelişim University, İstanbul, Turkey
Abstract:
The aim of this study is evaluating the service quality that individuals perceive according to some certain variabilities in special sport centers. While the population includes the members of sport centers in Edirne, the sample includes the members of a sport center named Sports Montana. There are 94 males and 21 females in this study which has total 115 individuals. During the collection of data, I benefit from The Service Quality of Sport-Fitness Centers in Turkey which has been developed by Ucan and Dogu in 2007. The participants has evaluated the survey consisted total 31 articles and 6 aspects via five point likert scale. Tests of frequencies, descriptive, cross tabs, Kruskal Wallis, Mann Whitney U have helped this study. Eventually, participants are different from each other in the way of sex, exercise type, level of income. So, their perceptions of quality vary.
Keywords: fitness, sports, perceived service quality, recreation, leisure time 1. Introduction
Service is all kinds of events which have the features of meeting the requirements and is consumed at the same time it is produced. It is also a complement of non-physical activities that are sold with a certain price and need no possession of a goods with the aim of meeting the requirements, taking advantage and satisfaction.
Survey of the service quality constitutes the first step of the improvement and development of its quality, if a business gets true information about the current service quality level; it can take action to future needs (Eleren and others, 2007). Hence, service business have to develop various methods to test their customers’ perceives about the quality. This survey is easy with working systematically. The differences between
perceives and expectations of customers about the service quality has gained acceptance as the survey index (Ersöz and others 2009).
Today’s increasing competition circumstances make the similar business focus on the service quality and customer satisfaction to survive and earn a profit (Serarslan and Kepoğlu, 2006). Both increasing demand to sport and physical activities and spreading this kind of business have created competition (Yıldız, 2012). The fact is that sport business has to develop customer-oriented strategies to survive in this competitive world. While successful business stays alive, others have to stand back from market. This situation brings up the effects of service quality on the customer and causes efforts based on customer to get their satisfaction.
Service has been defined as economic activities that provide benefit and create values for customers in special times and places (Lovelock, 2000). Customer satisfaction forms when performance of product reaches the expectation and it has a key effect on the next buying behavior. Pleased customer buys the same product again and shares his/her experiences with other people (Kotler and Armstrong, 2004).
When we deal with the service quality in sport, this concept is described in more abstract factors. We can define sport services as a complement of activities which gain favor people to fun, reduce stress, being healthy, looking good, socializing etc. The classification of sport services is an important factor to understand the meaning of sport services. It can be categorized in two different aspects according to the type of participation. These aspects are named as sport services based on watching and attendance (Çimen and Gürbüz, 2007).
Recreational aimed sport services can be evaluated in these two categories below. Recreational aimed sport is one the most preferred fields. Because this kind of sport is the ability to response the every needs of individuals from all ages and sexes. Sport offers people some alternatives with its features, diversities, sense of community in open or indoor areas. Today when people care about nature, adventure, beauty and health etc. sport has become an important recreation mediator.
2. Method
2.1 Study Group
The aim of this study is evaluating the service quality and data have been collected by using random sampling method. Sample consists of member of a fitness center which is engaged in commercial activity in Edirne. With the permission of the director, we give active members these surveys. There are 350 individuals; however, only 150 of them want to be volunteer. As a result, we have evaluated 115 surveys which are filled out completely. Feedback correlation is %70.
2.2 Scale Instrument
physical environment quality, exerciser equipment, program quality, ambient conditions, which are total 31 article and 6 aspects. Reliability analysis of this scale has shown the Cronbach’s alpha is 0,93. This proves that the scale is reliable. Five point likert scale has been used to evaluate the statements in the scale. Results are limited to 115 individuals who are volunteer and member of the fitness center. Another limit is that the survey involves only Edirne Province due to some other problems such as time, lack of money and difficulty in getting permission from the directors of some fitness centers. Therefore, the results do not represent the service quality of all fitness centers in Turkey.
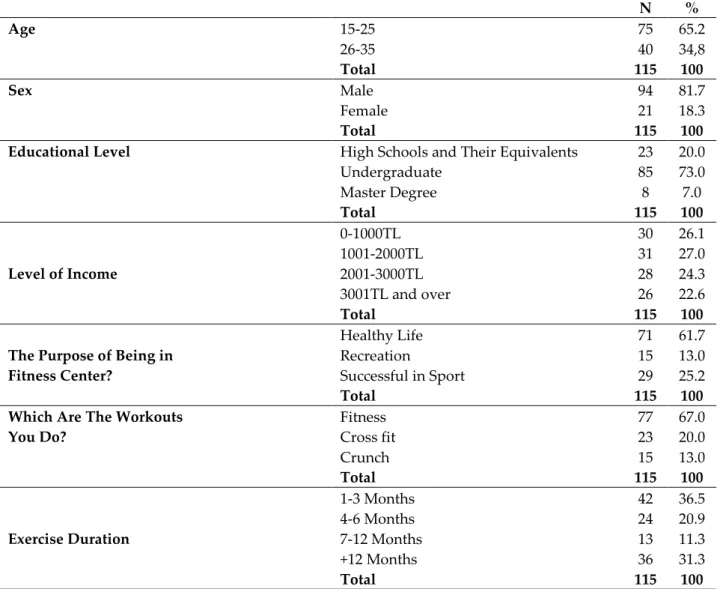
Table 1: Members’ Demographic Information
N % Age 15-25 75 65.2 26-35 40 34,8 Total 115 100 Sex Male 94 81.7 Female 21 18.3 Total 115 100
Educational Level High Schools and Their Equivalents 23 20.0
Undergraduate 85 73.0 Master Degree 8 7.0 Total 115 100 Level of Income 0-1000TL 30 26.1 1001-2000TL 31 27.0 2001-3000TL 28 24.3 3001TL and over 26 22.6 Total 115 100
The Purpose of Being in Fitness Center?
Healthy Life 71 61.7
Recreation 15 13.0
Successful in Sport 29 25.2
Total 115 100
Which Are The Workouts You Do? Fitness 77 67.0 Cross fit 23 20.0 Crunch 15 13.0 Total 115 100 Exercise Duration 1-3 Months 42 36.5 4-6 Months 24 20.9 7-12 Months 13 11.3 +12 Months 36 31.3 Total 115 100
When we look at the demographic information about the members, we can see that most of the participants are between 15-25 years (%65,2), male (%81,7), their educational levels are undergraduate (%73,0), their level of income and exercise duration are almost similar, their purpose is being healthy (%61,7), they usually do fitness (%67,0).
3. Results
Table 2: The Mean and Standard Deviation Value of
Perceived Service Quality and Dimensions
Perceived Service Quality N Minimum Maximum Mean±Sd
Interaction Quality 115 10,00 50,00 45,51±5,96
Outcome Quality 115 5,00 25,00 23,67±3,10
Physical Environment Quality 115 7,00 35,00 28,37±5,45
Exerciser Equipment 115 3,00 15,00 11,65±3,18
Program Quality 115 3,00 15,00 12,90±2,64
Ambient Conditions Quality 115 3,00 15,00 12,76±2,31
Total 115 31,00 155,00 134,87±17,45
In Table 2, participants’ interaction quality (45,51), outcome quality (23,66), physical environment quality (28,37), program quality (12,90), ambient conditions quality (12,90) are defined as high level. However, exerciser equipment (11,65) are lower. On this results, the perception of outcome quality is the highest but the perception of exerciser equipment quality is the lowest.
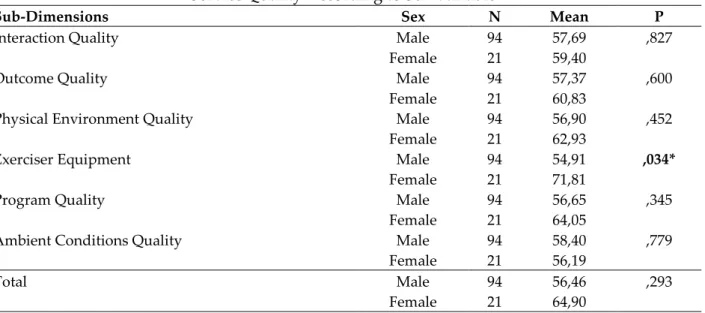
Table 3: Evaluation of the Members’ Perceive of
Service Quality According to Sex Variable
Sub-Dimensions Sex N Mean P
Interaction Quality Male 94 57,69 ,827
Female 21 59,40
Outcome Quality Male 94 57,37 ,600
Female 21 60,83
Physical Environment Quality Male 94 56,90 ,452
Female 21 62,93
Exerciser Equipment Male 94 54,91 ,034*
Female 21 71,81
Program Quality Male 94 56,65 ,345
Female 21 64,05
Ambient Conditions Quality Male 94 58,40 ,779
Female 21 56,19
Total Male 94 56,46 ,293
Female 21 64,90
P<0,05
The perceived service quality in fitness center differs by sexes of participants. This diversity has been shown in exerciser equipment sub-dimensions.
Table 4: Evaluation of the Members’ Perceive of
Service Quality According to Workout Types
Sub-Dimensions Types of Workouts N Mean±Sd Df P Division
Interaction Quality Fitness1 77 45,31±6,66
2
,759 Cross fit2 23 46,26±4,30
Crunch3 15 45,40±4,71
Outcome Quality Fitness1 77 23,19±3,66 ,054
Cross fit2 23 24,47±1,08
Crunch3 15 24,86±0,35
Physical Environment Quality Fitness1 77 28,14±5,83 ,971
Cross fit2 23 28,86±4,97
Crunch3 15 28,80±4,17
Exerciser Equipments Fitness1 77 11,22±3,40 ,161
Crossfit2 23 12,26±2,87
Crunch3 15 12,93±1,79
Program Quality Fitness1 77 12,42±3,02 ,035 1-2
Crossfit2 23 14,17±0,93
Crunch3 15 13,40±1,40
Ambient Conditions Quality Fitness1 77 12,57±2,47 ,494
Crossfit2 23 13,04±2,09 Crunch3 15 13,26±1,75 Total Fitness1 77 132,87±19,56 ,414 Crossfit2 23 139,08±12,36 Crunch3 15 138,66±9,77 P<0,05
There are significant diversities in program quality sub-dimension according to workout types that members do participate. This diversity is in between fitness and cross fit workouts.
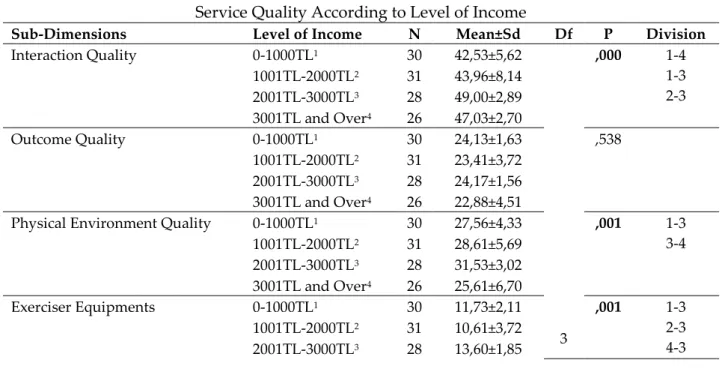
Table 5: Evaluation of the Members’ Perceive of
Service Quality According to Level of Income
Sub-Dimensions Level of Income N Mean±Sd Df P Division
Interaction Quality 0-1000TL1 30 42,53±5,62 3 ,000 1-4 1-3 2-3 1001TL-2000TL2 31 43,96±8,14 2001TL-3000TL3 28 49,00±2,89 3001TL and Over4 26 47,03±2,70 Outcome Quality 0-1000TL1 30 24,13±1,63 ,538 1001TL-2000TL2 31 23,41±3,72 2001TL-3000TL3 28 24,17±1,56 3001TL and Over4 26 22,88±4,51
Physical Environment Quality 0-1000TL1 30 27,56±4,33 ,001 1-3
3-4 1001TL-2000TL2 31 28,61±5,69 2001TL-3000TL3 28 31,53±3,02 3001TL and Over4 26 25,61±6,70 Exerciser Equipments 0-1000TL1 30 11,73±2,11 ,001 1-3 2-3 4-3 1001TL-2000TL2 31 10,61±3,72 2001TL-3000TL3 28 13,60±1,85
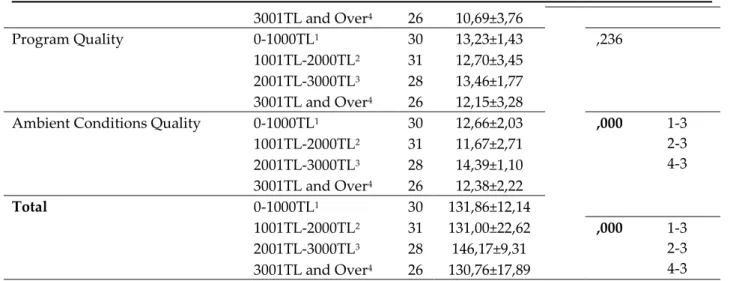
3001TL and Over4 26 10,69±3,76
Program Quality 0-1000TL1 30 13,23±1,43 ,236
1001TL-2000TL2 31 12,70±3,45
2001TL-3000TL3 28 13,46±1,77
3001TL and Over4 26 12,15±3,28
Ambient Conditions Quality 0-1000TL1 30 12,66±2,03 ,000 1-3
2-3 4-3 1001TL-2000TL2 31 11,67±2,71 2001TL-3000TL3 28 14,39±1,10 3001TL and Over4 26 12,38±2,22 Total 0-1000TL1 30 131,86±12,14 1001TL-2000TL2 31 131,00±22,62 ,000 1-3 2-3 4-3 2001TL-3000TL3 28 146,17±9,31 3001TL and Over4 26 130,76±17,89
The level of income results show that, participants who has 2001-3000 TL and 3001 TL and over income are more satisfied with the service quality than the ones have 0-1000 TL income. Also the ones who have 2001-3000TL income are more satisfied with the service quality than the ones having 1001-2000TL income In physical environment quality sub-dimension, individuals who have 0-1000 TL level of income find the service quality better than ones having 2001-3000TL level of income, besides participants having 2001-3000 TL level of income find the service quality better than ones having 3001 and over level of income. In exerciser equipment, ambient conditions quality and total perceived service quality sub-dimensions, participants who have 0-1000 TL, 1001-2000 TL, 3001TL and over level of income find the service quality worse than ones having 2001-3000TL level of income.
Table 6: Evaluation of the Members’ Perceive of
Service Quality According to Exercise Duration
Sub-dimensions Exercise Duration N Mean±Sd Df P Division
Interaction Quality 1-3 months1 42 45,83±4,74
3 ,000 1-4 1-2 2-4 3-4 4-6 months2 24 41,33±8,32 7-12 months3 13 43,23±6,31
12 months and over4 36 48,75±2,37
Outcome Quality 1-3 months1 42 22,66±3,60 ,000 1-2
1-4 4-6 months2 24 23,58±4,30
7-12 months3 13 24,30±1,54
12 months and over4 36 24,66±0,89
Physical Environment Quality 1-3 months1 42 28,33±6,33 ,000 1-2
2-4 4-6 months2 24 25,20±5,68
7-12 months3 13 27,07±4,19
12 months and over4 36 31,00±2,81
Exerciser Equipments 1-3 months1 42 11,95±3,51 ,000 1-4
2-4 3-4 4-6 months2 24 10,58±2,94
7-12 months3 13 8,61±2,93
12 months and over4 36 13,11±1,86
7-12 months3 13 14,15±1,40
12 months and over4 36 13,36±1,74
Ambient Conditions Quality 1-3 months1 42 12,35±2,02 ,000 1-4
2-4 3-4 4-6 months2 24 11,70±2,56
7-12 months3 13 10,84±2,40
12 months and over4 36 14,61±0,76
Total 1-3 months1 42 133,50±17,42 ,000 1-4
2-4 3-4 4-6 months2 24 124,91±22,29
7-12 months3 13 128,23±13,15
12 months and over4 36 145,50±6,93
In the interaction quality sub-dimension, the results show that participants who workout with the aim of recreative and exercise for 1-3 months have less sense of service quality than the ones who exercise for 13 months and over have. Participants who exercise for 1-3 months have much sense of service quality than the ones who exercise for 4-6 months have. Participants who exercise for 4-6 and 7-12 months have less sense of service quality than the ones who exercise for 12 months and over have. In the outcome quality sub-dimension, individuals who exercise for 1-3 months have less sense of service quality than the ones who exercise for 4-6 and 12 and over months. In physical environment quality sub-dimension, individuals who exercise for 1-3 months have higher perception about the service quality than the ones exercise for 4-6 months. Participants who continue to fitness center for 4-6 months have less sense of service quality than the ones who continue for 12 months and over. In exerciser equipment and ambient conditions sub-dimensions, participants who exercise for 12 months and over find the service quality better than the ones exercise for 1-3, 4-6 and 7-12 months do.
4. Discussion and Result
When we consider the demographic information of participants, most of them are 15-25 years old (%65,2). In the study which Akkoyun (2015) did in Elazığ Province, 15-25 years old participant consist of %17,0 of all. Most of them are males (%81,7), their educational levels are undergraduate (%73,0), their level of income are similar, their purpose is being healthy (%61,7), they usually do fitness (%67,0) and there isn’t significant division between their exercise durations.
When we look forward to table 2 and it’s sub-dimensions’ mean and standard deviation values, we can conclude that physical environment quality, ambient conditions quality, exerciser equipment quality, program quality, interaction quality and outcome(result) quality are good. This shows that individuals who participate this survey are satisfied with the service quality.
The perceived service quality in fitness center differs by the participants’ sexes. In exerciser equipment sub-dimension, female participants have better service quality than males. Akkoyun (2015) and Üzüm and others (2016) have found significant differences about the physical environment conditions sub-dimension according to
male and female participants’ perception of service quality. However, this does not show similarity with the study.
In program quality sub-dimension of participants’ workout types, there is significant difference. This difference is between fitness and cross fit. Individuals who participate the cross fit exercise have much sense of program quality than the ones who participate fitness exercise have.
There is significant difference between the perceptions of service quality of individuals according to their level of income. These differences are shown in sub-dimensions of interaction quality, physical environment quality, exerciser equipment, ambient conditions quality and total service quality. Yüzgenç and Özgül (2014), have found a significant difference in service quality sub-dimension. It corresponds to current study. However, Akkoyun (2015) has found a significant difference in ambient condition sub-dimension. This study does not show similarity with the current study. There aren’t significant differences in outcome quality and program quality sub-dimensions.
In fitness centers, there are significant differences in all aspects and total perceived service quality except program quality according to exercise durations of individuals.
As a result, individuals who exercise with the aim of recreation have different perceptions according to some significant differences. This sport center cares about the female oriented equipment and prepare better program to the individuals who do cross fit exercise than the others. Members who have 2001-3000TL level of income have better sense of service quality and the ones who exercise for 12 months and over find the service quality better than the ones who exercise for under 12 months.
Bibliography
1. Serarslan, M.Z. ve Kepoğlu, A. (2006). Spor Örgütlerinde Toplam Kalite Yönetimi. İstanbul: Morpa Kültür Yayınları.
2. Yildiz, S.M. (2012). Instruments for Measuring Service Quality in Sport and Physical Activity Services. Collegium Antropologicum, 36(2), 689–696.
3. Yıldiz, S.M. And Tüfekçi, Ö. (2010). Assessment Of Expectations And Perceptions Of Fitness Center Customers For Service Quality. Balikesir University the Institute of Social Sciences, 13(24), 1–11.
4. Lovelock, C. (2000). Services Marketing: People, Technology, Strategy. 4th Edition, New Jersey: Prentice Hall.
5. Parasuraman, A, Zeithaml, V.A., And Berry, L.L. (1994). Reassessment Of Expectations As A Comparison Standard On Measuring Service Quality: Implications For Further Research. Journal Of Marketing, 58(1), 111–124.
7. Çimen, Z., Gürbüz, B. (2007). Spor Hizmetlerinde Toplam Kalite Yönetimi. Alp Yayınevi, Ankara.
8. Karaküçük, S. (2005). Rekreasyon: Boş Zamanları Değerlendirme. Gazi Kitabevi, Ankara.
9. Yıldız Y. Onağ AO. Onağ Z (2013). Spor Ve Rekreasyon Hizmetlerinde Algılanan Hizmet Kalitesinin İncelenmesi: Fitness Merkezi Örneği. Uluslararası Hakemli Beşeri Ve Akademik Bilimler Dergisi, 2(3):114-130.
10. Eleren, A., Bektaş, Ç.,Görmüş, A. Ş. (2007). “Hizmet Sektöründe Hizmet Kalitesinin Servqual Yöntemi Ile Ölçülmesi Ve Hazır Yemek İşletmesinde Bir Uygulama”. Finans Politik&Ekonomik Yorumlar, 44(514): 75-88.
11. Ersöz, S., Pinarbaşi, M., Türker, A.K., Yüzükirmizi, M. (2009). “Hizmet Kalitesinin Servqual Metodu İle Ölçümü Ve Sonuçlarının Yapısal Eşitlik Modelleri İle Analizi: Öğretmen Evi Uygulaması”. International Journal Of Research & Development, 1(1): 19-27.
12. Akkoyun, İ. (2015). Yerel Yönetimlere Ait Fitness Merkezlerinde Algılanan Hizmet Kalitesi (Elazığ İl Örneği), Fırat Üniversitesi, Sağlık Bilimleri Enstitüsü, Yüksek Lisans Tezi.
13. Üzüm, H., Yeşildağ, B., Karlı, Ü.,Ünlü, H., Parlar, F., Çokpartal, C., Tekin, N., (2016). Kamu Ve Özel Spor Merkezleri Müşterilerinin Hizmet Kalitesi Algılarının İncelenmesi, AİBÜ Sosyal Bilimler Enstitüsü Dergisi, Cilt 16, Yıl 16, Sayı: 3, 16: 167-180.
14. Uçan, Y. (2007). Spor-Fitness Merkezlerinin Algılanan Hizmet Kalitesi Ölçeğinin Geliştirilmesi, Abant İzzet Baysal Üniversitesi, Sosyal Bilimler Üniversitesi, Yüksek Lisans Tezi.
15. Yüzgeç, A.A., Veözgül, S.A. (2014). Yerel Yönetimlerin Sunduğu Spor Hizmetlerinde Hizmet Kalitesi (Gençlik Merkezleri Ve Aile Yaşam Gençlik Merkezleri Örneği), Spor Bilimleri Dergisi, Hacettepe J. Of Sport Science 25 (2).
Creative Commons licensing terms
Author(s) will retain the copyright of their published articles agreeing that a Creative Commons Attribution 4.0 International License (CC BY 4.0) terms will be applied to their work. Under the terms of this license, no permission is required from the author(s) or publisher for members of the community to copy, distribute, transmit or adapt the article content, providing a proper, prominent and unambiguous attribution to the authors in a manner that makes clear that the materials are being reused under permission of a Creative Commons License. Views, opinions and conclusions expressed in this research article are views, opinions and conclusions of the author(s). Open Access Publishing Group and European Journal of Education Studies shall not be responsible or answerable for any loss, damage or liability caused in relation to/arising out of conflicts of interest, copyright violations and