INVESTIGATION OF TWO NEW LYOTROPIC LIQUID CRYSTALLINE SYSTEMS: [Zn(H2O)6](NO3)2-C12EO10-CTAB-H2O AND [Zn(H2O)6](NO3)2-C12EO10-SDS-H2O A THESIS
SUBMITTED TO THE DEPARTMENT OF CHEMISTRY AND THE INSTITUTE OF ENGINEERING AND SCIENCES
OF BİLKENT UNIVERSITY
IN PARTIAL FULFILLMENT OF THE REQUIREMENTS FOR THE DEGREE OF
MASTER OF SCIENCE
By
CEMAL ALBAYRAK July 2008
I certify that I have read this thesis and that in my opinion is it is fully adequate, in scope and quality, as a thesis of the degree of Master in Science
……….. Prof. Dr. Ömer Dağ (Supervisor)
I certify that I have read this thesis and that in my opinion is it is fully adequate, in scope and quality, as a thesis of the degree of Master in Science
……….. Prof. Dr. Şefik Süzer
I certify that I have read this thesis and that in my opinion is it is fully adequate, in scope and quality, as a thesis of the degree of Master in Science
……….. Prof. Dr. Engin Umut Akkaya
I certify that I have read this thesis and that in my opinion is it is fully adequate, in scope and quality, as a thesis of the degree of Master in Science
……….. Doç. Dr. Nihal Aydoğan
I certify that I have read this thesis and that in my opinion is it is fully adequate, in scope and quality, as a thesis of the degree of Master in Science
……….. Asst. Prof. Dr. Emrah Özensoy
Approved for the Institute of Engineering and Sciences
……….. Prof. Dr. Mehmet Baray
ABSTRACT
INVESTIGATION OF TWO NEW LYOTROPIC LIQUID CRYSTALLINE SYSTEMS: [Zn(H2O)6](NO3)2-C12EO10-CTAB-(H2O)
AND [Zn(H2O)6](NO3)2-C12EO10-SDS-H2O
CEMAL ALBAYRAK M.S. in Chemistry
Supervisor: Prof. Dr. Ömer Dağ July, 2008
The transition metal aqua complex salts (TMS) can be dissolved in oligo (ethylene oxide) type non-ionic surfactants (CnH2n+1(CH2CH2O)mOH, denoted as CnEOm) with very high salt/surfactant ratios to form lyotropic liquid crystalline (LLC) mesophases. In this study we show that addition of charged surfactants, such as cethyltrimethylammoniumbromide (CTAB) or sodiumdodecylsulfate (SDS) results a new type of LLC in which the solubility of the salts in the LC mesophase of TMS: C12EO10 is enhanced. The LC phase of a [Zn(H2O)6](NO3)2:C12EO10 is hexagonal between 1.2 and 3.2 and cubic (liquid like) above 3.2 salt/ C12EO10 mole ratios. Addition of CTAB or SDS increases the same salt/surfactant mole ratio to 8.0-9.0, which is a record salt amount for a lyotropic liquid crystalline system. The mixed surfactant mesophases have birefringent hexagonal mesophase between 2.0 and 8.0 salt/C12EO10 mole ratios The new mixed surfactant systems can also accomodate high TMSs in the presence of excessive amounts of water (35.0 water:C12EO10 mole ratio).
Both systems have similar thermal properties. Izotropisation Temperature (IT) values of the new systems go down with increasing salt and charged surfactant concentrations. The mesophases are stable at high salt concentrations in the presence of high CTAB or SDS concentration in the expense of the stability of the LLC mesophase. The IT values changes from around 80oC down to 32oC with increasing composition of the LLC mesophase. The new mesophase have 2D or 3D hexagonal structure that responds to water content of the phase. A 3D hexagonal phase transforms to 2D hexagonal phase with the evaporation of excess water in both [Zn(H2O)6](NO3)2:C12EO10-CTAB-H2O and [Zn(H2O)6](NO3)2:C12EO10-SDS-H2O systems. The new mesophases were investigated using POM (Polarised optical microscope), and a hot stage under the POM, XRD (X-ray Diffraction), FT-IR (Fourier Transform Infrared Spectroscopy) and Raman techniques. These new LLC systems are good candidates for metal containing mesostructured material synthesis due to their high salt content.
Keywords: Transition metal aqua complex salts, Izotropisation Temperature, Lyotropic liquid crystals, Hexagonal and cubic mesophases, Mixed Surfactants, CTAB, SDS, and C12EO10
ÖZET
İKİ YENİ LİYOTROPİK SIVI KRİSTAL MEZOFAZIN İNCELENMESİ : [Zn(H2O)6](NO3)2-C12EO10-CTAB-H2O ve [Zn(H2O)6](NO3)2-C12EO10
-SDS-H2O
CEMAL ALBAYRAK Kimya Yüksek Lisans Tezi Danışman: Prof. Dr. Ömer Dağ
Temmuz, 2008
Geciş metal hidrat tuzları (GMT), Oligo (etilen oksit) (CnH2n+1(CH2CH2O)mOH, CnEOm olarak gösterilir) tipi yüzey aktiflerle yüksek oranlarda çözünüp liyotropik sıvı kristal mezofazlar oluşturur. Bu çalışmada setiltrimetilamonyumbromür (CTAB) ya da sodyumdodesilsulfat (SDS) gibi yüzey aktiflerin GMT:C12EO10 liyotropik sıvı kristal fazlara eklenmesiyle, GMT nin çözünürlüğünün büyük oranda arttığı, yeni bir sıvı kristal sistem ortaya konulmuştur. [Zn(H2O)6](NO3)2:C12EO10 sıvı kristal sistemi 1.2-3.2 tuz/C12EO10 moloranı arasında hekzagonal, 3.2 tuz/C12EO10 oranı ve üzerinde sıvı veya kübik fazdadır. CTAB ve SDS eklenerek tuz/C12EO10 mol oranı, bir sıvı kristal system için rekor sayılabilecek 8.0-9.0 oranına kadar yükseltildiği tespit edildi. Karışık yüzey aktif mezofazları 2.0 ile 8.0 tuz/C12EO10 tuz oranında hekzagonaldır. İki yeni sistem de benzer termal özelliklere sahiptir ve izotropizasyon sıcaklıkları (İS) artan tuz ve iyonik yüzey aktif
miktarındaki artışla ters orantılıdır. Oluştutulan mezofazlar yüksek tuz ve iyonik yüzey aktif oranlarında kararlı olmalarına karşın iki sistem de GMT:C12EO10 liyotropik sıvı kristal fazlarına göre daha düşük sıcaklıklarda erirler. İS değerleri artan yüklü yüzey aktif madde miktarına göre 80oC den 32oC ye kadar düşer. Yeni mezofazlar içerdikleri su miktarına göre 2B ya da 3B hegzagonal yapıda olabilirler. Fazla miktardaki suyun buharlaşmasıyla iki sistem de 2B hekzagonal faza dönüşür.Yeni sistemler Polarize Optik Mikroskobu (POM) ve buna bağlı ısıtıcısıyla, XRD, FT-IR ve Raman teknikleriyle incelenmiştir. Bu liyotropik sıvı kristal sistemler yüksek oranda metal içermeleri nedeniyle, metal içeren mezoyapılı malzeme sentezinde kullanılabilirler.
Anahtar Kelimeler: Geçis metali hidrat kompleks tuzları, Liyotropik sıvı kristaller, hekzagonal ve kübik mezofazlar, yüzey aktif karışımları, CTAB, SDS, ve C12EO10
ACKNOWLEDGEMENTS
I wish to thank my supervisor Prof. Dr. Ömer Dağ for his valuable discussions and guidance throughout the thesis work.
I should express my special thanks to the evening star, Aslı M. Soylu, for her help in the anionic surfactant systems.
I would like to recognize Halil Okur for his comments and help in titania systems. I would also thank to Altug S. Poyraz for his valuable discussions.
I also wish to acknowledge the past and present members of the Chemistry Department for their moral support and friendship.
Many thanks goes to my precious roommates Hacı O. Güvenç and Murat Altunbulak
This thesis work commemorates the endeavour and love of my family, especially my beloved father.
‘’… All that we see or seem Is but a dream within a dream …’’ E.A.P
TABLE OF CONTENTS
1. INTRODUCTION...1
1.1. Liquid Crystals...1
1.1.1. Nature of Surfactants ...8
1.1.2. Effect of the Additives ...11
1.2. Binary and Ternary systems of Oligo(ethylene oxide) Type Surfactants (CnEOm + H2O and CnEOm + H2O +Oil)...13
1.3. Mixed Surfactant Systems ...15
1.4. Transition Metal Salt (TMS): Amphiphile Systems ...17
1.5. Importance of LLCs and Mesostructured Materials ...19
2. EXPERIMENTAL...23
2.1. Materials ...23
2.2. Synthesis ...23
2.2.1. Preparation of LLC phases of [Zn(H2O)6](NO3)2:No:CTAB:H2O , [Zn(H2O)6](NO3)2: No:SDS:H2O and [Zn(H2O)2](Br)2: No:H2O...23
2.2.2. Samples after Preparation ...25
2.3. Instrumentation ...26
2.3.1. Polarized Optical Microscopy...26
2.3.2. X-ray Diffraction ...26
2.3.3. FT-IR (Fourier-Transform Infrared Spectroscopy) ...27
2.3.4. Micro-Raman Spectroscopy...28
3. RESULTS AND DISCUSSIONS ...29
3.2. The LLC mesophases of [Zn(H2O)6](NO3)2:No:CTAB:H2O System...32
3.2.1. Characterization of the LLC mesophases of [Zn(H2O)6](NO3)2:No:CTAB:H2O System ...32
3.2.2. Thermal and Structural properties of [Zn(H2O)6](NO3)2:No:CTAB:H2O System...41
3.2.3. FT-IR and Raman Spectroscopic Investigation of [Zn(H2O)6](NO3)2:No:CTAB:H2O System ...55
3.3. The LLC mesophases of [Zn(H2O)6](NO3)2: No: SDS:H2O systems ...65
4. CONCLUSIONS ...79
5. APPENDIX...82
LIST OF TABLES
Table 1.1 Critical g parameters...11 Table 3.1 ITs of ZnBr2.6H2O:No and [Zn(H2O)6](NO3)2: No ...49 Table 3.2: Phase information at different salt and CTAB concentrations. Each sample contains 35 mole ratio of water ...51
LIST OF FIGURES
Figure 1.1: An illustration of positional and orientational order in a)solid, b) liquid crystal and c)liquid (each line represents a molecular unit or a building block) ...2 Figure 1.2: Top: a calamitic LC molecule. Bottom: schematical representation of molecule showing rigid center and flexible ends...3 Figure 1.3:Discotic LC molecules a Phthalocyanin on the left and pyrene on the right. ...4 Figure 1.4: Typical assemblies for calamitic and discotic phases ...4 Figure 1.5: Some cationic and nonionic surfactants...5 Figure 1.6:Schematic phase diagram of CTMABr in water. (CMC1: critical micelle concentration for spherical micelles, CMC2: critical micelle concentration for rod-like micelles)...7 Figure 1.7: Nine different phases in a ternary surfactant:water:oil system. ...8 Figure 1.8: Schematic representation of a surfactant molecule as an ice-cream cone. (redrawn image from) ...10 Figure 1.9: Phase diagram of CnEOm -water system as a function of the volume
fraction of EO chain in the surfactant molecule and weight fraction of CnEOm at 25 °C. (WS is the weight fraction of CnEOm)...14 Figure 1.10:Schematical representation of Hydrogen Bonding which leads to LC formation...18 Figure 1.11:Schematical representation of the cooperative self- assembly and true liquid crystalline templating. ...20
Figure 3.1: A drawing of a spherical micelle for TMSOC system. ...34 Figure 3.2: XRD pattern of 6.0[Zn(H2O)6](NO3)2:1.0 No:0.5 CTAB: 3.5 H2O ...36 Figure 3.3: Index graph for Figure 3.2...36 Figure 3.4: XRD pattern of 6.0[Zn(H2O)6](NO3)2:1.0 No:0.5 CTAB: 3.5 H2O after water evaporation...37 Figure 3.5: Index graph for Figure 3.4...37 Figure 3.6:XRD pattern of a)6.0[Zn(H2O)6](NO3)2:1.0 No:0.5 CTAB:3.5H2O b) crystalline [Zn(H2O)6](NO3)2 and c) crystalline CTAB ...38 Figure 3.7: POM texture of a 2D hexagonal CTAB containing sample 2.0
[Zn(H2O)6](NO3)2/ No:0.5CTAB ...39 Figure 3.8 : POM texture of a 3D hexagonal CTAB containing sample 6.0
[Zn(H2O)6](NO3)2:1.0 No:1.0CTAB ...40 Figure 3.9:POM texture of an intermediate textured sample...40 Figure 3.10: IT vs Salt concentration plot. x1 is a concentration where TMSO system is known to be liquid and x2 is a point where 0.25 mole ratio of CTAB containing sample known to be liquid. CTAB containing samples have 3.5 mole ratio of water.44 Figure 3.11: ITs showing the shift in maxima with increasing [Zn(H2O)6](NO3)2 concentration. All samples contain 3.5 mole ratio of H2O. ...45 Figure 3.12: ITs showing the behaviour of the system towards water addition. ...46 Figure 3.13: ITs of 2.0 mole ratio of [Zn(H2O)6](NO3)2 with and without 3.5 mole ratio of H2O with increasing CTAB amount...47 Figure 3.14: POM image of an intentionally crystallized sample (sample is
Figure 3.15: PXRD patterns of 2.0 [Zn(H2O)6](NO3)2/ No mole ratio containing samples without water...51 Figure 3.16: XRD patterns of 6 different samples, each signal represents a different sample:I) 8.0[Zn(H2O)6](NO3)2:1.0No:0.75CTAB:3.5H2O, II) 4.0 [Zn(H2O)6] (NO3)2: 1.0No:0.5CTAB:1.7H2O, III) 5.0[Zn(H2O)6](NO3)2:1.0No:0.5CTAB:3.5H2O, IV) 2.0 [Zn(H2O)6](NO3)2:1.0No, V) 3.0[Zn(H2O)6](NO3)2:1.0No:0.5CTAB, VI) 2.0 [Zn (H2 O)6](NO3)2:1.0 No:0.5 CTAB ...53 Figure 3.17: XRD patterns of: I) 3.0[Zn(H2O)6](NO3)2:1.0No:0.5CTAB:35H2O, II)
3.0[Zn(H2O)6](NO3)2:1.0No:0.5CTAB:21H2O and III) 3.0[Zn(H2O)6](NO3)2:1.0No
:0.5CTAB:3.5H2O (each signal represents a different sample) ...54
Figure 3.18: XRD patterns of: I) 4.0[Zn(H2O)6](NO3)2:1.0No:0.5CTAB:28H2O, II)
4.0[Zn(H2O)6](NO3)2:1.0No:0.5CTAB:14H2O and III) 4.0 [Zn(H2O)6] (NO3)2:1.0No
:0.5 CTAB:1.7H2O (each signal represents a different sample) ...55
Figure 3.19: FT-IR spectra for the υ(OH) streching region of a) No, b) No/water (50%wt), c) 2.0 [Zn(H2O)6](NO3)2: 1.0 No, and d) 2.0 [Zn(H2O)6](NO3)2: 1.0 No: 0.5 CTAB...57 Figure 3.20: FT-IR spectra for υ(CO) strechings of a) No, b) 2.0 [Zn(H2O)6](NO3)2: 1.0 No and c) 2.0 [Zn(H2O)6](NO3)2: 1.0 No: 0.5 CTAB (* represents coordinated nitrate signals)...57 Figure 3.21: FT-IR spectra of a) 2.0 [Zn(H2O)6](NO3)2: 1.0 No: 0.5 CTAB and b) 2.0 [Zn(H2O)6](NO3)2: 1.0 No...59 Figure 3.22: FT-IR spectra of CTAB:H2O:No system; followed during water
evaporation (top to bottom) ...60 Figure 3.23: FT-IR spectra of TMS:CTAB:H2O:No (3:0.5:7:1) system; followed during water evaporation. ...61
Figure 3.24: FT-IR spectra of a) 2.0 [Zn(H2O)6](NO3)2: 1.0 No: 0.5 CTAB:3.5 H2O
and b) 6.0 [Zn(H2O)6](NO3)2: 1.0 No: 0.5 CTAB: 3.5 H2O...62
Figure 3.25: Raman spectra of a) 2.0 [Zn(H2O)6](NO3)2: 1.0 No: 0.5 CTAB b) 2.0 [Zn(H2O)6](NO3)2: 1.0 No...63
Figure 3.26: The Raman spectra of a) Crystalline CTAB b) Difference spectrum of CTAB containing and CTAB free sample (2.0 mole ratio of [Zn(H2O)6](NO3)2 and 0.5 mole ratio of CTAB)...64
Figure 3.27: The Raman spectra of a) 2.5 Zn(II)Br: 1.0 No, b) 2.0 [Zn(H2O)6](NO3)2: 1.0 No: 0.5 CTAB, c) 8.0 [Zn(H2O)6](NO3)2: 1.0 No: 0.75 CTAB and d) 2.0 [Zn(H2O)6](NO3)2: 1.0 No...65
Figure 3.28: XRD pattern of 6.0 [Zn(H2O)6](NO3)2: 1.0 No: 0.5 SDS: 3.5 H2O with a POM image in the inset...67
Figure 3.29: X-ray pattern of crystalline SDS……….68
Figure 3.30
:
POM image of a 2D hexagonal TMSAW samples….………..….68Figure 3.31
:
POM images of a 3D hexagonal TMSAW samples………...69Figure 3.32:(I) and (II) corresponds to the same FT-IR spectra for low and high energy, respectively of a) crystalline SDS, b) No:SDS:H2O (1:1/2:10), c) 3.0[Zn(H2O)6](NO3)2: 1.0 No, d) 3.0 [Zn(H2O)6](NO3)2: 1.0 No: 0.125 SDS: 3.5 H2O, e) 3.0 [Zn(H2O)6](NO3)2: 1.0 No: 0.250 SDS: 3.5 H2O, f) 3.0 [Zn(H2O)6](NO3)2: 1.0 No: 0.375 SDS: 3.5 H2O and g) 6.0 [Zn(H2O)6](NO3)2: 1.0 No: 0.5 SDS: 3.5 H2O...70 Figure 3.33: The Raman Spectra of a) crystalline SDS, b) 3.0[Zn(H2O)6](NO3)2: 1.0 No, c) 3.0 [Zn(H2O)6](NO3)2: 1.0 No: 0.25 SDS: 3.5 H2O, d) 6.0 [Zn(H2O)6](NO3)2: 1.0 No: 0.5 SDS: 3.5 H2O and e) 8.0 [Zn(H2O)6](NO3)2: 1.0 No: 0.75 SDS: 3.5 H2O
...71 Figure 3.34: IT vs Salt concentration plot: I) TMSO ([Zn(H2O)6](NO3)2:No), II) x[Zn(H2O)6](NO3)2:No:0.125 SDS:3.5 H2O, III) x[Zn(H2O)6](NO3)2:No: 0.250 SDS: 3.5H2O, IV) x[Zn(H2O)6](NO3)2:1.0No:0.375SDS:3.5H2O and V) x[Zn(H2O)6](NO3)2:1.0 No: 0.5 SDS: 3.5 H2O (a1 is the point where 0.125 SDS/No mole ratio is insoluble, a2 is the point where 0.375 SDS/No mole ratio is insoluble, a3 is the point where 0.5 SDS/No mole ratio is insoluble)...73 Figure 3.35: The FT-IR spectra of a) crystalline SDS, b) No:SDS:H2O (1:1/2:10), c) 5.0[Zn(H2O)6](NO3)2:1.0No: 0.5 SDS: 3.5 H2O and d) 6.0[Zn(H2O)6](NO3)2:1.0No: 0.5 SDS: 3.5 H2O...75 Figure 3.36: FT-IR spectra for 6.0[Zn(H2O)6](NO3)2:1.0No: 0.5 SDS: 3.5 H2O : a) fresh, b) heated to 70oC, and c) sample is left at room temperature for a while……...76 Figure 3.37: The XRD patterns of 5 different samples, each signal represents a different sample, from left to right: I) 8.0[Zn(H2O)6](NO3)2:1.0No:0.75SDS:3.5H2O, II)6.0[Zn(H2O)6](NO3)2:1.0No:0.75CTAB:1.7H2O, III) 5.0[Zn(H2O)6](NO3)2 :1.0No: 0.25SDS:3.5H2O, IV) 3.0[Zn(H2O)6](NO3)2:1.0No:0.25SDS:3.5H2O and V) 2.0[Zn(H2O)6](NO3)2:1.0No:0.25SDS:3.5H2O...78
1. INTRODUCTION
1.1 Liquid Crystals
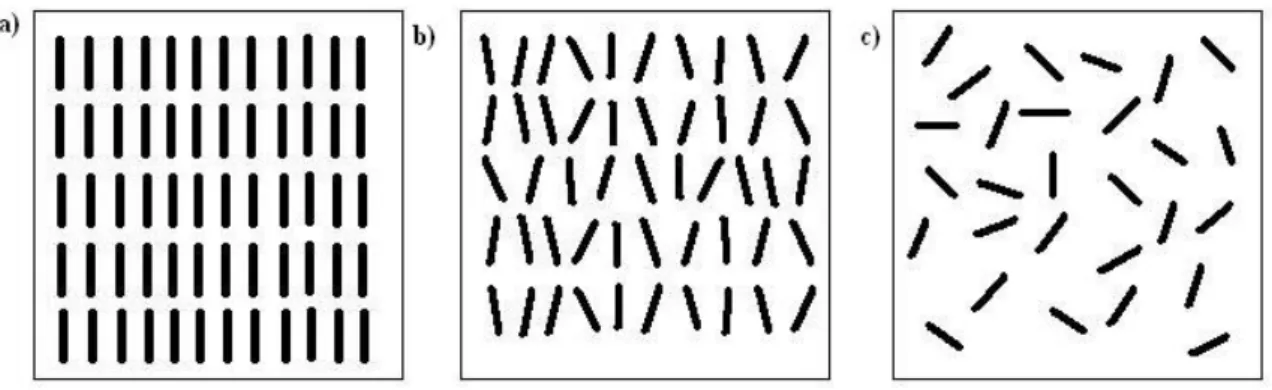
Unexpectedly certain solids show a gradual phase change to liquid phase upon heating. For such materials, at certain temperatures solid phase transforms to a birefringent (doubly refractive anisotropic) or a non-fringent isotropic fluid that has physical properties in between those of a liquid and those of a crystalline solid. As the temperature is raised, the birefringent property is surmounted and eventually the fluid transforms to isotropic liquid phase. Note also that, during heating, it is possible to observe structural changes in which molecules still have long-range orientational order in this phase. When the liquid is cooled back, first, liquid phase transforms to a birefringent fluid and then to an ideal crystalline solid.
The birefringent property is directly related to long-range orientational order of the molecules in the structure. In molecular crystalline solids, molecules have limited space (lattice points) and they are oriented in certain directions. Therefore, the order is both positional and orientational. In liquids, it is a well known fact that molecules move randomly through the bulk and there is also no long-range orientational order, that is, molecular axes change randomly. There is however a class of matter, which are neither solids nor liquids, which do not have positional order but to some extend do have orientational order. This class of matter is considered to be the fourth phase of matter and named as liquid crystals (LC) [1]. Positional and
orientational order in solid, liquid crystal and liquid phases are illustrated in Fig.1.1.
Figure 1.1: An illustration of positional and orientational order in a)solid, b) liquid crystal and c)liquid (each line represents a molecular unit or a building block)
Molecular order in liquid crystals may vary widely depending on the intrinsic properties of monomer building blocks and temperature. It would be appropriate to say that most of the order in crystalline solid is lost while it is transforming to a liquid crystal. The value of latent heat is around 250 J/g for crystal to liquid transition. However, the value of latent heat is around 5 J/g for a typical liquid crystal to liquid transition [1].While being much more disordered as compared to a typical crystalline solid, the liquid crystals have many abilities some of which are considered to be very crucial for both science and technology. Not like solid materials, the principal forces acting on LCs are rather weak (Hydrogen bonding (H-bonding), dipole-dipole interactions, van der Wall’s forces). Strong chemical forces, intrinsic for hard materials such as ionic and covalent bonding, have always attracted great attention by the chemical society. However, the nature of the weak forces of the soft chemistry has been grasped lesser. The attention to the LCs and advanced solid material synthesis require a significant understanding of interface chemistry, and helps us to produce new and novel materials. Moreover, the soft chemistry methods have a profound
effect in understanding the nature of weak forces, which is also crucial in the self-assembly processes of living organisms.
Liquid Crystals are divided in two main groups; thermotropic and lyotropic. Thermotropic LCs are molecules that have certain beneficial shapes that allows them to form LC phases at certain temperature ranges. Therefore the LC phase properties are functions of temperature. There are two sub groups for thermotropic LCs: calamitic and discotic. A typical molecule that has a calamitic LC phase has a rod shaped structure in which one molecular axis is much longer than the other two [1] . Another property that favors the stability of the calamitic phase is that the molecule should have a rigid center to maintain its alignment on the orientational direction. It should preferably have flexible parts at each end which strengthens weak forces, intra-molecular interactions. Figure 1.2. represents a typical calamitic LC molecule and its schematic representation.
Figure 1.2: Top: a calamitic LC molecule. Bottom: schematical representation of molecule showing rigid center and flexible ends.
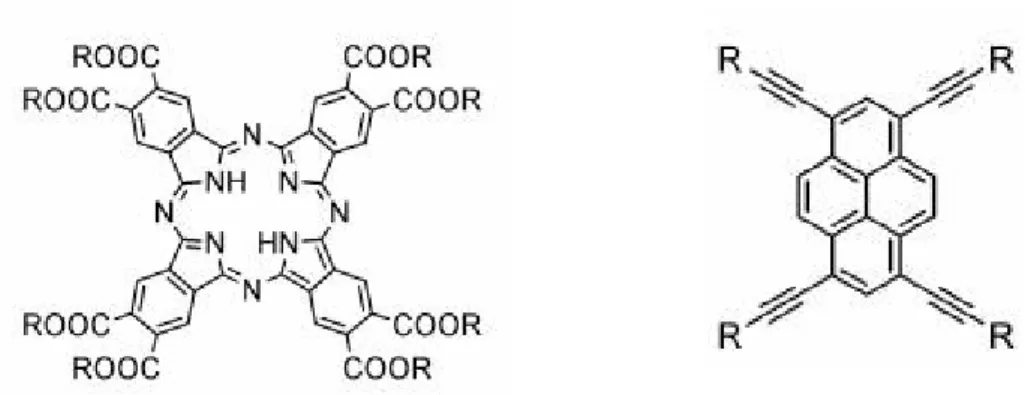
Another sub-group of thermotropic LCs is discotic LCs. As the name implies building blocks of discotic LCs are disc-like molecules. They have both rigid and flexible parts. Discotic LC molecules usually have ring structures such as benzene
rings at the center of the molecule with several alkyl groups around the ring. The xy plane of the molecule is greater than its z-direction. However, the weak molecular interactions both in xy plane and z-direction play an important role in the self assembly of a discotic LC [1]. A typical discotic LC is given in Figure 1.3. In addition, a usual assembly of molecules can be seen for both discotic and calamitic in Figure 1.4.
Figure 1.3 :Discotic LC molecules a Phthalocyanin on the left and pyrene on the right. [2]
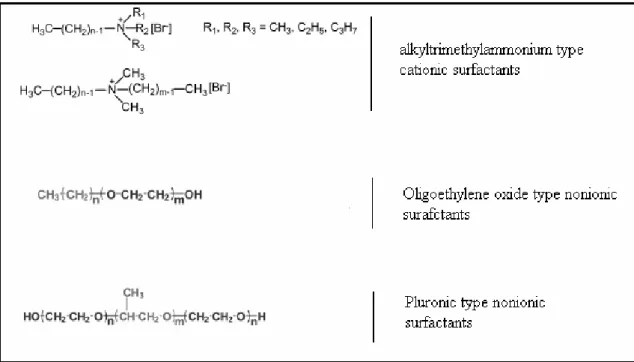
In addition to single component LCs, like thermotropics, a LC phase can also be formed with more than one component. This class of molecules has another degree of freedom – concentration - that helps them to form a rich variety of new structures [3, 4]. In order to distinguish them from thermotropics, they are named as lyotropic liquid crystals (LLCs). The molecules that have LLC behaviour should contain hydrophilic (water-like) and hydrophobic (lipid-like) groups; that help the molecule to form aggregates when put into a proper solvent. The molecules that have both hydrophilic and hydrophobic parts are named as amphiphilic molecules. Surfactants are in general amphiphilic molecules that tend to decrease the surface tension of the water in an aqueous media [5] . There are many types of surfactants; surfactants which bear no charge in a solvent are called non-ionic surfactants, which bear charge are called as anionic or cationic surfactants depending on the sign of the charge on their hydrophilic parts (Figure 1.5).
As mentioned before, surfactants are surface active molecules, which reduce the surface tension of the solvent and are oriented at the air (hydrophobic)-water (hydrophilic) interface [1, 5-7]. When the concentration of the surfactant molecules is increased, they tend to form spherical aggregates that diffuse freely through the water. These particles are called micelles [1, 8, 9] (Figure 1.6). Formation of micelles is related to the intermolecular interactions of the surfactant molecules. Consider an oligo-ethylene oxide molecule that has a hydrophobic alkyl chain at one end and hydrophilic ethoxy chain at the other end. The ethoxy groups of this molecule forms hydrogen bonds with water molecules while disrupting the H-bonding network of water molecules in the bulk. When the hydrophilic regions of two surfactants come close to each other they had to share the same shell of H-bonding network [8-10]. This is an energetically unfavorable situation since water molecules are in excess. Therefore, the ethoxy chains tend to keep away from each other where the result is a repulsion in between hydrophilic parts. Note also that the hydrophobic regions cannot interact with water molecules. Despite the structural restrictions of water molecules close to a hydrophobic region, two domains (namely water and hydrophobic regions) are separated. This gives a chance for hydrophobic interaction between alkyl chains and known as hydrophobic force or hydrophobic interaction [8-10]. Both hydrophilic repulsion and hydrophobic attraction directs a spherical structure and aggregation at some critical concentration of surfactant molecules.
Figure 1.6:Schematic phase diagram of CTMABr in water. (CMC1: critical micelle concentration for spherical micelles, CMC2: critical micelle concentration for rod-like micelles) [11]
Below this critical concentration surfactant molecules cannot form micelles and this critical concentration is called as critical micelle concentration (CMC) The micellization is a function of concentration and temperature and different for every surfactant [1]. Further increment in surfactant concentration leads to aggregation of micelles and formation of LLC in different meso-structures. A typical phase diagram is given for a surfactant:water binary system with respect to temperature and concentration in Figure 1.6.
Formation of mesostructures in the presence of surfactants and solvents is related to several parameters, which influence type of the mesophases at the end. In
addition to concentration and nature of surfactants and solvents, addition of co-solvents, co-surfactants and salts greatly affect the resulting structures.
1.1.1. Nature of Surfactants
In general, upon gradual increase of surfactant concentration in water, number of different phases emerge in the following order [12]:normal (denoted with subscript 1) spheres, cylinders, lamellae (La), inverse (denoted with subscript 2) cylinders and
spheres. The spherical micelles may form aggregates to construct cubic (I1 or I2) or discontinuous cubic meso-structures (V1 or V2), while cylindrical micelles may combine to form hexagonal meso-structures (H1 or H2) (see Figure 1.7).
The shape of the micelles is related to the surfactant layer curvature, which is defined as the curvature of the surfactant layer in the vicinity of the interface of the hydropobic and hydrophilic parts. It can be seen in Figure 1.7 that different micelles has different curvatures towards water or oil. Surfactants that form normal micelles have a positive curvature towards water (convex), whereas the micelles having concave curvatures towards water are inverse (reverse) micelles. As the hydrophilic character of the molecule decreases, the spherical micelles reorganize to form rod-shaped micelles [13, 14] which have less curvature. Curvature has neither positive nor negative in the transition to lamella phase. Further increment in hydrophobic character results in formation of reverse rod-like (H2) and reverses spherical micelles (I2), respectively [13, 14]. Note that these structural changes of micelles are characteristic for every surfactant and not all the phases are needed to be observed. The surfactant layer curvature is determined by the balance between the interaction of hydrophobic and hydrophilic parts. The hydrophilic character is not only related with the polarity of the molecule but also related to its occupied volume.
Israelachvili and colleagues [8, 15] worked on the geometrical considerations of surfactant molecules and proposed a way that explains and predicts the resulting self assembled structures. Other additives may result in a totally different phase. Geometrical considerations involve the surface area of the polar head group and hydrophobic volume of the molecule. The surfactant molecules were modeled as an
ice cream cone in a micelle media (see Figure 1.8). Ratio of the volume of the hydrophobic region, v, to the length of the fully extended hydrophobic chain, lc,
resembles how the hydrophobic region is sterically hindered due to the hydrophobic forces acting on the system. The ratio of sterical hindrance to effective surface area, ao, of the head group determines the packing parameter, g.
Figure 1.8: Schematic representation of a surfactant molecule as an ice-cream cone. (redrawn image from [12])
The packing parameter is the true variable, which determines a specific phase diagram for every surfactant. The length of the hydrophobic chain is always shorter than the fully extended chain, l < lc . With this condition, critical values of g can be
calculated for a known geometry with estimation of the number of molecules forming the micelle (aggregation number)[8, 12, 15]. The number of molecules can easily be calculated with known v and ao values in the micelles or aggregates. Critical g parameters is given in Table 1.1.
Table 1.1 Critical g parameters [12].
Note that all of these structural considerations are valid at a constant temperature. Any change in the temperature, changes the hydrophilicity of the molecule in the micelle. For example, in general, nonionic surfactant gets more lipophilic with a rise in temperature [16-20].
1.1.2 Effect of the Additives
In principle, an additive can be considered as a variable that influence the g parameter. For instance, addition of inorganic salts decreases the headgroup repulsion between the ionic surfactants, which results in a decrease in the effective surface area at the interface. As a result, addition of salts increases the g value [21]. However, the effect of inorganic salts on the resulting mesostructure is a subject of great debate. In general, nature of the anion of a salt has a more crucial role both on the resulting mesostructure and solubility of the surfactants. In 1888, Lewith and Hofmeister published an article related to the precipitation of proteins with various salts and proposed an order for the anions for the minimum concentration values of precipitation. This order is later known as the Hofmeister series [22]. Since 1888, the scope of the series expanded to many topics in addition to protein solubility, including [23]: heats of hydration of alkali hydrates [24], the entropy change upon the hydration of ions [25], water activity coefficients [26, 27], ionic dilution entropy [28], polymer
cloud points [29, 30] etc. In addition to these, Collins and Washabaugh list more than one thousand references in 1985 about the subject [31, 32]. Despite the growing number of occasions that include the observation of the Hofmeister series, there is no accepted explanation for the behaviour of the anions in the molecular level. From the mutual solubility of surfactants and water with inorganic electrolytes, anions are classified into two groups: The anions on the left side of the Hofmeister series are called lyotropic and anions on the right side are called hydrotropic.
SO42- > HPO42- > CrO42-> CO32-> Cl- > Br- > NO3-> I-> ClO4-> SCN
-The Lyotropic anions reduce the solubility between surfactant and water whereas hydrotropics increases the solubility. The lyotropic anions support polar water structures and known as structure makers (salting-out). On the other hand, hydrotropic ions tend to break down the water clusters and help water molecules to hydrate the hydrophilic groups and increase the overall solubility (salting-in) [33]. However, explanations of the series with regard to solvent effects are controversial and there is significant evidence related to direct ion-macromolecule interactions rather than water structuring [34, 35].
There may be exceptions for the Hoffmeister series. One such exception is encountered, when transition metal aqua complex salts [M(H2O)n](X)2 (where M is a fırst row transition metal with +2 charge, and X is ClO4-, Cl-, or NO3-) are directly dissolved in CnEOm type surfactants without additional water. It is observed that nitrates and some chlorides are much more soluble than perchlorates. The ambiguity is related to the coordination ability of nitrate ions, which reduces the ionic strength of
the media [36-40].
Another important parameter in mesostructure formation is the addition of cosolvents and cosurfactants as organic additives. For instance, apolar organic molecules can be swelled by the micelle and CMC of the surfactants can be reduced [13]. Certain oils tend to swell in hydrophobic regions and the type of the LC can be changed to more lipophilic one [13]. For instance lamellar to reverse hexagonal transition was observed in C12EO3 system upon addition of decane [13]. At the same time, interlayer spacing values can be increased without changing the type of mesophase, which is very useful for mesostructured material synthesis [41, 42]
The literature is intricate and there is a vast number of work on binary, ternary or poly component amphiphile systems. Therefore, at this point it would be appropriate to narrow down the subject to certain type of surfactant systems used in this thesis.
1.2. Binary and Ternary systems of Oligo(ethylene oxide) Type
Surfactants (C
nEO
m+ H
2O and C
nEO
m+ H
2O +Oil)
The phase behaviour of CnEOm type surfactants (Oligo-ethyleneoxide type surfactants) have been extensively studied due to their wide application areas [43-48]. The number of carbon units and the ethoxy groups defines the efficiency of the surfactant molecule. Efficiency is related to the solubilizing capacity of the surfactant for oil-water mixtures. When the number of carbon units is increased, for both
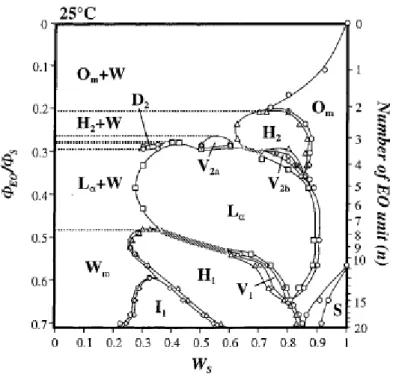
hydrophobic and hydrophilic parts, the efficiency of the surfactant molecule increases [49]. In general, phase diagrams of more efficient surfactants contain a LC region [49]. Micellar (reverse or normal), Hexagonal (reverse or normal), Cubic structures (reverse or normal), are common as the number of carbon units or the temperature is changed as a variable. Figure 1.9 shows the phase diagram of CnEOm surfactants [14], with respect to the change in the ethoxy unit length. Note that as the number of ethoxy units are increased surfactant gets more hydrophilic and more likely to form normal micelle LCs.
Figure 1.9: Phase diagram of CnEOm -water system as a function of the volume fraction of EO chain in the surfactant molecule and weight fraction of CnEOm at 25 °C. (WS is the weight fraction of CnEOm). [14]
The phase behaviour of CnEOm –water systems is greatly affected by the salt additions. As mentioned earlier, cation effects are insignificant as compared to anion
effects [35]. Kunieda et al. investigated the effect of added salts on the LC structures of CnEOm type molecules [14, 34]. It was shown that Cl- and SO42- ions reduce the melting points of the LC whereas the more hydrotropic SCN- has a positive effect on the melting temperature [34]. The d-spacing values show a decline when more hydrotropic ions are used [34]. A similar result regarding to the melting points were also obtained for TMS: CnEOm:H2O (TMS: transition metal aqua complex salt) systems by Dag et al. . Where more hydrotropic nitrate ion increases the melting points, Cl- does not [37].
1.3 Mixed Surfactant Systems
In general, each surfactant may resemble its intrinsic properties in a mixed surfactant system [50]. For this reason, mixed surfactant systems attract significant attention from detergent or skin care industry, due to their advantages over single surfactant systems. To better understand the mixed surfactant systems, (rather than trial and error methods) theoretical investigations have been performed by several research groups [50-53]. These studies are usually limited to micellar phases, since the LLCs are not good candidates for cleaning purposes. However it is possible to notify the LC phase regions in the phase diagrams of mixed surfactant systems. In one of these theoretical studies, Matsubara et al. have investigated the origin of the synergy and strong attractive force between the components of the following two systems: Sodiumdodecylsulfate (anionic, SDS)-CnEOm and Dodecylammoniumchloride (cationic, DCA)- CnEOm [51-53]. These studies are related to theoretical calculations, which are based on surface tension measurements
of mixed surfactant systems. Both SDS and DCA mix well with CnEOm , in spite of being different in their chemical nature and hydrophilicities. As expected, the hydrophobic interaction should be synergistic since both surfactants (ionic and nonionic) have the same alkyl chains at their hydrophobic parts. The synergy between these two nonionic-ionic surfactant systems is related to the direct and indirect interactions of the head groups of ionic surfactants and the ethoxy oxygens of the CnEOm surfactant molecules. In DCA- CnEOm system, the attraction is due to the direct interaction between the DCA cation and oxygen atoms of the ethoxy groups either through ion dipole interactions or hydrogen bonding. Therefore the DCA and CnEOm molecules interact directly. The attraction is an indirect one in the case of SDS-CnEOm and through the help of Na+ ion. That is, the Na+ ions stabilize the repulsion between negatively charged species. In fact, in a mixed surfactant system the presence of electric charges increases the attraction between the surfactant molecules [54]. The mixture of ionic-nonionic and ionic-ionic surfactants was studied extensively, but the research on mixed nonionic surfactant-nonionic amphiphilic copolymer systems is limited because the attraction between the surfactants is expected to be formed by weaker forces rather than ionic interactions [55].
The anionic-cationic systems were also investigated. The strong ionic interaction between oppositely charged head groups, may dictate hydrated precipitates of the catanionic surfactants [54, 56]. Nevertheless, it is possible to observe vesicular, micellar and LC regions in a ternary phase diagram of cationic:anionic:water system. Moreover, oppositely charged surfactant mixtures have lower critical micelle concentrations and they are more surface active due to the strong long range ionic interactions[54].
1.4. Transition Metal Salt (TMS): Amphiphile Systems
The mesostructures mentioned above, either normal micella phase or normal liquid crystalline phase containing a vast amount of water [45, 57, 58] or water and oil [34, 59, 60] have been known for a long time. However, these mesostructures may collapse at very low concentrations of ions, where the metal ion/surfactant ratio is around 0.03 to 0.8 [61-63]. Notice that the above system is usually liquid above these salt concentrations. In 2001 Dag et al, discovered a new lyotropic liquid crystalline system, which is formed only by mixing transition metal aqua complex salts (TMS) and Oligo(ethylene type) surfactants [37]. In the new system, the TMSs can be dissolved up to 3.2 mole ratio (metal ion/surfactant) keeping the LLC mesophase. The system has been further extended to Pluronic type surfactants [36, 40, 64, 65] which have much longer ethoxy chains as compared to Oligo surfactants, therefore the metal ion/surfactant mole ratio could be increased up to 15.0 mole ratio.
The structure directing force in this new system is the hydrogen bonds that are formed between the hydrogens of the coordinated water molecules of the TMS and the oxygens of the ethoxy groups of the hydrophilic parts of the surfactants [37-39, 66]. It is believed that the ethoxy groups surround the transition metals as of crown ethers but this time ethoxy groups are oriented in a helical fashion rather than being circular (see Figure 1.10)
Figure 1.10:Schematical representation of Hydrogen Bonding which leads to LC formation [37].
Several different transition metal salts were used including; Ni(II), Mn(II), Cd(II), Zn(II), Co(II) with Hofmeister counterions such as ClO4-, NO3-, Cl- and CoCl42- [36, 37, 39]. Cubic, 2D-Hexagonal, 3D-Hexagonal and tetragonal mesostructures are common . The phase diagrams show strong dependence on the nature of the counter-anion rather than the metal ion [36, 37, 39]. The new system has many advantages in true-liquid crystalline templating processes of mesoporous metals (see following chapters), metal sulfides and metal selenides [65]. It might be possible to prepare thin films of metal sulfides and metal selenides with such high metal ion content. Further research in this field is prone for the preparation of novel materials and to the understanding of interface chemistry in liquid crystals on a molecular level.
1.5. Importance of LLCs and Mesostructured Materials
Mesostructured materials are ordered materials having 2-50 nm sizes (IUPAC definition) at least in one spatial dimension. LLCs are used as templates in the synthesis of mesostructured and mesoporous materials. Ordered mesoporous materials (OMMs) are highly functional and promising due to their high surface area (ca. 1500m2/g) [21] which make them good candidates as catalysts, adsorbents or meso-enviroments for selective chemical reactions. They can also be regarded as anti quantum-dots or anti quantum rods [67] because of their nano-scale geometries. Therefore OMMs may also represent quantum size effects which also make them as candidates for novel electrical, optical and magnetic devices. [67]
In 1990 and 1992, Kuroda et al. [68, 69] and Mobil Research and Development Corp. [70, 71] reported the discovery of ordered mesoporous silica, respectively. Mobil company produced hexagonal (MCM41), cubic (MCM-48), and lamellar (MCM-50) mesoporous materials via trimethylammonium cationic surfactants as structure directing agents (SDA) [70, 71]. Since microporous materials (ordered materials having pore sizes smaller than 1.2 nm) are not suitable for applications involving large molecules, the interest in mesoporous silica increased and various mesoporous silica materials were produced [21, 72-74]. With the advancement in synthesis strategies a large variety of mesoporous materials were synthesized in differing geometries and properties including: metal-oxides [75-78], metal-sulfides [38, 62, 65, 79, 80], and metals [81].
There are two main pathways in the synthesis (Figure 1.11): Cooperative self assembly (CSA) and True Liquid Crystalline Templating (TLCT) pathways. In CSA
Figure 1.11:Schematical representation of the cooperative self- assembly and true liquid crystalline templating[21].
inorganic precursors and SDAs are mixed in a proper solvent with a suitable pH value and additional ingredients. The mixture self-assembles to an organic-inorganic liquid crystal. After LC formation, further polymerisation and condensation leads to a more rigid organic-inorganic framework, which can be calcined or extracted to produce mesoporous materials. The interaction between inorganic walls and micelles are more important than intermolecular interactions of surfactant molecules. Therefore synthesis strategies are developed for understanding this mechanism [21].
TLCT pathway includes primarily the formation of a liquid crystalline phase. Inorganic reaction precursors are usually incorporated after the LLC phase formation.
Later, the inorganic precursors are introduced to polymerise around the liquid crystalline micelles. Eventually, the organic parts can be ejected either by calcination or extraction, if desired. The inorganic framework truly mimics the liquid crystalline template, making the method more advantageous over CSA in terms of predictability of the final structure. Therefore, understanding of LC phase formation is crucial and mechanisms that lay beneath the formation of different mesostructures (2D hexagonal, 3D-hexagonal and cubic etc.) in LC are of considerable interest [36-39, 64, 66, 82].
The TLCT method can be used to produce metal or metal containing mesostructures and mesoporous materials. Attard et al. first introduced the TLCT method in 1995 [83]. In 1997, again Attard group produced mesoporous Pt microparticles using the TLCT method [84]. In 1999, the pathway is further extended to block copolymer type surfactants (significantly bigger molecules as compared to CnEOm or trimethyammonium type surfactants) in which metal precursor form Hydrogen Bonds with ethoxy groups in a crown ether fashion in the self assembly process [85]. In general, interaction between inorganic precursors and surfactant molecules should be strong enough (ionic or Hydrogen-Bonding etc.) to assemble such metal containing self-assembled structures [37, 86]. Otherwise the metal precursors will have a high tendency to crystallize out or phase separate[36, 86]. Another key factor is the ability of metal precursors to extend the framework during the condensation or polymerization process. If it is not possible to form a metal or metal containing framework around the LC micelles, the structure may collapse after calcination. The transition metal salt (TMS): amphiphile systems mentioned previously are good candidates for the production of metal containing mesostructures.
Recall that the amount of metal precursor that can be incorporated to the mesostructure is limited. However the interaction between the metal precursor and surfactants are so strong that metal precursors tend to stay around micelles rather than crystallizing out. Moreover increasing metal content of the structure means that a more complete network of metal ions surrounds the template, which makes it less probable for the structure to collapse after calcination. However as compared to mesoporous silica the metal ions content in these structures are still low [87]. Therefore it is very important to investigate various salt-surfactant systems to further increase the salt concentration.
This thesis work involves investigation of two new LLC systems; [Zn(H2O)6](NO3)2-C12EO10-CTAB-H2O and [Zn(H2O)6](NO3)2-C12EO10-SDS-H2O, where the metal ion/C12EO10 mole ratio is increased to the level of silica precursors in the mesoporous silica systems.
2. EXPERIMENTAL
2.1.
Materials
All chemicals are obtained from Sigma/Aldrich and used without further treatment.
2.2. Synthesis
2.2.1. Preparation of LLC phases of [Zn(H2O)6](NO3)2:No:CTAB
:H2O , [Zn(H2O)6](NO3)2: No:SDS:H2O and[Zn(H2O)2](Br)2:
No: H2O
Samples are prepared by mixing surfactants, salt and water. 10-Lauryl ether, C12H25 (CH2CH2O)10OH (represented as No), which is a solid paste is first melted and then mixed with other surfactants and salts. Cethyltrimethyl ammonium bromide (CTAB) and Sodium dodecyl sulfate (SDS) surfactants are powders and used without further treatment. Zinc nitrate (II) hexahydrate, [Zn(H2O)6](NO3)2 is ground before mixing.
All the samples are prepared as follows: To 20 ml sealed glass vials, grinded Zinc Nitrate salt (or Zinc Bromide salt) and ionic surfactants are added. Required amount of water was injected with micro-syringe and then the melted No surfactant was added immediately after water addition. The samples were constantly shaken in a water bath at 50oC for 1 day and at 70oC for another day. However the samples which
are not liquid up to 70oC were shaken at temperatures higher than the melting point (up to 84oC) for 2-3 hours. All vials were sealed with additional Teflon tapes. The vials were taken out of the hot bath after a gradual decline of temperature to 25oC. Some specific samples were prepared as follows.
Preparation of [Zn(H2O)6](NO3)2: No:CTAB:H2O at 6:1:0.5:3.5 mole ratios:
1.425 g of Zinc Nitrate(II) hexahydrate which is grinded in a ceramic mortar and 0.145 g of CTAB are mixed in a 20 ml glass vial. 0.05 g of deionized water is injected with a micro syringe. To this mixture, immediately after water addition, 0.5 g of No is added. The vials that are closed with a plastic rubber cap are additionally sealed with Teflon band and constantly shaken at 50oC for one day and 70oC for another day.
Preparation of [Zn(H2O)6](NO3)2: No:SDS:H2O at 5:1:0.5:7 mole ratios:
1.188 g of Zinc(II) Nitrate hexahydrate which is grinded in a ceramic mortar and 0.115 g of SDS are mixed in a 20 ml glass vial. 0.05 g of deionized water is injected with a micro syringe. To this mixture, immediately after water addition, 0.5 g of No is added to the mixture. The vials that are closed with a plastic rubber cap are additionally sealed with Teflon band and constantly shaken at 50oC for one day and 70oC for another day.
.
0.417 g of Zinc(II) Bromide dihydrate which is grinded in a ceramic mortar and 0.5 g of No are mixed in a 20 ml glass vial. 0.115 g of deionized water is injected with a micro syringe. The vials that are closed with a plastic rubber cap are additionally sealed with Teflon band and constantly shaken at 50oC for one day and 70oC for another day.
2.2.2. Samples after Preparation
The samples are stored in closed vials at room temperature (RT) after preparation. The samples, which are sandwiched between thin glass or Si(100) wafers are sealed with sticky bands to avoid water evaporation.
2.3 Instrumentation
2.3.1 Polarized Optical Microscopy
A Stereo Microscope Stemi 2000 with a halogen lamp, 6 V/10 W, equipped for bright field and phase contrast and a Meiji Techno ML9400 series polarizing microscope using convergent white light is used to characterize liquid crystalline phases and to measure the izotropisation temperature (ITs) using a hot stage under the microscope. The samples were prepared by sandwiching a small portion of LC sample in between thin glass slides, which were heated and cooled several times at slow rates (0.5oC per minute and 0.3oC per minute if it is close to the IT) to determine the ITs. The ITs are recorded at temperatures where fan-texture disappears and reforms during heating and cooling steps, respectively. The average temperature between these two IT points is recorded. If the difference between these two points is more than 2oC, the sample is heated and cooled back for complete homogenization.
The POM images were recorded in transmittance mode on a Meije Techno ML9400 series Polarising Microscope with reflected and transmitted light illumination, using white light between parallel and cross polarizers. The thermal properties of the mixtures were studied using a Leica Microscope Heating Stage 350 attached to the above microscope.
2.3.2. X-ray Diffraction
patterns were recorded on a Rigaku Miniflex diffractometer using Cu-Kα source operating at 30kV/15mA (generating 1.5405 Ǻ X-rays) and a Scintillator NaI(T1) detector with a Be window. The samples, which do not contain free water molecules, were prepared on 0.5 mm glass sample holders and repetitive measurements were done at different orientations of sample holder with respect to the source. The samples containing free water are prepared on glass slides and covered with 20 µm thick polypropylene films to avoid water evaporation. The adjustment of the sample - to avoid angle shifts in XRD pattern- is done with a special holder that carries the glass slide covered with polypropylene film in a way that sample does not cut X-rays at low angles. Measurements are done at various scan rates (ranging from 0.1 theta/min to 3 theta/min) at 0.01 data intervals. Data is collected between 1-35 2theta values
2.3.3. FT-IR (Fourier-Transform Infrared Spectroscopy)
The FTIR spectra are recorded using a Bruker Tensor 27 FTIR spectrometer. A high-sensitivity DLATGS detector is used with a resolution of 4 cm-1 and 128 scans For some exceptional samples, which are very thin and have low S/N ratio 256 scans are collected. The FTIR spectra are recorded as thin films on a single Si(100) wafer. However, some samples are measured by sandwiching between two Si(100) wafers (will not be mentioned if otherwise). The free water containing samples that are exposed to IR light and laser looses water due to heat induction of laser and IR light. The solid salt samples are prepared as KBr pellets.
The temperature dependent measurements are done using a heating stage integrated to the instrument, where the sample is again sandwiched between two Si
wafers. The temperature is controlled using a Cole-Parmer 89000-05 model Digi-Sense Temperature Controller.
2.3.4. Micro-Raman Spectroscopy
The micro-Raman spectra are recorded on a LabRam Jobin Yvon confocal Raman microscope with a 300 mm focal length. The spectrometer is equipped with a HeNe laser operated at 20 mW, polarized 500/1 with a wavelength of 632.817 nm, and a 1024x256 element CCD camera. The spectra, at low energy, are collected with a 532 nm green laser. The signal collected was transmitted through a fiber optic cable into a spectrometer with a 1800 or 600 g/mm grating. The Raman spectra are collected by manually placing the probe tip near the desired point of the sample on a silicon wafer. The same systems were also used to record the confocal microscopy images. To avoid water evaporation, some samples were sandwiched between two thin glass slides during the measurements.
3. RESULTS AND DISCUSSIONS
3.1 Sample Preparation and Measurements
To investigate the effect of charged surfactants on the LLC mesophases of TMS:C12EO10(No) systems (TMSO), some preliminary experiments were done in solution phase. In 10 ml of water, we were able to dissolve excess amounts (salt/C12EO10 10.0 mole ratio) of [Zn(H2O)6](NO3)2 salt (may be denoted as salt), 1.0 g of No, and 0.290g of CTAB. Aqueous mixtures were prepared by direct mixing and by stirring for 2 hours of all ingredients. The solutions were clear and stable at ambient conditions. On the other hand, preparations with other solvents such as ethanol and acetone were unsuccessful due to the insolubility of CTAB or TMS:CTAB in these solvents.
Despite their easy preparation, aqueous solutions are hard to deal with. First of all, it is necessary to remove excess water to form the LLC mesophase. At high concentrations of [Zn(H2O)6](NO3)2 salt (starting at 3.0 salt/C12EO10 mole ratio) complete water evaporation results in crystallization of various forms of Zn(II) salts from the mesophase. When the salt concentration is increased, the crystallization becomes faster, making it even more difficult to prepare homogeneous LLC mesophases. As the water evaporates, first, hexagonal mesophase forms and then crystallization starts. However the crystallization does not ruin the hexagonal mesophase, but only leads the salt crystals to grow bigger.
Since the water evaporation is problematic, we focused on preparation of supersaturated LLC phases with the help of cationic surfactants without additional solvents. All the ingredients (except water) were homogenized at high temperature (70oC) by constant shaking in closed vials. While sometimes, it was possible to prepare samples at high salt/No mole ratios such as 6.0, the preparations were never reproducible. We were not successful in keeping the LLC supersaturated. However, addition of a little amount of water, 0.05 g per 1.0g of No corresponding to 1.75 water/No mole ratio was enough for the preparation of the samples, which are stable for months, in closed vials. The procedure given in the experimental part; has a few crucial points to discuss regarding the preparation and data collection.
Note that, it is important to grind [Zn(H2O)6](NO3)2 crystals before mixing to obtain homogeneous mixtures. In addition, if the initial mixture is kept at temperatures higher than 50oC, immediately after mixing, Zinc(II) ions may be reduced by ethoxy groups of No surfactant [36]. If, however, No surfactant is kept at around 50oC for one day, reduction of metal ions does not take place. Note that, even 50oC is enough to dissolve the salt crystals in one day, without shaking the sample in water bath. However, all the samples were melted and shaken for another day to ensure complete homogenisation, since the LC phase is not as mobile as the liquid phase. Also note that the homogenized, dissolved metal ions are resistive to reduction.
Addition of small amounts of water, not only enhances solubility but also speeds up the homogenisation and avoids the reduction of metal ions. The samples, which contain additional water need to be removed from the water bath by gradually decreasing the temperature of the water bath. Unavoidably, some water evaporates at
temperatures such as 70-80oC. If the vials are instantly removed from the water bath, evaporated water condenses directly on the walls of the vial. Since the amount of water is crucial for our investigation we need to be sure that the water content stays the same during the sample preparation.
The homogenised samples were investigated using POM, FT-IR, Raman and XRD tecniques. The POM investigations have been done between two thin glass slides to avoid water evaporation. It is observed that after some time, the crystallisation of salt ions may start between the glass slides upon water evaporation through the edges. However the evaporation has no significant effect on izotropisation temperature, IT. During the FT-IR measurements, additional water evaporates due to heat accumulation via infrared light. The evaporation of water causes nitrate ions to coordinate to Zn(II) and may lead to further conformational changes on surfactant molecules (see latter chapters). Therefore, the results of the FT-IR measurements are of the samples with slightly different water content. We also recorded the FT-IR spectra of the samples by sandwiching the sample in between two silicon wafers to avoid the water evaporation. However, most of the time, sandwiching results sinusodial additional baselines. Based on our experience on FT-IR measurements, the Raman measurements were also done by sandwiching the samples to avoid direct interaction of laser with the sample, and water evaporation. The XRD measurements, were carried by spreading the samples on glass slide or by packing into 0.2 (or 0.5) mm glass sample holders. Some samples were recorded using thin polymer film on top of the samples to avoid water evaporation.
The TMSOAW (TMS:Oligo surfactant: Anionic surfactant: water systems) system acts in the same way as TMSOC(W) (TMS:Oligo surfactant: Cationic surfactant: water systems) systems do. That is, sample preparation, spectral and diffraction investigations are prone to same procedures.
3.2. The LLC mesophases of [Zn(H
2O)
6](NO
3)
2:N
o:CTAB:H
2O
System
3.2.1. Characterization of the LLC mesophases of [Zn(H2O)6](NO3)2:No:CTAB:H2O System
We have studied the phase behaviors of TMSOCW and TMSOC ([Zn(H2O)6](NO3)2 : No: CTAB) over a range of different mole ratios of [Zn(H2O)6](NO3)2 , non-ionic surfactant 10-lauryl ether (No), CTAB and water. The LLC mesophases of TMS:No and TMS:Pluronic, have been extensively investigated by our group [37]. Some of the results of the previous system (salt:No) will be used to compare with the new system, TMSOC and TMSOCW.
Dissolving TMS in LC mesophases is important for the synthesis of metal and metal containing mesostructured materials via TLCT method , because the structure of LLC mesophase can be directly transformed to the mesostructured materials. As mentioned earlier, one of the major difficulties in the synthesis of metal containing mesostructured materials using TLCT method is the low metal-ion content of the LLC mesophases. Especially, in order to obtain films of mesostructured metals (or metal containing mesotructures) one needs to prepare LLC mesophases with salt/No mole
ratio much higher than 0.8 which is the maximum in the water:salt:surfactant (WSS) systems. The other problem of the WSS system is the evaporation of water, where water evaporation leads to the collapse of the mesophase. The earlier studies on the TMSO systems by our group resolved some of these problems. The TMS:surfactant systems has higher metal ion content compared to the WSS system. One can dissolve nearly 30 times more salt in the liquid crystalline phase without water. However, in TMSO systems the metal ion to surfactant mole ratio is still low as compared to well established Si/EO mole ratio (0.6-0.7) in a stable mesostructured silica film [87]. Therefore increasing the metal ion to surfactant mole ratio to 6-8 is important for the synthesis of new mesostructured materials that are not possible by usual synthesis methods. Addition of charged surfactants to TMSO systems may at first be regarded as a fallacious path for increasing the metal ion content of the structure. The problem is that one needs to decrease the amount of charged species in the mesophase in order to dissolve additional charged species (salts). However, interestingly enough, our work shows that addition of a charged species can increase the solubility of metal ions in the mesophase. Normally, charged surfactants like CTAB or SDS cannot form LC phases with TMSs. The mixture of TMS:CTAB(or SDS):solvent crystallizes immediately after the removal of solvent. On the other hand, when a nonionic surfactant is added to this mixture, cationic surfactants somehow adapt to the mesophase and also help to increase the amount of metal ion that can be incorporated into the system.
The X-ray diffractions (XRD) and polarized optical microscopy (POM) images of the TMSOC samples showed no phase separation in the LC mesophase (only one phase). Therefore, there must be an assembly of charged surfactant and No
surfactant in the mesophase. The hydrophobic tail of the charged surfactant stays in the hydrophobic core of No, whereas the hydrophilic ammonium head group stays close to the interface of the alkyl group and ethoxy groups of No (see Figure 3.1).
Note that, in general, it is not possible to obtain stable hexagonal TMSOC systems with metal ion mole ratio more than 3.2 [37]. The salt to surfactant mole ratio, which are higher than 3.2, are not stable in the TMSOC systems. The salt crystallization takes place as in the case of TMSO systems. Only addition of cationic surfactant to the TMSO system can not overcome this problem.
Moreover, increasing the amount of cationic surfactant decreases the ITs, therefore the stability (see latter). One needs to add water to the system in order to prepare stable LLC mesophases at higher salt concentrations. We were able to prepare samples with 8.0 salt/No, mole ratio, by adding 3.5 mole of H2O for each mole of No (this is very low compared to H2O:No LLC systems). These samples are stable for months (see latter the discussion of the role of water)
The LLC mesophases were characterised using XRD and POM techniques. The XRD is a very useful tool in determining the structure of the mesophases. The unit cell dimensions (a) of the mesostructured materials varies between 2 and 50 nm (IUPAC definition), which corresponds to the small angles that are lower than 5 degrees (2θ). The XRD lines of our samples are observed between 1 and 5o, 2θ range. The unit cell varies between 50-75 Å, depending on the [Zn(H2O)6](NO3)2 salt, CTAB and water concentration. The diffraction lines observed in the TMSOCW systems can be indexed to either 2D or 3D hexagonal mesophases. Figure 3.2. shows the XRD pattern of a 6.0 salt/No mole ratio TMSOCW (2 months aged in a closed vial). The XRD pattern is characteristic for a 3D hexagonal mesophase with a unit cell parameter (a) of 70.2 Å (note that the unit cell parameter is directly proportional to the volume of the micelles). The diffraction pattern of the sample in Figure 3.2. has 8 diffraction lines that can be indexed to (100), (002), (101), (102), (103), (112), (203), and (301) planes of the 3D hexagonal mesophase. Note also that the plot of d-spacing values versus x (where d = xa and x= (8/10.667(h2+hk+k2)+3l2)1/2) is linear with an intercept at zero and a slope of 70.2 Å (Figure 3.3.)
2 3 4 5 0 2000 4000 (301) (20 3 ) (11 2 ) (103) (102) (101 ) (002) (100) In tensit y ( c ps ) 2θ x2.5
Figure 3. 2: XRD pattern of 6.0[Zn(H2O)6](NO3)2:1.0 No:0.5 CTAB: 3.5 H2O
Figure 3. 3 : Index graph for Figure 3.2.
0.0 0.2 0.4 0.6 0.8 1.0 0 10 20 30 40 50 60 70 o (301) (203) (112) (103) (102) (101) (002) (100) d/ Α [8(10.667(h2+hk+k2)+3l2]1/2
Figure 3.4 shows the diffraction pattern of a sample having a characteristic 2D-hexagonal mesophase with a unit cell parameter (62.35 A).The diffraction pattern of the sample has 4 diffraction lines that can be indexed to (100), (110), (200), and (210) planes of the 2D hexagonal mesophase. Note also that the plot of d-spacing values versus x (where d= xa and x=3/4 (h2+hk+k2)1/2 is linear with an intercept zero and a slope of (62.35 A) (Figure 3.5.)
Figure 3. 4: XRD pattern of 6.0[Zn(H2O)6](NO3)2:1.0 No:0.5 CTAB: 3.5 H2O after water evaporation.
Figure 3. 5: Index graph for Figure 3.4.
2 3 4 5 0 10000 20000 30000 (210 ) (200) (110) (1 00) In ten s it y ( c p s ) 2θ 0.0 0.8 1.6 0 50 100 d/ A 3/4 (h2+hk+k2)1/2 (100) (110) (200) (210) o
Note that the diffraction lines, which are characteristic for crystalline CTAB are absent in the diffraction pattern of the TMSOCW samples (Figure 3.6.). Moreover, there is no signal related to crystalline [Zn(H2O)6](NO3)2 at high angles (Figure 3.6.). These collectively show that CTAB and [Zn(H2O)6](NO3)2 are incorporated into the mesophase.
5 10 15 20 25 0 20000 40000 R e la ti v e I n te n s it y 2θ a b c x7
Figure 3.6:XRD pattern of a)6.0[Zn(H2O)6](NO3)2:1.0 No:0.5 CTAB:3.5H2O b) crystalline [Zn(H2O)6](NO3)2 and c) crystalline CTAB
However, most samples have a few diffraction lines at small angles to confidently determine the structure of the LLC phase. Therefore 2D and 3D hexagonal structures are difficult to differentiate in most cases. However the 2D hexagonal mesophase displays a fan texture between the crosed polarizers under a
POM compared to the texture of 3D-hexagonal phase (see Figure 3.7. and 3.8.)
The POM has two polarizes before and after the sample. The polarizers can be held crossed to each other, to block the passage of light to the visor. The observer sees no light, if the sample has an isotropic nature. However anisotropic materials such as crystalline solids and liquid crystals can change the polarization of the light as light passes through the sample; as a result observer sees a texture from the visor. The LC mesophases display characteristic textures under the POM between crossed polarizers. For instance, it is possible to differentiate lamella or hexagonal phases from their texture. On the other hand the cubic LC phases show dark images since they are isotropic. Figure 3.7.-3.8. and 3.9 shows characteristic fan textures for 2D-hexagonal, 3D-hexagonal and intermediate mesophases. The samples assigned to 2D hexagonal, display characteristic fan textures under POM, Figure 3.7. However, 3D-
Figure 3. 7: POM texture of a 2D hexagonal CTAB containing sample 2.0 [Zn(H2O)6](NO3)2/ No:0.5CTAB
Figure 3. 8 : POM texture of a 3D hexagonal CTAB containing sample 6.0 [Zn(H2O)6](NO3)2:1.0 No:1.0CTAB
hexagonal mesophase that is determined by XRD, displays characteristic textures as shown in Figure 3.8. Therefore the XRD and POM techniques were collectively used to characterize the LLC mesophases of the TMSO, TMSOC(W) and TMSA(W) systems.
3.2.2. Thermal and Structural properties of [Zn(H2O)6](NO3)2:No:CTAB:H2O System
The isotropization temperature (IT) is the temperature, where LC to liquid transition takes place. This temperature can be detected using a hot stage under a Polarized Optical Microscope, if the LLC mesophase has an anisotropic structure (such as 2D or 3D hexagonal). When the IT is reached, the LC starts to melt and the POM texture disappears, and eventually a dark image is observed. The IT of the samples is important on account for the fact that it shows how strong the intermolecular interactions are in the mesophase. The IT is an overall result of the interactions, namely; charged surfactant-nonionic surfactant, surfactants-positive charged species, surfactants-negative charged species, and ion-ion interactions. These interactions include Coulombic forces and weak forces (hydrogen bonding, Van der Wall’s etc.). Therefore the effect of each component with varying concentrations gives us clues about the molecular assembly of the system. To investigate these interactions we have performed IT measurements on many different samples.
Note that, the ITs listed in Appendix A may not be the melting points of the samples. There might be a small temperature range in which hexagonal to cubic
transition may take place (close to the melting point), since the cubic phase can not be distinguished from the liquid phase melting under POM (both phases are isotropic). However all the samples were also investigated during homogenization step in an oven, such that the samples were melting nearly at around the same temperature (around ITs). Therefore, if there is such a transition (hexagonal to cubic) its temperature range should be very narrow and around ITs.
There is a clear effect of the cationic surfactant on the phase properties of the salt:surfactant systems. All the samples prepared are birefringent in the concentration range investigated in this thesis (Appendix). Note that the hexagonal to cubic transition takes place at 3.2 mole ratio in the TMSO system, whereas TMSOC and TMSOCW systems form 2D/3D hexagonal structures between 2.0 – 8.0 salt/No mole ratios. The TMSOCW system forms 2D-hexagonal LC phases but 3D-hexagonal and intermediate phases are also observed at some concentrations.
Due to the lack of solubility of cationic surfactant, in the TMSOC and TMSOCW systems, the CTAB concentratios higher than 1.0 (CTAB/No), were not investigated in this thesis. The TMSOCW systems are stable up to a certain CTAB concentration, depending on the amount of [Zn(H2O)6](NO3)2 salt in the mesophase. The borders are not determined for each salt concentration, but the trend shows that one can incorporate more CTAB molecules by increasing the amount of [Zn(H2O)6](NO3)2 in the mesophase. For instance, at 2.0 mole ratio of salt/No, a sample containing 1.0 mole ratio of CTAB/No leaches out the CTAB crystals in 2 days. On the other hand, at 6.0 mole ratio of salt/No the mesophase is stable with 1.0 mole ratio of CTAB/No for several months. In addition, the crystallization time of the
![Figure 1.6:Schematic phase diagram of CTMABr in water. (CMC1: critical micelle concentration for spherical micelles, CMC2: critical micelle concentration for rod-like micelles) [11]](https://thumb-eu.123doks.com/thumbv2/9libnet/5845774.119862/25.892.259.661.123.514/schematic-critical-concentration-spherical-micelles-critical-concentration-micelles.webp)
![Figure 1.7: Nine different phases in a ternary surfactant:water:oil system. [4]](https://thumb-eu.123doks.com/thumbv2/9libnet/5845774.119862/26.892.193.763.462.1046/figure-different-phases-ternary-surfactant-water-oil.webp)
![Figure 1.10:Schematical representation of Hydrogen Bonding which leads to LC formation [37]](https://thumb-eu.123doks.com/thumbv2/9libnet/5845774.119862/36.892.205.756.107.445/figure-schematical-representation-hydrogen-bonding-leads-lc-formation.webp)
![Figure 1.11:Schematical representation of the cooperative self- assembly and true liquid crystalline templating[21]](https://thumb-eu.123doks.com/thumbv2/9libnet/5845774.119862/38.892.145.821.205.565/figure-schematical-representation-cooperative-assembly-liquid-crystalline-templating.webp)

 2 :1.0 N o :1.0CTAB](https://thumb-eu.123doks.com/thumbv2/9libnet/5845774.119862/58.892.214.733.109.504/figure-pom-texture-hexagonal-ctab-containing-sample-ctab.webp)
