Tar. Bil. Der. Dergi web sayfası:
www.agri.ankara.edu.tr/dergi www.agri.ankara.edu.tr/journalJournal homepage:
TARIM BİLİMLERİ DERGİSİ
—
JOURNAL OF AGRICUL
TURAL SCIENCES
22 (2016) 187-195
Canal Geometry, Flow Velocity, Dallisgrass (Paspalum dilatatum Poir.)
Density and Soil Phosphorous Effects on Hydraulic Resistance of
Vegetated Canals
Abolfazl NASSERIa
aAgricultural Engineering Research Department, East Azarbaijan Agricultural and Natural Resources Research and Education Center, AREEO, Tabriz, IRAN
ARTICLE INFO
Research Article
Corresponding Author: Abolfazl NASSERI, E-mail: [email protected], Tel: +98 (412) 266 39 15 Received: 22 December 2013, Received in Revised Form: 30 December 2014, Accepted: 12 January 2015
ABSTRACT
Dallisgrass (Paspalum dilatatum Poir.) reduces discharges in irrigation canals and causes problems in operation and maintenance of canals. This study has been conducted to determine roughness coefficient in vegetated canals caused by dallisgrass and to investigate the relationship between available soil phosphorous and dry mass of dallisgrass. The study also aims to find out the relationships among roughness coefficient, dallisgrass density and soil phosphorous in vegetated canals in Moghan plain, Iran. The results showed that the roughness coefficient varied from 0.01 to 0.32 and averaged at 0.09. The variation in roughness coefficient in vegetated canals by dallisgrass may be explained solely by the flow velocity and canal slope, assuming that there are no spatial variability’s of the other affecting variables. Therefore, a regression model comprises both the roughness coefficient as a dependent variable and the flow velocity and canal slope as an independent variable is developed. The available soil phosphorus both on the sides and at the bottom of vegetated canals were from 4.2 to 37 mg kg-1. The highest dry mass of 16 kg per 100 m2 was acquired from the canal with soil
phosphorus of 16.7 mg kg-1. Also, another model was developed to describe the roughness coefficient as a function of
the flow velocity, canal slope, dallisgrass density and soil phosphorous. It is recommended that identifying phosphorus sources and limiting its distribution in irrigation canals is necessary to reduce the dallisgrass density in canals. Keywords: Available soil phosphorous; Dallisgrass (Paspalum dilatatum Poir.); Hydraulic resistance; Irrigation canals; Roughness coefficient
Otlanmış Kanallarda Kanal Geometrisi, Akış Hızı, Adi Yalancı Darı
(Paspalum dilatatum Poir.) Yoğunluğu ve Toprak Fosfor Oranının
Hidrolik Direnç Üzerine Etkisi
ESER BİLGİSİ
Araştırma Makalesi
Sorumlu Yazar: Abolfazl NASSERI, E-posta: [email protected], Tel: +98 (412) 266 39 15 Geliş Tarihi: 22 Aralık 2013, Düzeltmelerin Gelişi: 30 Aralık 2014, Kabul: 12 Ocak 2015
1. Introduction
Dallisgrass (Paspalum dilatatum Poir.) grows in water conveyance canals and reduces water velocity and discharges in these canals. Consequently, dallisgrass causes problems in operation and maintenance of irrigation and drainage canals. Dallisgrass affects water velocity in irrigation canals and furrows.
Water velocity and soil infiltration along an irrigation canal and furrows depend on several factors such as time, canal or furrow characteristics (compaction and surface sealing), soil characteristics and flow (wetted perimeter and flow section area) characteristics (Kostiakov 1932; Izadi & Wallender 1985; Trout 1992; Nasseri et al 2004; Nasseri et al 2008). Also in surface irrigation, Heermann et al (1969) and Esfandiari & Maheshwari (1998) reported that surface roughness affects these factors and is one of the key input parameters in surface irrigation models. Accordingly, infiltration parameters could be affected by surface roughness which is often expressed in terms of Manning’s roughness coefficient, n (Harun-Ur-Rashid 1990). Trout (1992) reported that roughness varies according to crop and soil characteristics such as
crop growth, residue management, tillage practices and soil type. On the other hand Kruse et al (1965) and Maheshvari & McMahon (1992) reported that roughness changes with depths of flow and then Trout (1992) related surface roughness with the power function of flow velocity. Kruse et al (1965) and Heermann et al (1969) stated that roughness is connected with absolute roughness and hydraulic radius. In suitable conditions for grass germination, its distribution was made by seed (Tropical Forages 2009). There are several factors affecting the growth and distribution of this grass in water canals. The moist and fertile environment are the basic factors in the growth of this grass. This grass grows in soils with a pH of 4.5 to 8.0 (Tropical Forages 2009) and its production ranges from 3 to 15 t ha-1 year-1. Research on dallisgrass response to soil nutrients and canal water properties is very limited. On the other hand, Moghan plain is one of the most important region for agricultural production in Iran and dallisgrass covers the majority of earth canals which are used for the transport of water to the farms.
This study has been conducted to determine roughness coefficient in vegetated canals caused by dallisgrass and to investigate the relationship between available soil phosphorous and dry mass of dallisgrass.
ÖZET
Adi yalancı darı (Paspalum dilatatum Poir.) sulama kanallarında akışı azaltmakta ve işletme-bakım sorunlarına neden olmaktadır. Bu çalışma, otlanmış kanallarda Adi yalancı darı’nın pürüzlülük katsayısını nasıl etkilediğini ve topraktaki mevcut fosfor ile adi yalancı darı kuru ağırlığı arasındaki ilişkiyi araştırmak amacıyla yapılmıştır. Ayrıca; çalışma İran’da Mogan ovasında bulunan otlanmış kanallardaki pürüzlülük katsayısı ile adi yalancı darı yoğunluğu ve topraktaki mevcut fosfor miktarı arasındaki ilişkiyi belirlemeyi de amaçlamaktadır. Araştırma sonucunda; pürüzlülük katsayısı değerleri 0.01-0.032 arasında değişmiş ve ortalama olarak 0.09 olarak bulunmuştur. Diğer değişkenlerin olmadığı varsayıldığında, adi yalancı darı ile otlanmış kanallardaki pürüzlülük katsayısı değişkenlerini, sadece akış hızı ve kanal eğiminin etkilediği söylenebilir. Bu nedenle; bağımlı değişken olarak pürüzlülük katsayısını, bağımsız değişken olarak da akış hızı ve kanal eğimini kapsayan regresyon modeli geliştirilmiştir. Otlanmış kanalların kenarlarında ve tabanındaki mevcut fosfor miktarı 4.2’den 37 mg kg-1’e kadar yükselmiştir. En yüksek kuru madde miktarı 16.7 mg kg-1 fosfora sahip
kanaldan 100 m2’ye 16 kg olarak elde edilmiştir. Ayrıca, akış hızı fonksiyonu, kanal eğimi, adi yalancı darı yoğunluğu
ve mevcut toprak fosforunu pürüzlülük katsayısı olarak tanımlayan başka bir model de geliştirilmiştir. Sonuç olarak; kanallardaki adi yalancı darı yoğunluğunu azaltmak için fosfor kaynaklarının belirlenmesi ve sulama kanallarının dağılımının sınırlandırılmasının gerekli olduğu önerilmektedir.
Anahtar Kelimeler: Yarayışlı toprak fosforu; Adi yalancı darı (Paspalum dilatatum Poir.); Hidrolik direnç; Sulama kanalları; Pürüzlülük katsayısı
189
Ta r ı m B i l i m l e r i D e r g i s i – J o u r n a l o f A g r i c u l t u r a l S c i e n c e s 22 (2016) 187-195
2. Material and Methods
The experimental area was Moghan plain located at the north-west of Iran with the latitude from 39º 22’ to 39º 45’ N, longitude from 47º 22’ to 47º 45’ E and sea level 32.0 m. The annual average air temperature, relative humidity and pan evaporation are 14.5º C, 72% and 111 mm month-1, respectively. Annual rainfall in this plain is 332 mm (Nasseri 2000).
In the experimental area nine sections of earth canal that vegetated with dallisgrass (Paspalum dilatatum Poir.) were selected (Karimi 1995). The water flow velocity was measured by a flowmeter and canals geometric characteristics (with profilimetery
devices) were measured by means of profilimetery devices at the 35 parts of these nine separate canals. The roughness coefficient was estimated by the Equation 1 (Manning’s relation) (Chow 1959).
V
S
R
n
=
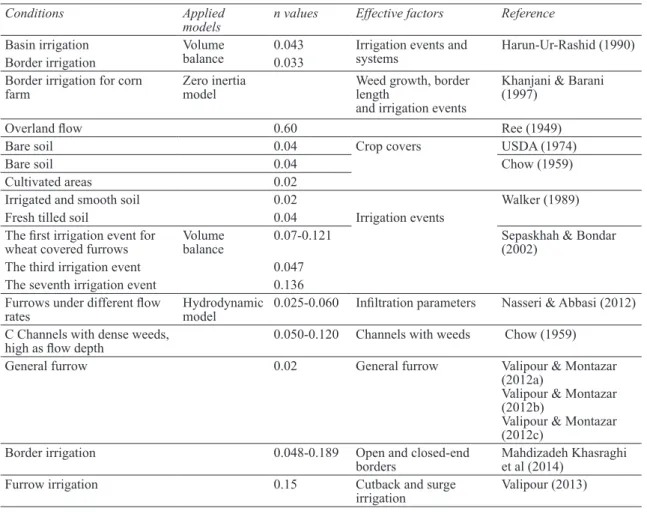
0.67 0.5 (1)Where; n, R, S and V, are roughness coefficient, hydraulic radius (m), canals bed slop (mm-1) and water flow velocity (m s-1), respectively. Table 1 shows roughness coefficient values for different conditions and it indicates n varies with different effective factors which mentioned in Table 1.
Table 1- Roughness coefficient values for different conditions of irrigation
Çizelge 1- Farklı sulama koşulları için pürüzlülük katsayısı değerleri
Conditions Applied
models n values Effective factors Reference
Basin irrigation Volume
balance 0.043 Irrigation events and systems Harun-Ur-Rashid (1990)
Border irrigation 0.033
Border irrigation for corn
farm Zero inertia model Weed growth, border length
and irrigation events
Khanjani & Barani (1997)
Overland flow 0.60 Ree (1949)
Bare soil 0.04 Crop covers USDA (1974)
Bare soil 0.04 Chow (1959)
Cultivated areas 0.02
Irrigated and smooth soil 0.02 Walker (1989)
Fresh tilled soil 0.04 Irrigation events
The first irrigation event for
wheat covered furrows Volume balance 0.07-0.121 Sepaskhah & Bondar (2002)
The third irrigation event 0.047
The seventh irrigation event 0.136
Furrows under different flow
rates Hydrodynamic model 0.025-0.060 Infiltration parameters Nasseri & Abbasi (2012)
C Channels with dense weeds,
high as flow depth 0.050-0.120 Channels with weeds Chow (1959)
General furrow 0.02 General furrow Valipour & Montazar
(2012a)
Valipour & Montazar (2012b)
Valipour & Montazar (2012c)
Border irrigation 0.048-0.189 Open and closed-end
borders Mahdizadeh Khasraghi et al (2014)
Furrow irrigation 0.15 Cutback and surge
190
Ta r ı m B i l i m l e r i D e r g i s i – J o u r n a l o f A g r i c u l t u r a l S c i e n c e s 22 (2016) 187-195The dallisgrass density was measured by a wooden square plot. Then, the density was converted to the 100 m2 (1 m width and 100 m length of canal). Dry mass of this grass was measured by an oven with temperature of 108 ºC for 24 h. The bottom and sides of irrigation canals were subjected to soil samplings (Figure 1). The available soil phosphorus was measured by Olsen or sodium bicarbonate method (Olsen & Dean 1976). Electrical conductivity and pH of canal water were measured, as well in this study. The regression analysis with the least square procedure was applied to relate a dry mass of grass to the soil phosphorus.
Water surface Da llis gr as s Da llis gr as s Canal side Canal side Canal bottom
Figure 1- A cross section of vegetated irrigation canal with dallisgrass Şekil 1- Adi yalancı darı ile otlanmış olan sulama kanalının kesiti 3. Results and Discussion
3.1. Dallisgrass resistance to the water flow in irrigation canals
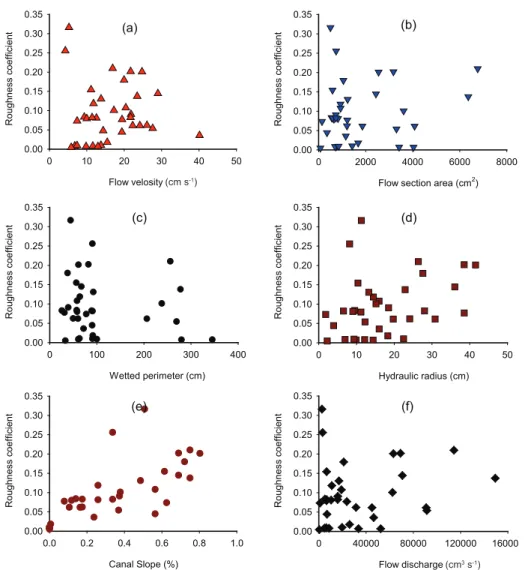
The roughness coefficient variations with the flow velocity, flow section area, wetted perimeter, hydraulic radius and canals slopes were depicted by the Figure 2 (a-e). The results showed that the roughness coefficient varied from 0.01 to 0.32 and averaged as 0.09. The flow velocity ranged from 4 to 40 and
averaged as 17 cm s-1. The flow section area ranged from 75 to 6763 cm2 and had an average value of
1840 cm2. The wetted perimeter changed between 26-346 cm and averaged as 111 cm. The hydraulic
radius averaged as 18 cm and was changed from 2 to 42 cm. The canal slopes ranged from 0.01 to 0.80
and averaged as 0.33 percent. Also, the flow discharge varied from 400 to 149000 cm3 s-1 and averaged as
33000 cm3 s-1.
Figure 1- A cross section of vegetated irrigation canal with dallisgrass
Şekil 1- Adi yalancı darı ile otlanmış olan sulama kanalının kesiti
3. Results and Discussion
3.1. Dallisgrass resistance to the water flow in irrigation canals
The roughness coefficient variations with the flow velocity, flow section area, wetted perimeter, hydraulic radius and canals slopes were depicted by the Figure 2 (a-e). The results showed that the roughness coefficient varied from 0.01 to 0.32 and averaged as 0.09. The flow velocity ranged from 4 to 40 and averaged as 17 cm s-1. The flow section area ranged from 75 to 6763 cm2 and had an average value of 1840 cm2. The wetted perimeter changed between 26-346 cm and averaged as 111 cm. The hydraulic radius averaged as 18 cm and was changed from 2 to 42 cm. The canal slopes ranged from 0.01 to 0.80 and averaged as 0.33 percent. Also, the flow
discharge varied from 400 to 149000 cm3 s-1 and averaged as 33000 cm3 s-1.
The partial correlations of roughness coefficient were statistically significant by 5% (P≤0.05) for flow velocity and canal slope. According to the results of this study 25 to 45% of the variation of roughness coefficient in vegetated canals by dallisgrass (Paspalum dilatatum Poir.) is caused by the flow velocity and canal slope, respectively, when all the other variables are held constant. In other words, the variation in roughness coefficient in vegetated canals by dallisgrass (Paspalum dilatatum Poir.) may be explained solely by the flow velocity and canal slope, assuming that there are no spatial variability’s of the other affecting variables. Therefore, a regression model comprises both of the roughness coefficients and in vegetated canals by dallisgrass (Paspalum dilatatum Poir.) as a dependent variable and the flow velocity (V, cm s-1 and S
0, %) and canal slope as
independent variables is derived by Equation 2.
V
S
2.257
n
=
o (2)The correlation coefficient of the model is 0.90 which explains more than 80% of the variability in roughness coefficient. Table 2 shows the analysis of variance in the estimated roughness coefficient in the regression model. Since the P value in the table is less than 0.005, there is a statistically significant relationship between the variables at P≤0.005.
The measured roughness coefficient versus estimated values from obtained model at a low limit, predicted and upper limit values are shown in Figure 3. The calibration line models were developed as the following for the measured and predicted roughness coefficient. As follows, there are satisfactory agreements between the measured and predicted values of roughness coefficient.
Upper limit line
n
predicted=
1.52
(n
(n
measuredmeasured))
One by one line
n
predicted=
1.00
(n
(n
measuredmeasured))
Regression line
n
predicted=
0.81
(n
(n
measuredmeasured))
191
Ta r ı m B i l i m l e r i D e r g i s i – J o u r n a l o f A g r i c u l t u r a l S c i e n c e s 22 (2016) 187-195 0 10 20 30 40 50 0.00 0.05 0.10 0.15 0.20 0.25 0.30 0.35 Flow velosity (cm/s) R oughness coef fici ent (a) (cm s-1) 0 2000 4000 6000 8000 0.00 0.05 0.10 0.15 0.20 0.25 0.30 0.35Flow section area (cm2)
R oughness coef fici ent (b) 0 100 200 300 400 0.00 0.05 0.10 0.15 0.20 0.25 0.30 0.35 Wetted perimeter (cm) R oughness coef fici ent (c) 0 10 20 30 40 50 0.00 0.05 0.10 0.15 0.20 0.25 0.30 0.35 Hydraulic radius (cm) R oughness coef fici ent (d) 0.0 0.2 0.4 0.6 0.8 1.0 0.00 0.05 0.10 0.15 0.20 0.25 0.30 0.35 Canal Slope (%) R oughness coef fici ent (e) 0 40000 80000 120000 160000 0.00 0.05 0.10 0.15 0.20 0.25 0.30 0.35 Flow discharge (cm3/s) R oughness coef fici ent (f) (cm3 s-1)
Figure 2- The roughness coefficient variations versus variations of flow velocity a, flow section area; b, wetted perimeter; c, hydraulic radius; d, and canal slope w; e, and flow discharge f
Şekil 2- a, akış hızı; b, akış kesit alanı; c, ıslak çevre; d, hidrolik yarıçap; e, kanal eğimi ve f, debi değişimlerine bağlı pürüzlülük katsayısı değişimleri
Table 2- Analysis of variance and regression for acquired model of roughness coefficient
Çizelge 2- Elde edilen pürüzlülük katsayısı modelinin istatistiksel analizleri
Source Sum of squares Df Mean square F-value P-value
Model 0.415 1 0.415 148.260 0.000
Residual 0.095 34 0.003
Total 0.511 35
Parameter Estimate Standard error t- statistic P-value
Measured roughness coefficient 0.0 0.1 0.2 0.3 0.4 0.5 0.6 0.7 Pr edi ct ed r oughness coef fici ent 0.0 0.1 0.2 0.3 0.4 0.5 0.6 0.7 Average values Low limit values Upper limit values 4. Low limit Line 1. Upper limit Line 3. Regression line 2. 1:1 line
1 2
3 4
Figure 3- Predicted roughness coefficient versus measured values
Şekil 3- Ölçülen ve tahmin edilen pürüzlülük katsayısı değerleri
3.2. Dallisgrass response to the soil phosphorous The measured available soil phosphorous values are shown in Figure 4. The water electrical conductivity (EC), pH and soil phosphorous averaged as 750.60±9.42 (mmhos cm-1), 8.55±0.01 and 14.45±3.19 mg kg-1, respectively.
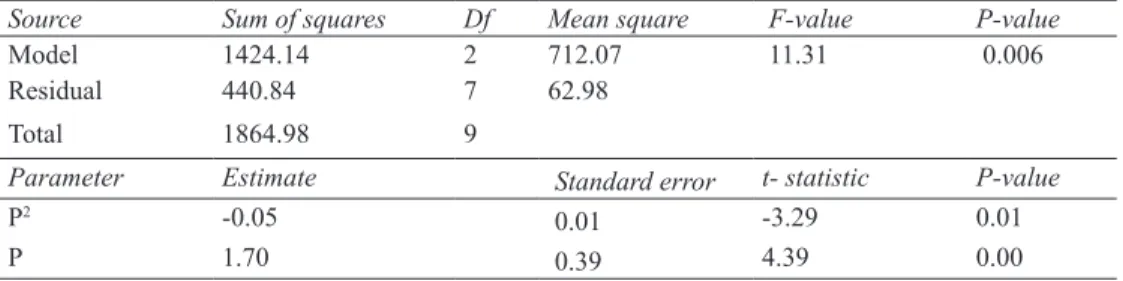
A regression model for dry mass of dallisgrass as a function of soil phosphorus was obtained (Moghaddam 2008) as shown in Equation 3.
DM = -0.05 P2 + 1.70 P (3)
Where; DM and P, are dry mass of dallisgrass (kg per 100 m2) and soil phosphorus (mg kg-1), respectively. This model and its paramerts of P and P2 are significant in the model (Table 3). The
determination coefficient (R2) of this model is determined as 0.76, which means that about 76% of variation in dry mass can be explained by soil phosphorus. Measured and predicted dry mass of dallisgrass versus soil phosphorus values were shown in Figure 5.
3.3. Relationship between roughness coefficient, dallisgrass density and soil phosphorous
A model comprise roughness coefficient as a function of the flow velocity, canal slope, dallisgrass density and soil phosphorous was developed by regression analysis and presented in Equation 4.
Table 3- Analysis of variance and regression for acquired model of dry mass
Çizelge 3- Elde edilen kuru madde modelinin istatistiksel analizleri
Source Sum of squares Df Mean square F-value P-value
Model 1424.14 2 712.07 11.31 0.006
Residual 440.84 7 62.98
Total 1864.98 9
Parameter Estimate Standard error t- statistic P-value
P2 -0.05 0.01 -3.29 0.01 P 1.70 0.39 4.39 0.00 Canal sections 1 2 3 4 5 6 7 8 9 Soi l phos phor us (m g kg -1 ) 0 5 10 15 20 25 30 35 40
Figure 4- Available soil phosphorus from nine sections of canals (mg kg-1)
Şekil 4- Kanalın dokuz kesitinde yarayışlı toprak
193
Ta r ı m B i l i m l e r i D e r g i s i – J o u r n a l o f A g r i c u l t u r a l S c i e n c e s 22 (2016) 187-195 V S ) 0.289(DD.P n= 0.25 o (4)Where; DD, is dallisgrass density per 1 m2. The determination coefficient of the model is 0.80 which fitted models explain 80% of the variability in roughness coefficient with mentioned variables. The analysis of variance for the estimated roughness coefficient by the regression model was shown in Table 4. Since the P value in the table is less than 0.005, there is a statistically relationship between the variables at the 0.5% level (P≤0.005).
Figure 6 shows the measured roughness coefficient versus estimated values from Equation 4 as low limit, predicted and upper limit values. The calibration line models were developed as the following for the measured and predicted roughness coefficient. There are satisfactory agreements between the measured and predicted values of roughness coefficient.
4. Conclusions
Investigation of dallisgrass (Paspalum dilatatum Poir.) resistance to the water flow in irrigation canals and dalligrass response to the soil phosphorous indicates the following results.
The roughness coefficient varied from 0.01 to 0.32 and averaged at 0.09. The variation in roughness coefficient in vegetated canals by dallisgrass may be explained solely by the flow velocity and canal slope, assuming that there are no
0 5 10 15 20 25 0 5 10 15 20 25 30 35 40 Soil phosphorus (ppm) D ry ma tte r ( kg 100 -1m -2) Soil phosphorus (mg kg-1) Dry matter (kg per 100 m 2) DM=-0.05 P2+1.70 P
Figure 5- Measured and predicted dry mass of dallisgrass versus soil phosphorus values, where DM and P are dry mass of dallisgrass (kg per 100 m2) and soil phosphorus (mg kg-1)
Şekil 5- Ölçülen ve tahmin edilen adi yalancı darı kuru madde miktarına bağlı toprak fosfor değerleri, (DM ve
P adi yalancı darı kuru madde miktarı (kg 100 m-2),
toprak fosforu (mg kg-1)
Table 4- Analysis of variance and regression for acquired model of roughness coefficient
Çizelge 4- Elde edilen pürüzlülük katsayısı modelinin istatistiksel analizleri
Source Sum of squares Df Mean square F-value P-value
Model 0.411 1 0.41 139.94 0.000
Residual 0.099 34 0.003
Total 0.511 35
Parameter Estimate Standard error t- statistic P-value
0.289 0.024 11.83 0.000
Measured roughness coefficient 0.0 0.1 0.2 0.3 0.4 0.5 0.6 Pr edi cted r oughness coef fici ent 0.0 0.1 0.2 0.3 0.4 0.5 0.6 Average values Low limit values Upper limit values 4. Low limit Line
1. Upper limit Line 3. Regression line 2. 1:1 line
1 2
3
4
Figure 6- Measured and predicted roughness coefficient values
Şekil 6- Ölçülen ve tahmin edilen pürüzlülük katsayısı değerleri
Upper limit line
n
n
predictedpredicted = 1.53=
=
1
1
.
.
00
53
(
(
n
n
measuredmeasured)
)
One by one line
n
n
predictedpredicted = 1.00=
=
1
1
.
.
00
53
(
(
n
n
measuredmeasured)
)
Regression line
n
n
predictedpredicted = 0.80=
=
1
1
.
.
00
53
(
(
n
n
measuredmeasured)
)
spatial variability’s of the other affecting variables. Therefore, a regression model comprises both of the roughness coefficient as a dependent variable and the flow velocity and canal slope as independent variables is provided. The available soil phosphorus of the sides and bottom of vegetated canals changed between 4.2 to 37 mg kg-1. The highest dry mass of was acquired as 16 kg per 100 m2 from the canal with soil phosphorus of 16.7 mg kg-1. A model was developed to describe the roughness coefficient as a function of the flow velocity, canal slope, dallisgrass density and soil phosphorous. It is suggested that phosphorous sources should be identified and the distribution of phosphorous should be limited in irrigation canals so that the density of dalligrass in canals can be reduced. Research on roughness coefficient for other types of vegetation in irrigation and drainage canals is recommended.
References
Chow V T (1959). Open Channel Hydraulics. McGraw-Hill, New York, 680 pp
Esfandiari M & Maheshwari B L (1998). Suitability of selected flow equations and variation of Manning’s n in furrow irrigation. Journal of Irrigation and
Drainage Engineering ASCE 124(2): 89-95
Harun-Ur-Rashid M (1990). Estimation of Manning’s roughness coefficient for basin and border irrigation.
Agricultural Water Management 18: 29-33
Heermann D F, Wenstrom R J & Evans N A (1969). Prediction of flow resistance in furrows from soil roughness. Transactions of the ASAE 12: 482-489 Izadi B & Wallender W W (1985). Furrow hydraulic
characteristics and infiltration. Transactions of the
ASAE 28(6): 1901-1908
Karimi H (1995). Weed crops in Iran. Tehran University Publishing. Tehran. Iran
Khanjani M J & Barani G A (1997). Determination of roughness coefficient in border irrigation under corn cultivation. Agricultural Science Tabriz University 4: 79-92
Kostiakov A V (1932). On the dynamics of the coefficient of water percolation in soils and on the necessity for studying it from a dynamics point of view for purposes of amelioration. Transactions of the Sixth
Commission of International Society of Soil Science, part A pp. 17-21
Kruse E G, Huntley C W & Robinson A R (1965). Flow resistance in simulated irrigation borders and furrows. Conservation Res Report # 3. USDA-Agricultural Research Service. Washington, DC
Mahdizadeh Khasraghi M, Gholami Sefidkouhi M A & Valipour M (2014). Simulation of open and closed-end border irrigation systems using SIRMOD.
Archives of Agronomy and Soil Science 61: 929-941
Maheshwari B L & McMahon T A (1992). Modeling shallow overland flow in surface irrigation. Journal of
Irrigation and Drainage Engineering ASCE 118(2):
201-217
Moghaddam M (2008). Advanced Engineering Statistics. Faculty of Agriculture, Department of Irrigation. Tabriz University (in Farsi). Iran
Nasseri A (2000). Flow resistance coefficient in vegetated canals. Iranian Agricultural Engineering Institute (IAERI). Agricultural Research and Education Organization (AREO). Iran. pp. 251
Nasseri A, Neyshabori M R, Fakherifard A, Moghaddam M & Nazemi A H (2004). Field measured furrow infiltration functions. Turkish Journal of Agriculture
and Forestry 28: 93-99
Nasseri A, Neyshabori M R & Abbasi F (2008). Effectual components on furrow infiltration. Irrigation and
Drainage 57: 481-489
Nasseri A & Abbasi F (2012). Furrow Roughness Coefficient: Estimation by Hydrodynamic Model, Infiltration Equation Response to It. LAP LAMBERT Academic Publishing. 52 pp
Olsen S R & Dean L A (1976). Phosphorus. In: Methods
of soil analysis. Part 2: Physical and mineralogical properties, including statistics of measurement and sampling. 4th ed., (Ed. C.A. Black, D.D. Evans, L.E.
Ensminger, J.L. White, F.E. Clark and R.C. Dinauer). Madison, WI, American Society of Agronomy. pp. 1035-1048
Ree W O (1949). Hydraulic characteristics of vegetation and vegetated waterways. Agricultural Engineering
30(4): 184-189
Sepaskhah A R & Bondar H (2002). Estimation of Manning roughness coefficient for bare and vegetated furrow irrigation. Biosystems Engineering 82(3): 351-357
195
Ta r ı m B i l i m l e r i D e r g i s i – J o u r n a l o f A g r i c u l t u r a l S c i e n c e s 22 (2016) 187-195
Tropical Forages (2009). Available at http://www. tropicalforages.info/key/Forages/Media/Html/ Paspalum_dilatatum.htm
Trout T J (1992). Furrow flow velocity effect on hydraulic roughness. Journal of Irrigation and Drainage
Engineering ASCE 118: 981-987
USDA (US Department of Agriculture) (1974). Border Irrigation, Ch4, Sect15, National Engineering Handbook. Soil Conservation Service, Washington, DC, 55 pp
Valipour M & Montazar A A (2012a). An evaluation of SWDC and WinSRFR models to optimize of infiltration parameters in furrow irrigation. American
Journal of Scientific Research 69: 128-142
Valipour M & Montazar A A (2012b). Optimize of all effective infiltration parameters in furrow irrigation using visual basic and genetic algorithm programming.
Australian Journal of Basic and Applied Sciences 6(6): 132-137
Valipour M & Montazar A A (2012c). Sensitive analysis of optimized infiltration parameters in SWDC model.
Advances in Environmental Biology 6(9): 2574-2581
Valipour M (2013). Increasing irrigation efficiency by management strategies: cutback and surge irrigation.
ARPN Journal of Agricultural and Biological Science 8: 35-43
Walker W R (1989). Guidelines for Designing and Evaluating Surface Irrigation Systems. FAO. Rome. Italy